
The Hotlist (11/04/21)
We try to identify stocks with strong breakouts.

Overview
The FOMC announced the start of tapering by month’s end, confirming their belief that the economic recovery is strong. As a result, stocks pushed higher, but interest rates declined.
Small-cap stocks rallied all week strongly, confirming their breakout identified in my post of Oct 15. In addition, all major indexes made new highs.
The impressive earnings season continued, with approximately 80% of companies beating their earnings estimates.
The November employment report came in with 531,000 new non-farm jobs in October, with the leisure and hospitality sector leading the job creation with 164,000 jobs, showing that COVID-19 was loosening its grip.
Signs-of-the-times: Peloton, the ultimate stay-at-home stop dropped -35.35% on weak earnings; Pfizer announced its new pill is 89% effective in preventing hospitalizations in high-risk patients, and competitor Moderna MRNA fell ~-17%; Zoom Video Communications (ZM) is down ~-55% from its peak.
In review: CAR - a chart we highlighted in my post on hotels has had quite a move since then, and I pointed out in my Aug 20 post that COVID-19 may have peaked.

Key Question
Now that the markets are firing on all cylinders, where are there solid breakout stocks? We look through our tables and create a hotlist for your review. (The list is as of yesterday’s close.)
Performance Summary
A strong week in the markets, especially for small-cap stocks, which broke out decisively. Mid-cap stocks and the Dow-30 stocks lagged for the week. The FOMC meeting was the key driver, and the market liked the Federal Reserve’s message. Historically, small-cap stocks do well in this environment, and this week's response seemed to confirm that hypothesis.
The sensitive bull/bear net balance from leveraged and inverse ETFs remains firmly bullish for the third week in a row.

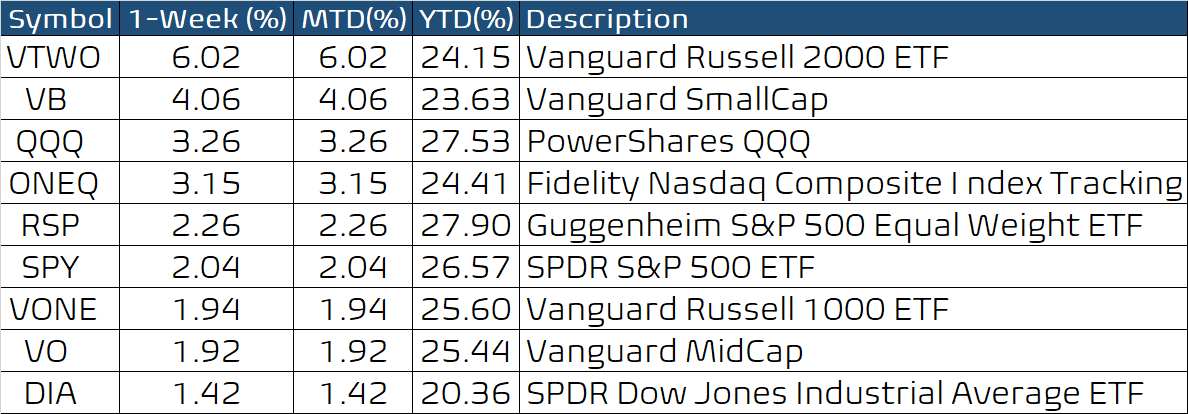
The market is racing higher and exceeding my price projections for year-end. However, it is approaching key Fibonacci extensions and may need a little breather. One of the best charts of the week was for the Vanguard Russell 2000 ETF (VTWO). As you can see below, it broke through long-lasting resistance from early March 2021 to power higher. A broadening of the rally is good news for bulls.

The strong move out of the triangle pattern for the Vanguard Small-Cap ETF could not be more clear. Small stocks tend to do well when the Fed begins to raise rates (or remove accommodation as they signaled this week).

The Hotlist
As I look through my charts and tables, I see big breakouts everywhere. So I decided to do a slight variation: I looked through the StockTable yesterday and ranked the stocks by the sum of COST1+COLT1+COLT3 and isolated those with a composite score of 300 (which is the maximum possible for strong uptrends). The table is shown below.

First, I compared the 1-week and 1-month performance of these stocks versus the performance of the SPY ETF (as a substitute for the S&P-500 index). The chart below shows that my methodology has isolated stocks with powerful performance since they returned more than the SPY.

Naturally, the stocks could underperform in the future, so I looked at a few of their charts. The top stock was MaxLinear (MXL), and its chart shows a clear breakout with the sum of three chosen indicators at 300.

Look at the chart of Donnelly Financial below. It looks quite similar to the MXL chart above.

Even “boring” Costco, has a chart that looks quite similar to the breakout in the two charts above.

“Old-line” transportation companies like Old Dominion Freight Lines (ODFL) also have dynamic charts.

I could go on, but I will finish with the chart of KKR, which I highlighted last week (it continued to trend higher this week).

The summary is that when there are broad breakouts in the market, my strategy encapsulated in the stock table does a good job of finding stocks undergoing strong moves. The charts above are essentially interchangeable, and you could easily mistake one for another. In other words, the computer can find them for you, as we have in our Stock Finder table. Remember, the table is dynamic and changes each day in response to market action, which means the hotlist changes each day.
MetaStock Event: Thursday, November 18, 10:00 EST
MetaStock is putting on a week-long event (Nov 15-19), and they have kindly asked me to present some ideas using my new MetaStock package. Registration is free, so please stop by if you have some time. The line-up of speakers offers an astonishing range of trading ideas, so do take a look.
Wrap-up
If you like to do your own research, my posts should give you a good starting point, with context and suggestions. Then, you can visit my website, chandeindicators.com, for more information and ideas. I hope you will stay tuned and help by subscribing and recommending it to your friends and colleagues.
Thank you for spending some time with me.
Disclaimer
And now for some housekeeping. This publication is for “edutainment,” education, information, and entertainment purposes only. It is not to be construed as investment advice. Past performance is not necessarily indicative of future results. Our disclaimer at chandeindicators.com is included herein by reference.