


Rebound + Seasonality = $SPX 4800?
We use seasonality and technical analysis to project price targets.

Overview
Markets rebounded rapidly to new highs. The S&P-500 index rocketed to new highs off the early October lows in just thirteen days.
The price action of inverse ETFs suggests this is the launch of the traditional year-end rally.
The rally in Bitcoin and Tesla confirmed that animal spirits have returned to the markets.
Energy markets continue to rally, as we have tracked in our sector rotation charts for the past few weeks.
Key Question:
The S&P-500 index just soared to new highs. So, the animal spirits are back. But, will the bullish enthusiasm continue? How high could the S&P-500 reach by year-end? Of course, no one knows for sure, but we turn to market data since 2004 to look at year-end seasonality (over the last 14 trading weeks of the year).
Performance Summary
A good week in the market that saw new highs and a broadening of market breadth: mid-cap stocks won the week (see VO below), and the Equal Weight RSP ETF was stronger than the weighted S&P-500 index (SPY).
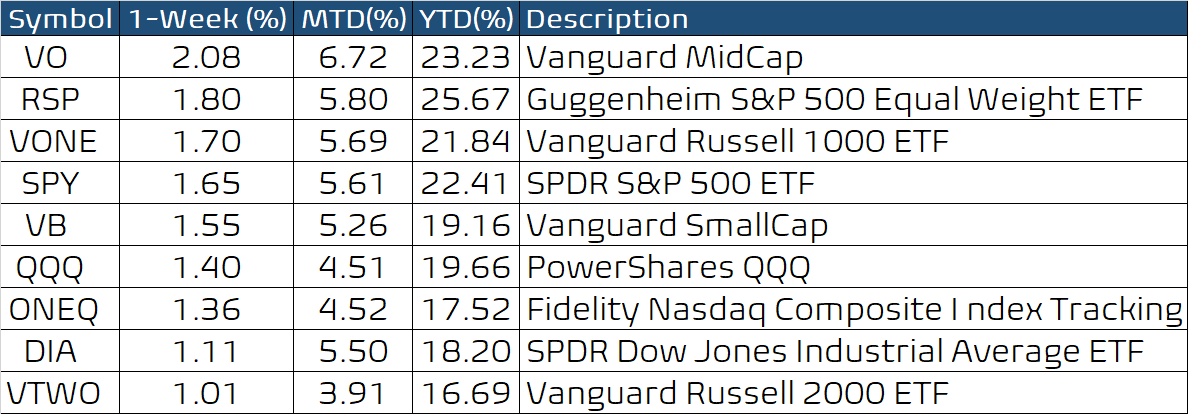
The sensitive bull/bear balance calculated using leveraged and inverse ETFs ended the week above +60 in another sign of market strength for the second week in a row. As discussed below, much uncertainty remains, but this indicator should stay mostly in the green region, at least through Thanksgiving.

The unweighted S&P-500 ETF (RSP) has broken above its September highs, and its long-term and short-term oscillators (in the lower panel) are both strong. Hence, declines should be short-lived and find support at the trailing bands.

Interest rates have been moving higher, and the big banks have checked in with strong earnings. This has propelled the financials higher (see XLF ETF below). The sustained breakout above prior resistance implies this ETF can move higher.

The rally in Tesla pushed the Consumer Select Discretionary SPDR (XLY) to new highs with a clear breakout above its three-month resistance. This is a good sign in the face of supply-chain snafus, which seems to be the favored to win the blame game at the moment.

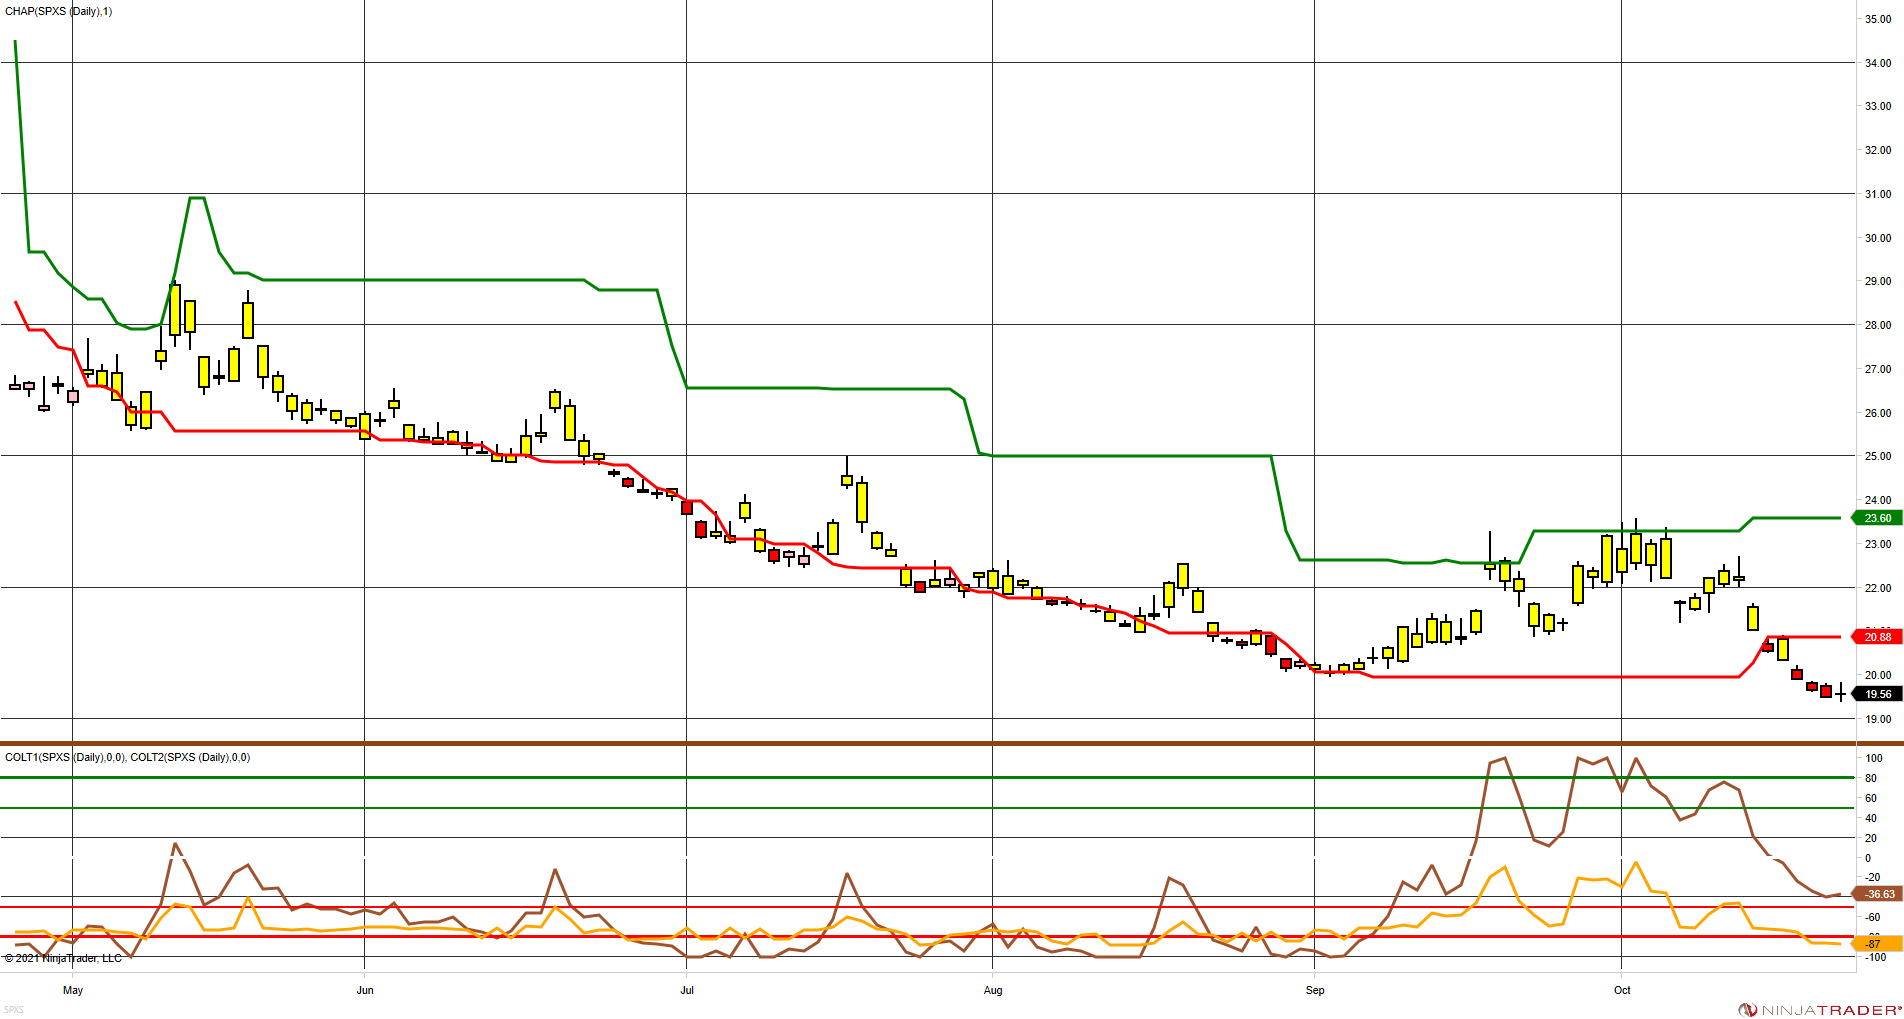
The decisive breakdown in SPXS (Direxion Daily S&P500 Bear 3x Shares ETF) could be another sign that bulls are gaining control. The long-term oscillators in the lower panel are approaching levels indicative of a bullish move in the market.
Year-End Price Targets
Seasonally we are in a bullish period in the market. Certainly, the rebound from the October lows has been dynamic. Looking ahead, uncertainties remain, such as the new debt limit deadline in early December, the much-maligned supply chain snafus, and the course of COVID-19, which has gained strength in the UK, often a precursor to what happens here. If the past is prologue, I looked at market returns over the last 14 weeks of the year since 2004 to get a sense of what the weekly equity curve might look like. Since many traders use Fibonacci projections, I also used them to calculate some price projections. Interestingly, the two converge, so maybe I am on to something.
I arbitrarily used weekly returns since 2004 for the last 14-weeks (3 months) of each year for the S&P-500 index to observe the year-end seasonality. On average, the pattern has been a drop in October, an uptrend in November into early December, then two weeks of tax-loss selling, before a Santa Claus rally into year-end.

Since we had a melt-down in 2008 that was unusual, I calculated equity curves with and without the 4th quarter of 2008. The average gain for the last 14-weeks in my data was approximately +2.9%, including 2008, but without the 2008 debacle, the market gained approximately +4.5%. You will not be surprised to see that the standard deviation of weekly returns was 9.5% with 2008 data and 6.95% without it. As a result, my two SPX year-end seasonality-based forecasts were 4584 (including 2008) or 4656 (without 2008). If I add half the standard deviation to the average return without 2008 data, my year-end forecast jumps to +8% or approximately 4811.
For the Fibonacci projections, I used two different time frames. First, I used the entire September-October drop (a range of ~267) and the September high (4545.85) for the base. Second, I used the first bounce off the Oct 04 low to the Oct 07 high to measure extensions. I have tabulated my results below. In round numbers, I get a cluster of projections between 4650-4700 and another cluster around 4800. The clustering of projections is viewed as a confirmation of that particular price range.

So, my “base-case” year-end forecast is 4650, and my “optimistic” forecast is 4800, a 3.2% range.

MetaStock Event: Thursday, November 18, 10:00 EST
MetaStock is putting on a week-long event (Nov 15-19), and they have kindly asked me to present some ideas using my new MetaStock package. Registration is free (https://www.metastock.com/Events/), so please stop by if you have some time. The line-up of speakers offers an astonishing range of trading ideas, so do take a look.
Wrap-up
If you like to do your own research, my posts should give you a good starting point, with context and suggestions. Then, you can visit my website, chandeindicators.com, for more information and ideas. I hope you will stay tuned and help by subscribing and recommending it to your friends and colleagues.
Thank you for spending some time with me.
Disclaimer
And now for some housekeeping. This publication is for “edutainment,” education, information, and entertainment purposes only. It is not to be construed as investment advice. Past performance is not necessarily indicative of future results. Our disclaimer at chandeindicators.com is included herein by reference.