


Market Confirms Key Low
Review of markets, as of Friday 10/15/2021.

Overview
The markets backed and filled for three days as we expected last week and then broke higher. (We wrote: Looking ahead, the market may need to back and fill a bit before heading higher, especially as we get into the earnings season.)
The break higher confirmed the key low we identified Friday, September 24. (We wrote: We may have set a key low on Monday, with a roughly -5.28% drop from the 4545 high to the 4306 low for this move. )
Small-cap stocks broker out of their triangular consolidation, further supporting the bullish case. (On 10/01/21, we wrote about the VTWO ETF: So if it breaks out to the upside, that will help the markets move higher.)
The earnings season started well, and we should expect the market edge higher, albeit with some bumps along the way.
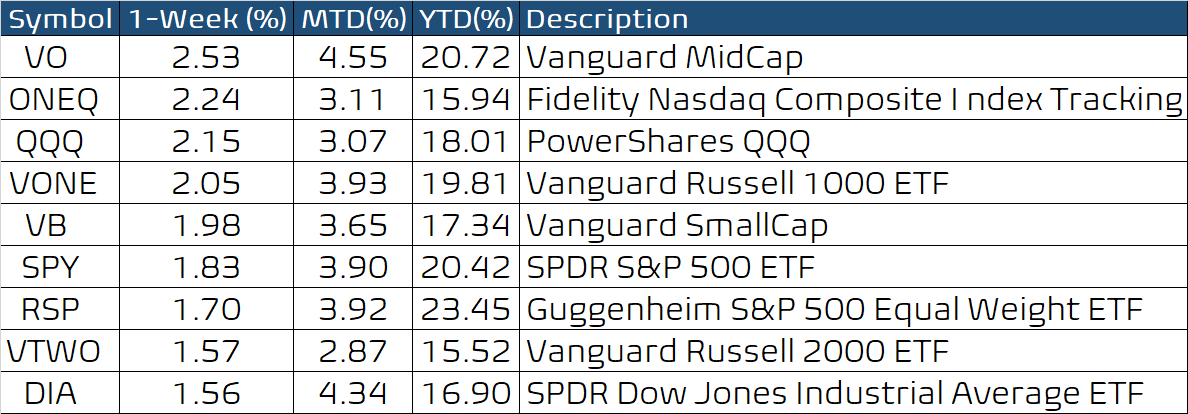
Performance Summary
The market edged lower for the first three days, although without much conviction, as it awaited earnings. It then rallied hard on Thursday and followed through on Friday. The MidCap, Nasdaq, and small-cap stock did well this week.
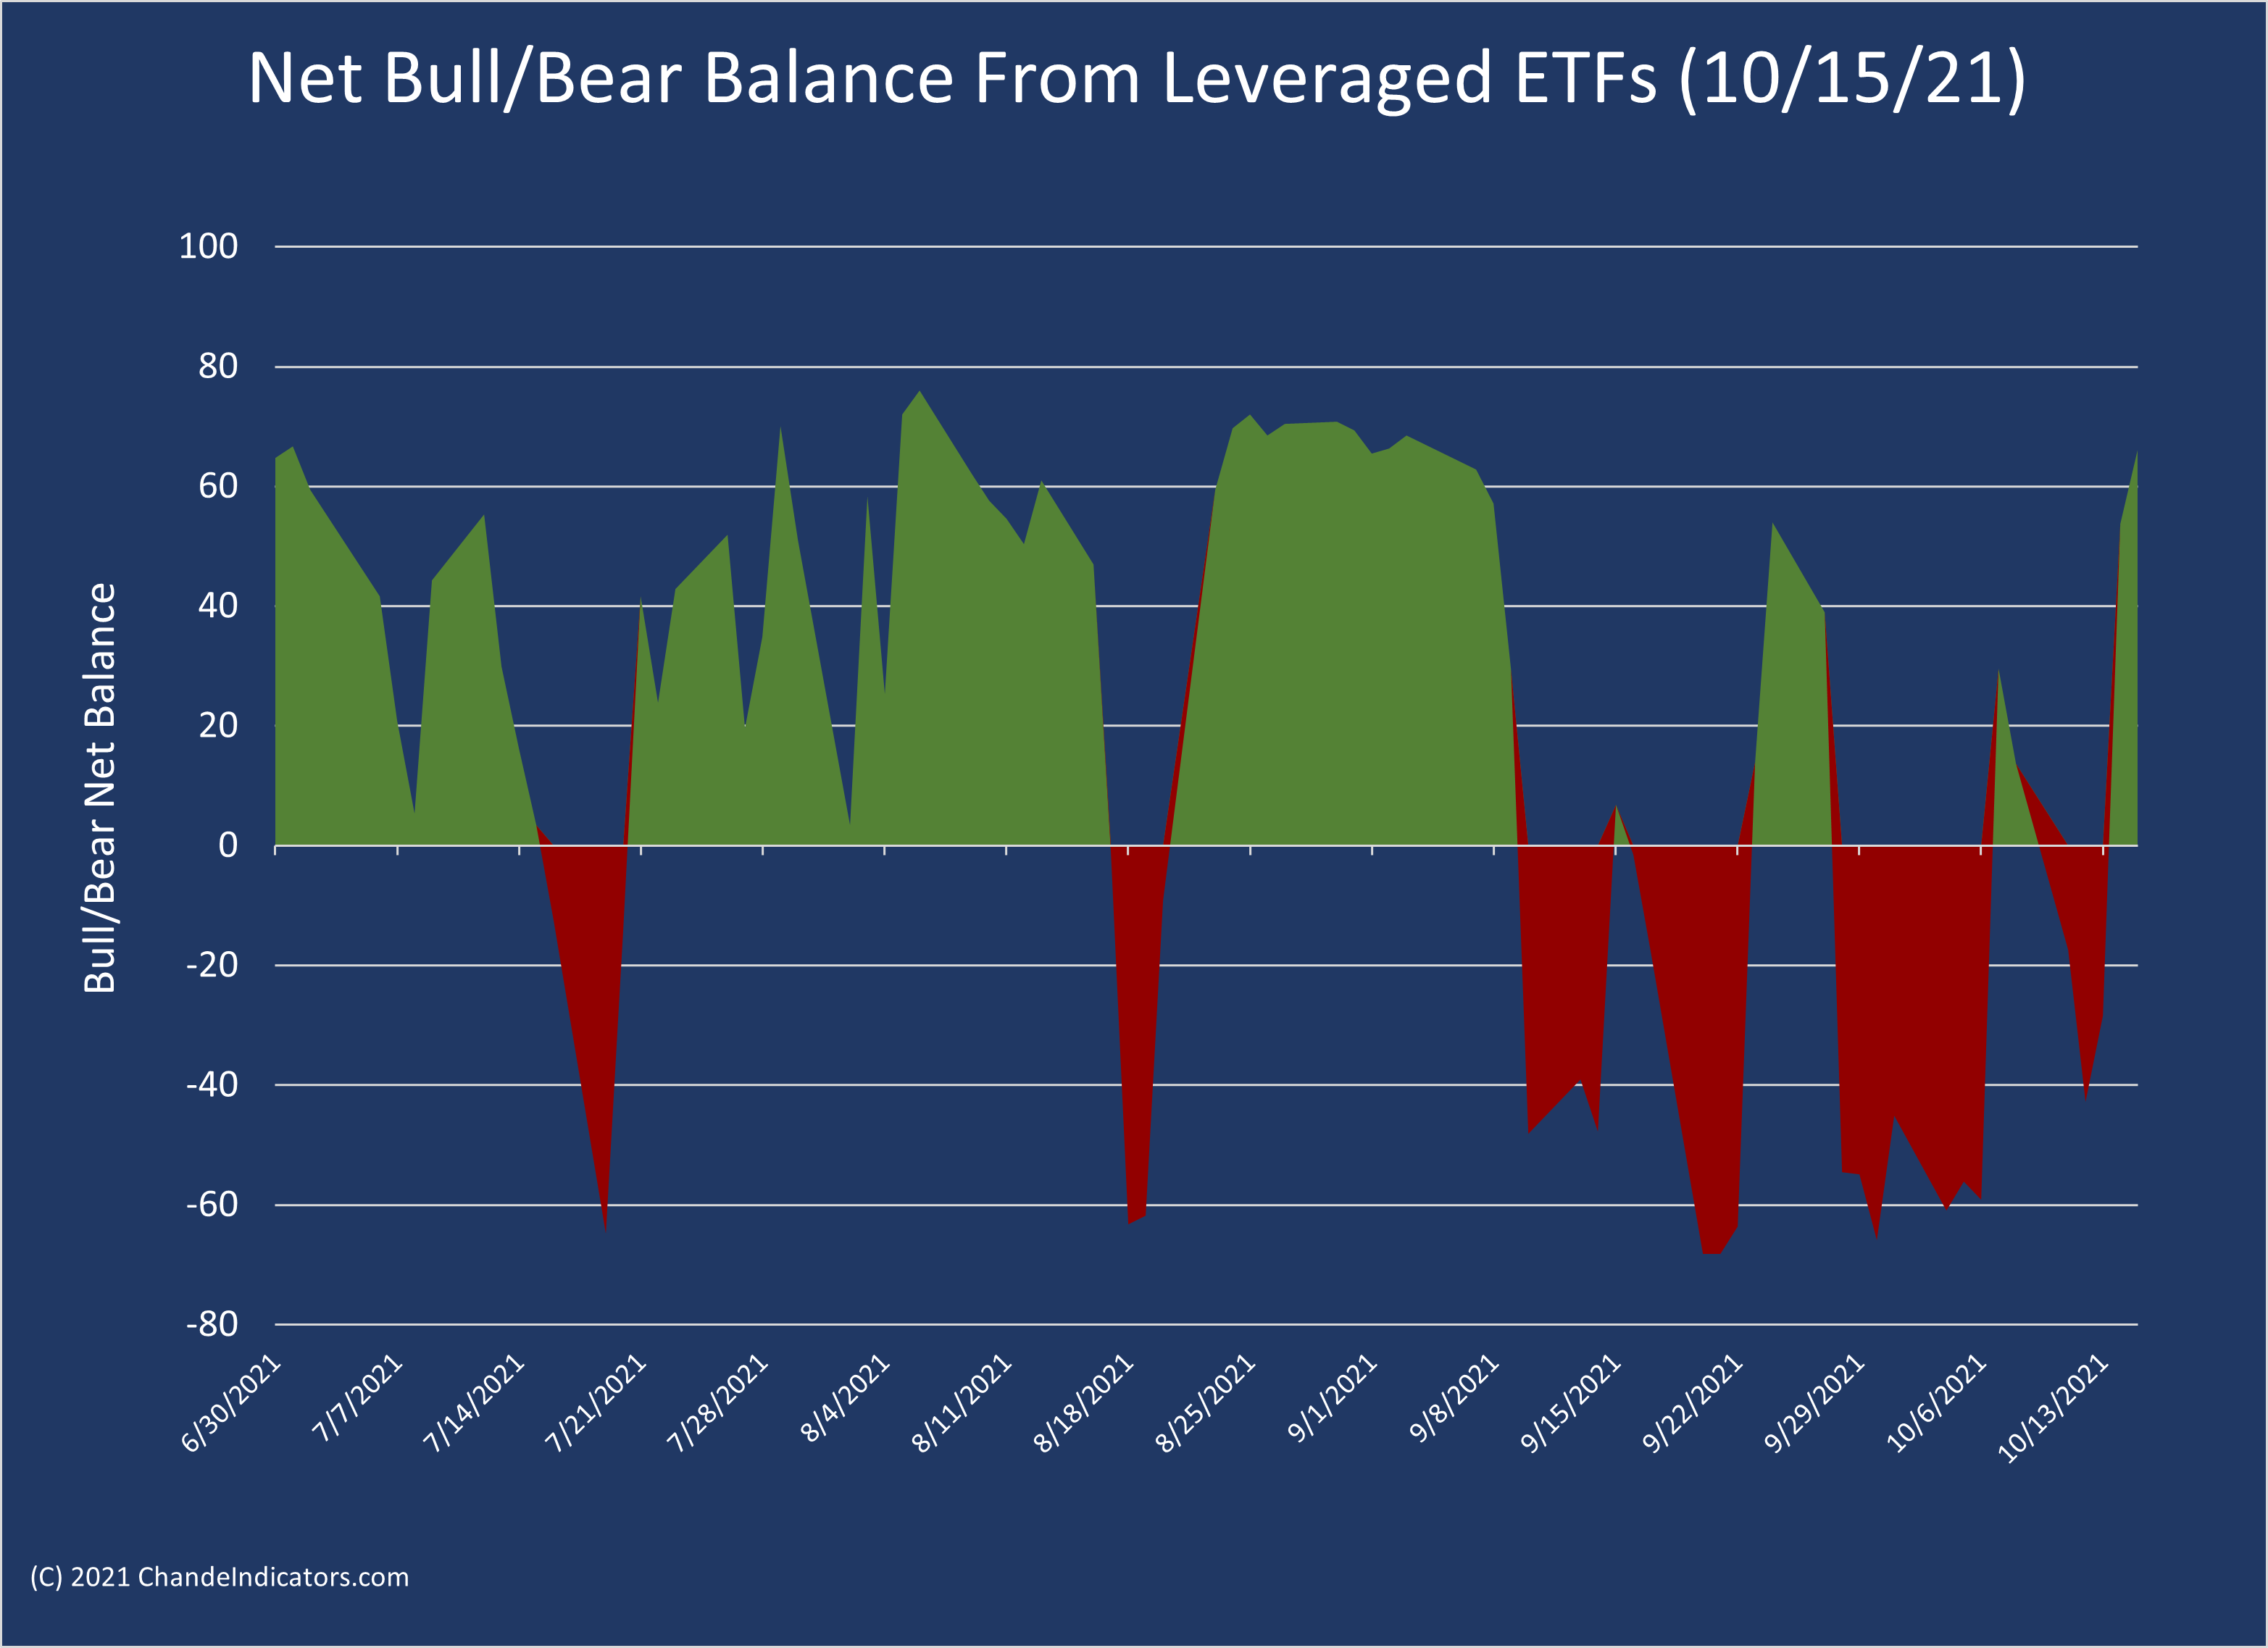
Our sensitive net bull/bear balance based on the price action of leveraged and inverse ETFs ended the week strong, with a reading above +60. Trading has been choppy, with a downward bias, as we can see below, with the red regions being dominant.
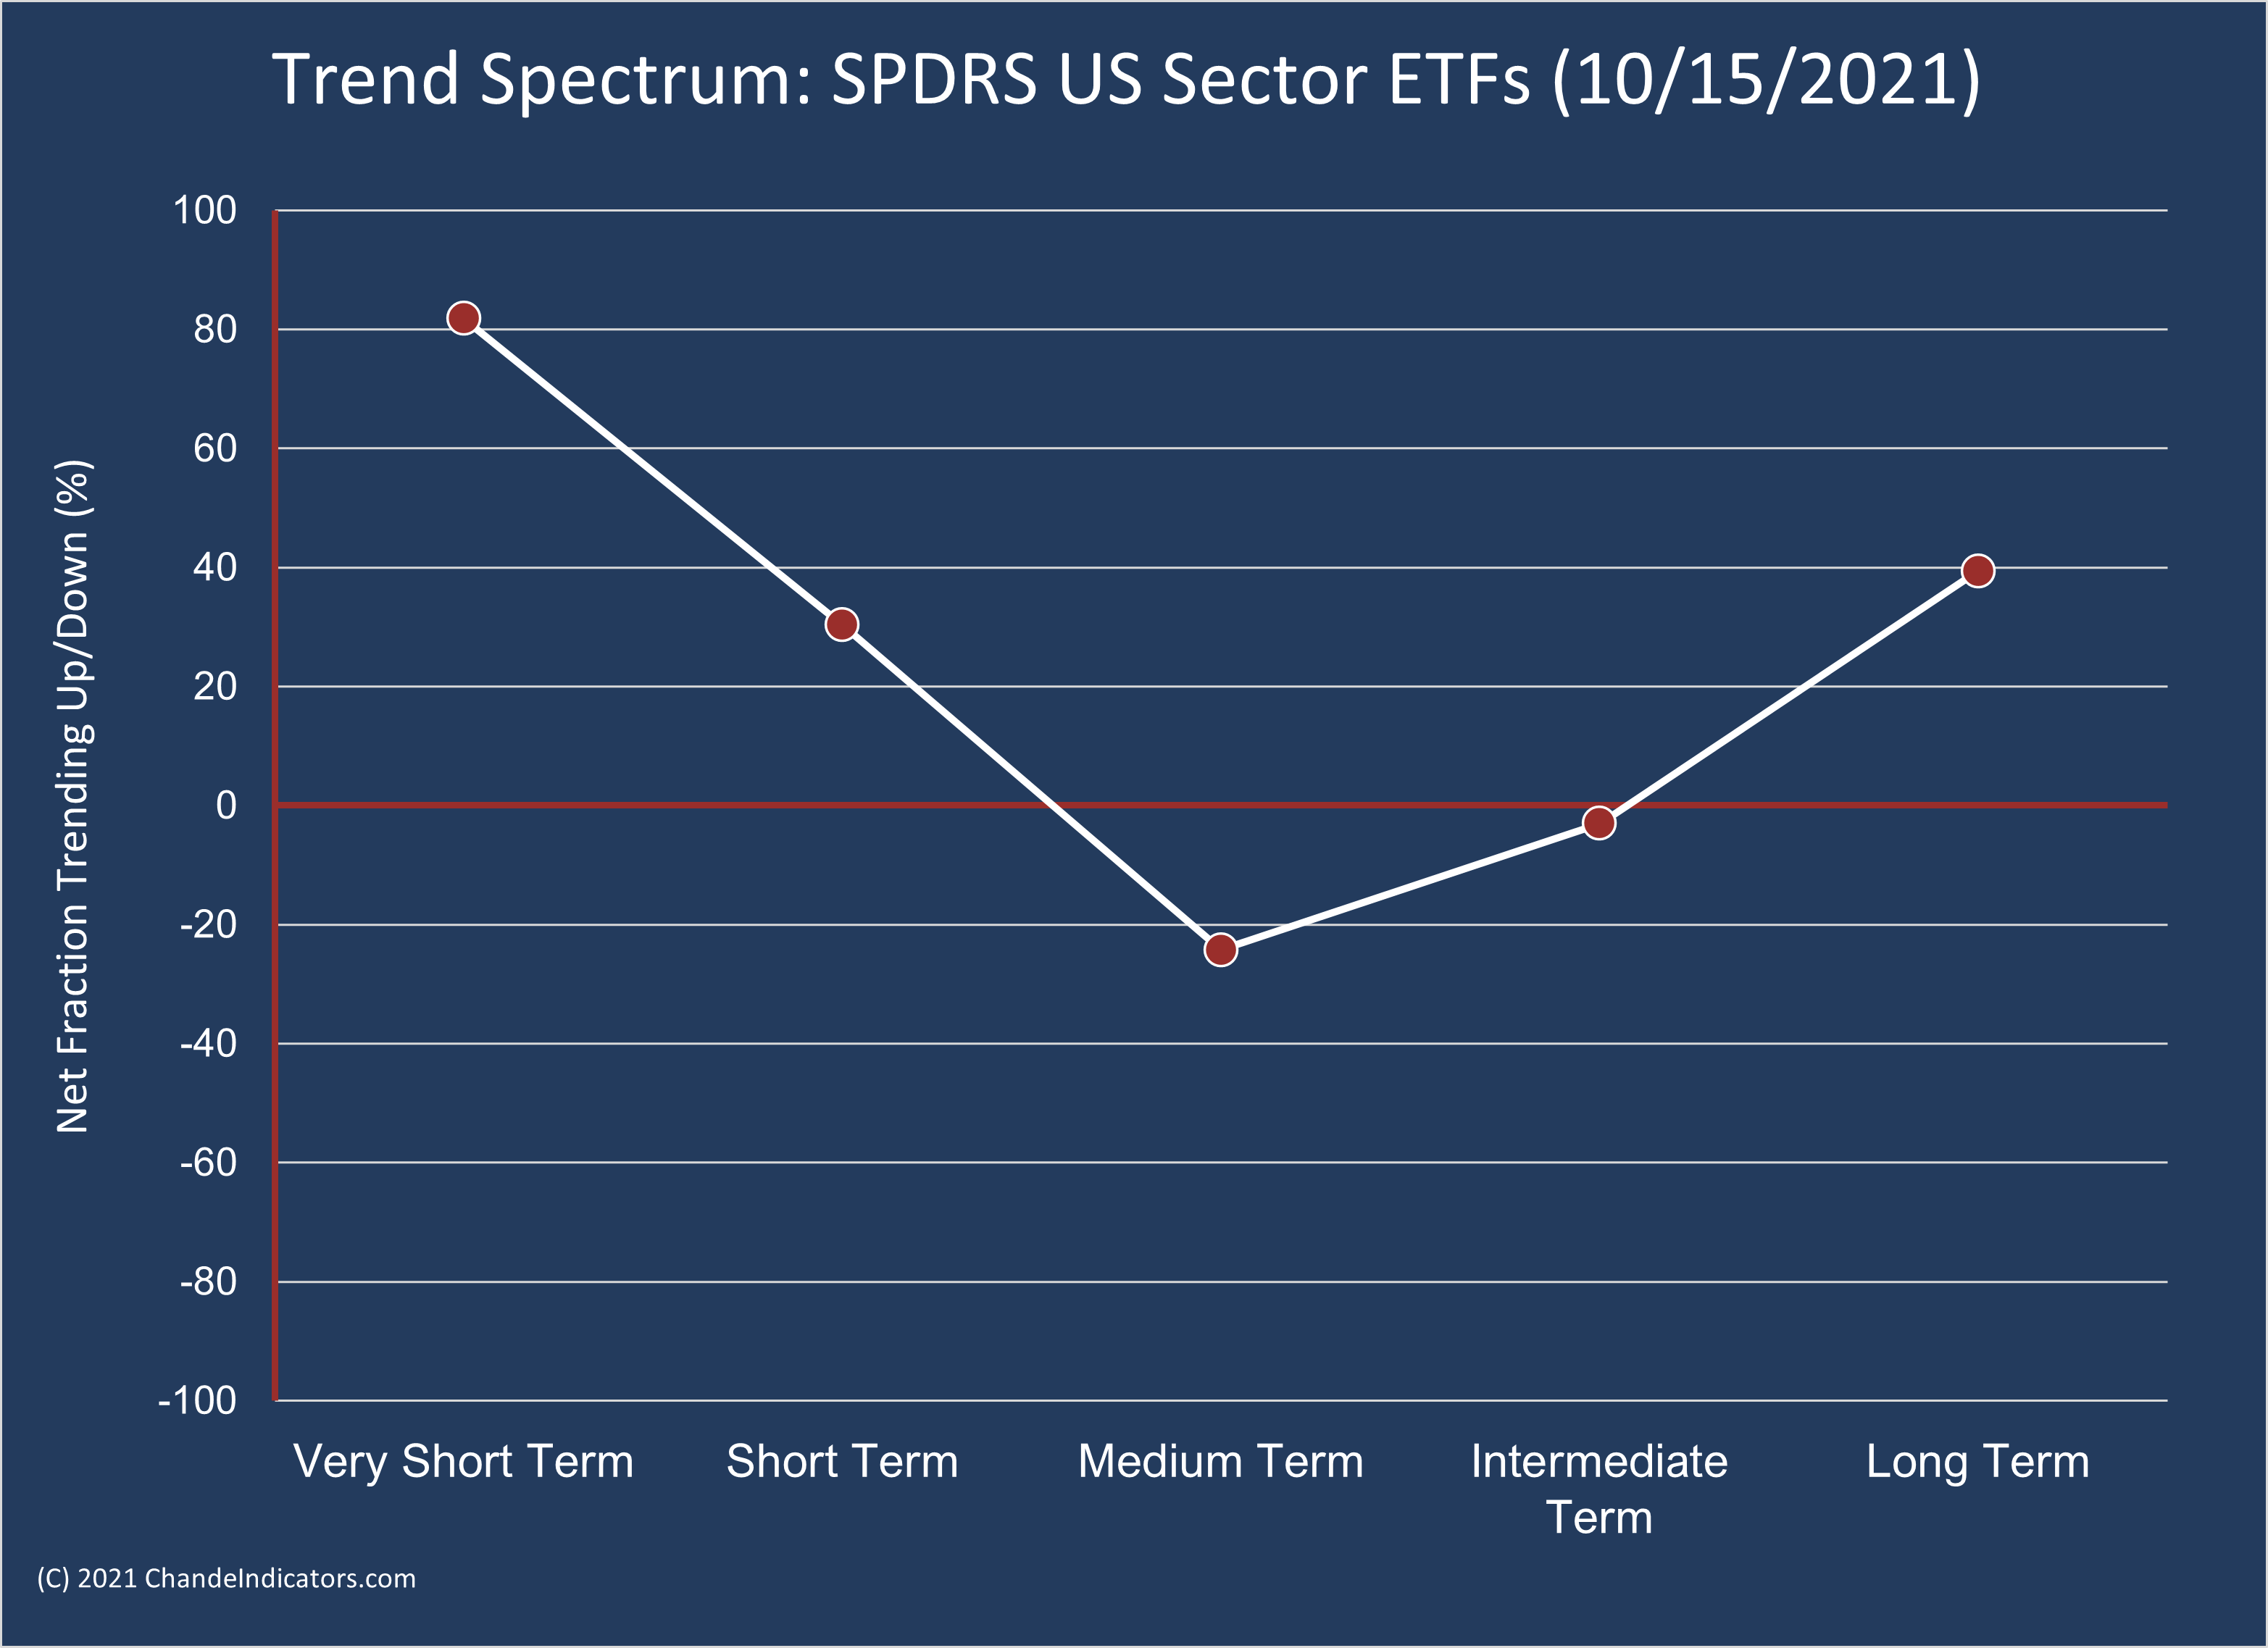
The trend spectrum or breadth turned sharply higher in the very short-term, lifting the “smile” from last week. However, the longer-term trend has weakened, and more buying is needed to turn trends bullish across the board.
The buying has been broad across the various market capitalization groups and value, blend, and growth style portfolios, as the chart of Vanguard ETFs shows below. Value ETFs have led the rebound, but the small-cap group of ETFs (VIxx) has lagged slightly.

The picture is the same at the sector level. In the last few weeks, all the ETFs were in the lower left quadrant (except the energy complex). Now they are near the top of the y-axis, i.e., exhibit a strong short-term bounce. The energy-related ETFs are still ahead, as you see using the key below.


The SPY ETF shows how the market backed and filled as we suggested last week. The rally over the past two days started from the red lower band, as it often does. A close above 445 is bullish, but resistance is getting closer. The rally above 441 confirms the key low set the week of September 24.

We have said that a breakout from the triangular consolidation for small-cap stocks would be bullish for the entire market. That breakout arrived this week, as shown by the Vanguard VTWO and VB ETFs below.


Strongest Stocks
The strongest stocks in our database are shown below for quick reference. You can sort by the “Sum4” column (in descending order) to explore more results using our Stock Finder.
Wrap-up
If you like to do your own research, my posts should give you a good starting point, with context and suggestions. Then, you can visit my website, chandeindicators.com, for more information and ideas. I hope you will stay tuned and help by subscribing and recommending it to your friends and colleagues.
Thank you for spending some time with me.
Disclaimer
And now for some housekeeping. This publication is for “edutainment,” education, information, and entertainment purposes only. It is not to be construed as investment advice. Past performance is not necessarily indicative of future results. Our disclaimer at chandeindicators.com is included herein by reference.