
Chasing Adobe (ADBE): A Tutorial on Accelerating Exits
A tutorial on CHASE - the Chande Accelerating Stop Exit.

I will deviate from my usual format to continue our exploration of entry and exit strategies. (For reference, this post on trailing Tesla discusses other trailing stops, and we discuss entries in how to scan for breakouts. I will send the market analysis in a separate post.)
Adobe (ADBE) and its products touch our lives every day. The stock had been consolidating for months but then rose to new highs started to rally. However, there was no way to guess exactly how the prices would evolve. So how would you have traded it in real-time? In retrospect, it was the perfect application of my CHASE accelerating exit (CHASE - Chande Accelerating Stop Exit), as we will discuss below.

Chasing Adobe (ADBE)
Our lives are touched by Adobe probably every day through their ubiquitous PDF format and tools for graphics. The stock had been consolidating for about nine months in an approximately 120-point range. I will use weekly data for this discussion because it is easier to observe the consolidation range and subsequent analysis. It then had a rapid rally of 137 points, a bit more than the 120-point range, followed by an equally rapid decline of 122 points. This is precisely that kind of move that I love as a breakout-style trader. Naturally, we did not know exactly what Adobe stock would do, but that is precisely why my unique tools add value.

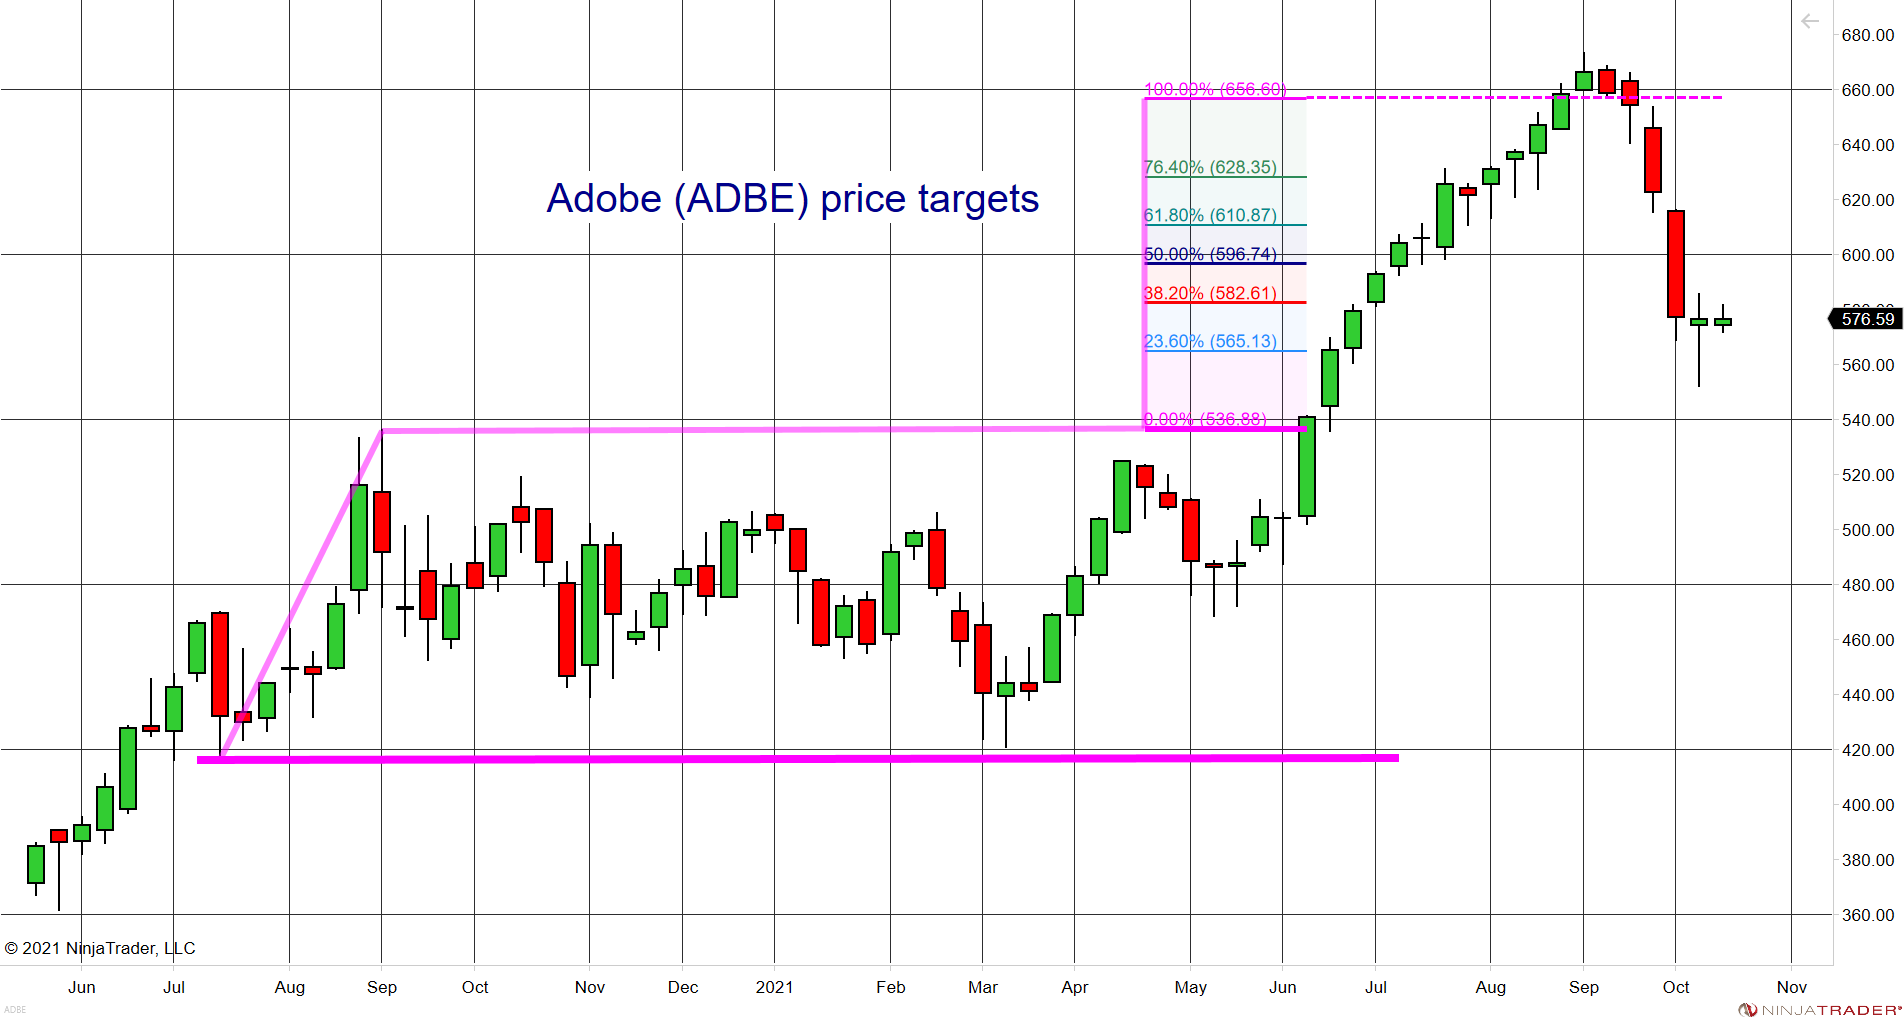
First, we project a price target. Since this was a rally from a long consolidation, the width of the consolidation is often used as an estimate for the range of the breakout rally. The projections follow the usual Fibonacci ratio relationships, as we show below. Hence, right away, you could project a price target for the move.
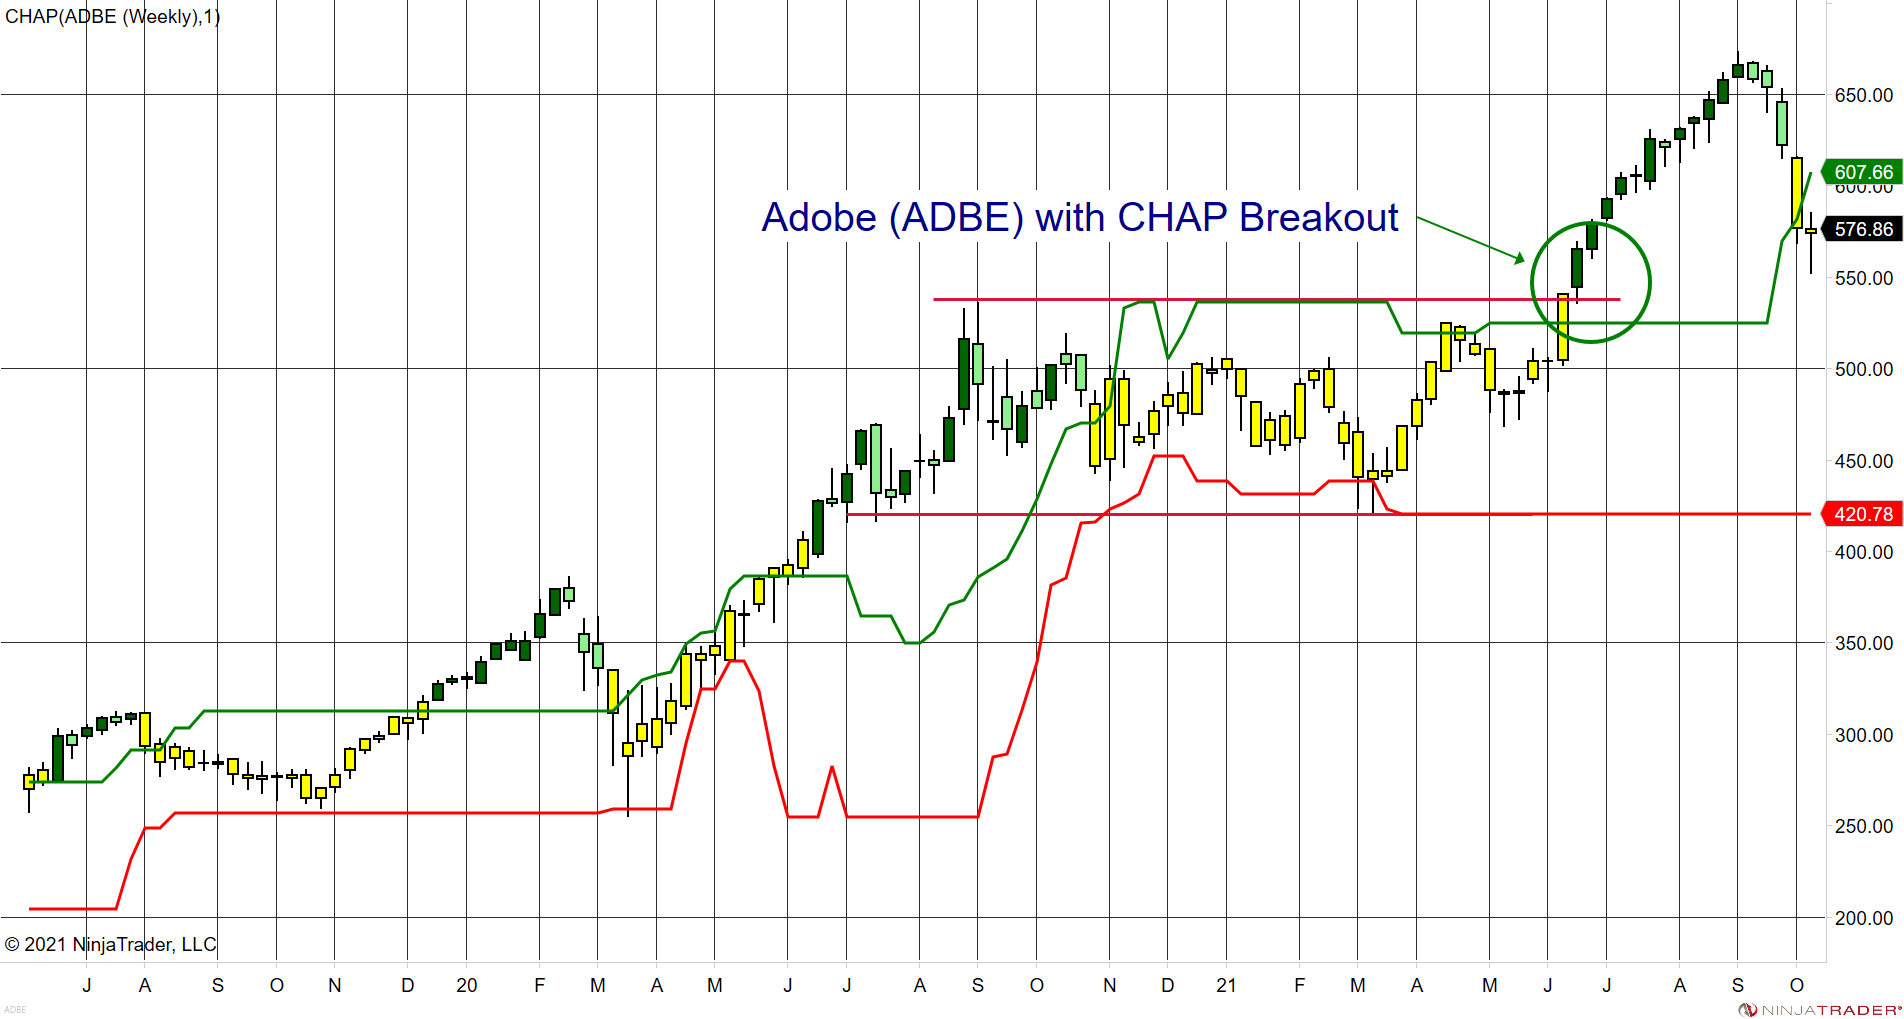
Imagine that you had not actually performed the analysis as I have laid it out with the benefit of hindsight but were merely looking to confirm the breakout. My CHAP (Chande Adaptive Price Channel) does a good job of finding and identifying the breakout. First, observe that when the prices were consolidating, the price bars were colored yellow. As soon as there was a clear breakout, the color of the bars changed to dark green. Looking to the left of the chart, you can observe the color changes from yellow to dark green for the previous breakouts. So the CHAP tool correctly recognized the breakout in a timely fashion.
Imagine you are in the middle of June, you believe the break-out, and you have purchased the stock, so you are long. Further, you have a price target, but you still cannot determine how far this move will travel. This is where the exit strategy comes in. Ideally, you want your exit strategy to capture as much of the move as possible, but without knowing beforehand the ultimate amplitude of the move. This is precisely what trailing stops are designed for.
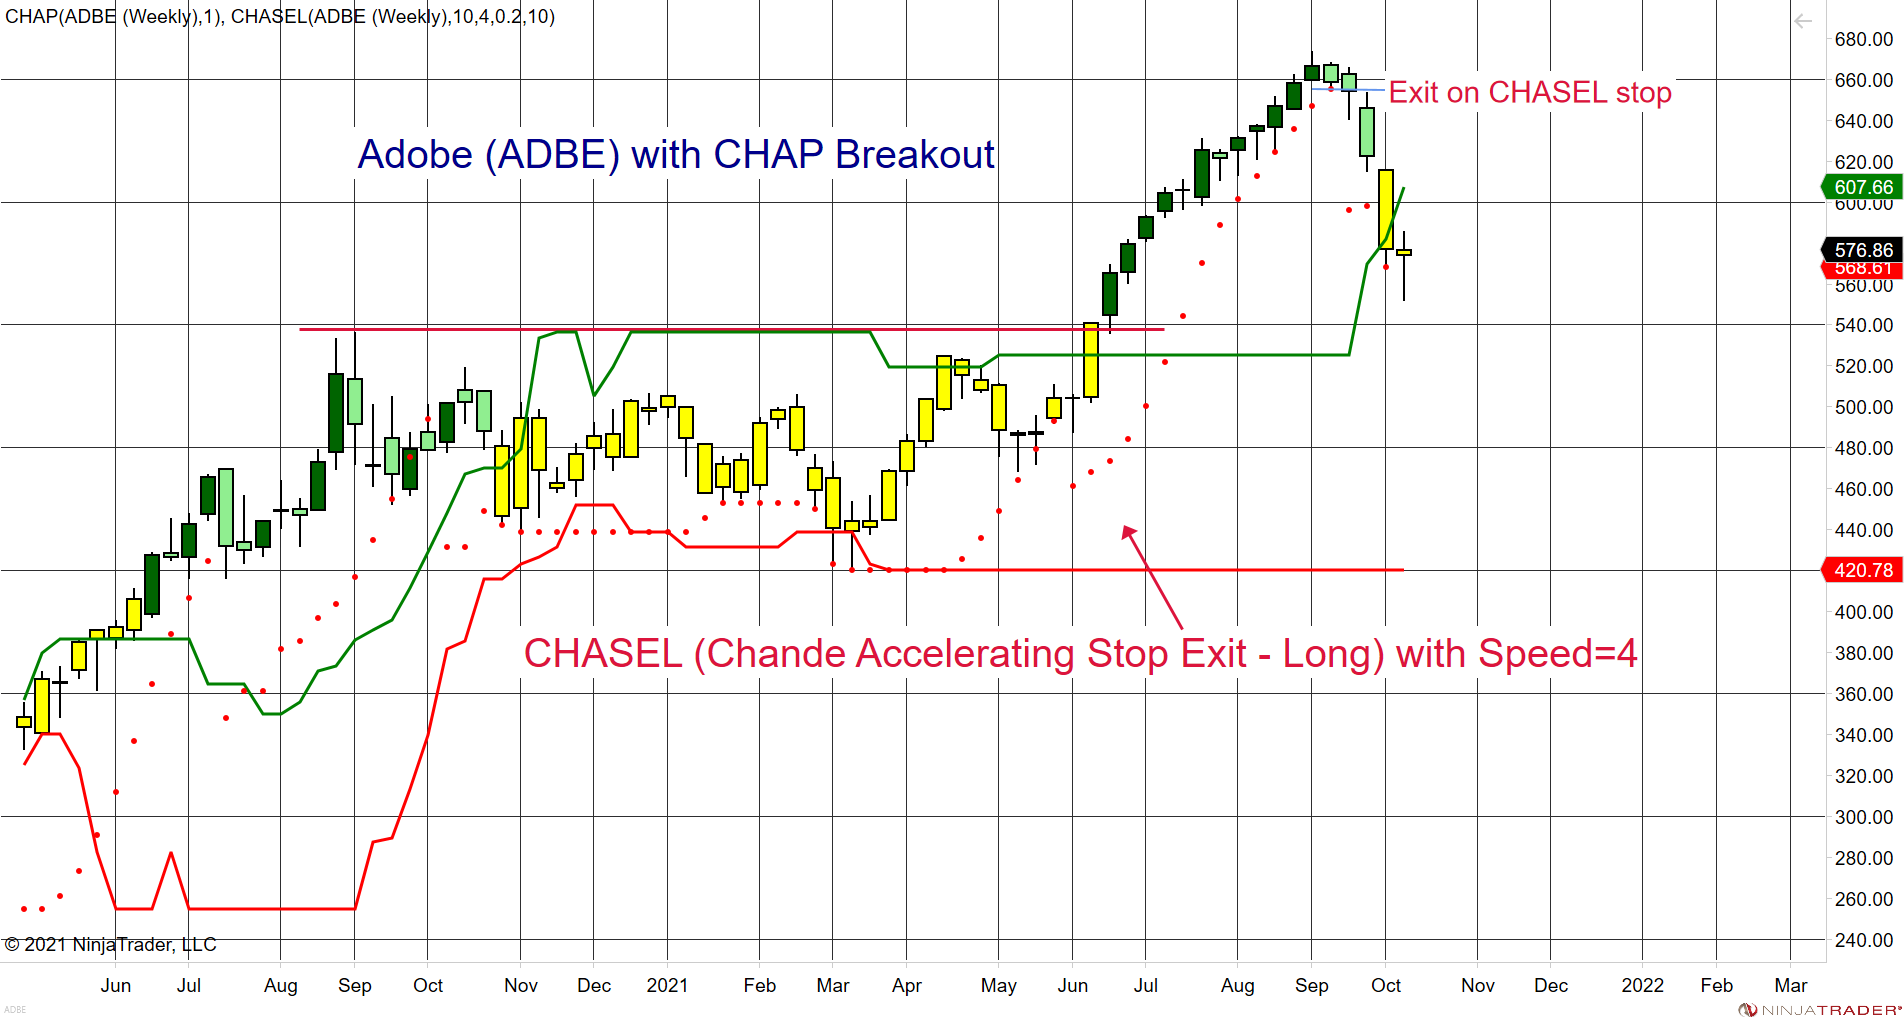
The chart below shows an exit strategy identified by red dots overlaid with the CHAP breakout tool on the previous chart. The red dots start at the bottom of the trading range (~421). They are a full channel width away when prices first poke above the green upper band of the price channel. Then, the stop begins to accelerate, moving closer and closer to the prices as they break out. The data are plotted with a 1-bar delay, so the stop is the value you would enter for the next bar (i.e., you calculated after the close this Friday for next week’s trading). This stop produced an exit close to the top, using just the default values for the calculation. It did not get out at the absolute top of the move, but it followed the trend closely to produce an attractive exit. The exit was at 641.19, so assuming you entered on the open of the first green bar of the breakout (@545), you could potentially lockdown about 96 points out of a possible ~129 points (673.88-545.04) or about 74% of the move for a potential return of about 17.6%. Not bad for just following a “system” that takes all the guesswork out of the trade.

The CHASEL exit comes in many different speeds, and you would have different results if you chose a faster or slower version of the exit. What is important here is to visualize an exit strategy, a trailing stop that adapts to what the stock is doing, without you having to guess (or second guess) what the stock was going to do. Setting a trailing stop is always a chancy affair since if it is too tight, you will get out “too soon,” and if it is too loose, you will get out “too late.” So the speed of a trailing stop is a matter of your trading persona. The CHASE exit allows you to customize a range of “speeds and feeds” to deal with all the unknowns and unknowables about trading. For example, here is what a relatively slow-speed setting would have done for this Adobe trade.

Here is the CHASEL with a faster setting to produce and an even earlier exit.
The Adobe Trade using Daily Data
Some of you might be wondering how my analysis would be different on daily data (since I have used weekly data in the charts so far). The tools are applied the same way and produce similar entries but different exits, as we should expect, since the computation of the indicators changes as the underlying data changes. For example, the entry analysis is essentially unchanged: the breakout appears at the long-term high, but the entry point shifts since you can enter the trade earlier. Here I have also shown the COLT1 and COLT2 long-term trend-strength oscillators used to confirm the breakout.

I applied the CHASE exit on daily data but chose the slowest speed (Speed=1) since the exit moves much faster on daily data (versus weekly data). So it would have exited in mid-August off the first entry. Then you would have had to decide if you wanted to enter the trade again as prices continued higher. The second exit would have been closer to the exit using weekly data.

As we know, there are many exit strategies. For completeness, I show below the ADBE trade using a long-term exit strategy from my Complete Toolbox for Metastock. The MetaStock exit does not accelerate continuously but moves only when the stock makes a new high or its volatility increases. By design, this is a relatively slow exit strategy that is oriented towards capturing long-term trends. As we saw initially, this was a quick up and down move in Adobe, so the exit seems a bit slower than the CHASE exit.

Finally, I don’t want to leave you with the impression that I have cherry-picked the Adobe example using weekly data and that the exit would never work well on any other stock. As a counter-example, I show the Tesla (TSLA) weekly chart using the CHASE exit set at its default speed. Even a cursory examination shows that the CHASE Long exit with default values would have generated decent exits when trading the surge in Tesla.

Adobe Summary
The Adobe chart is a good example of the need for an exit strategy for your trades. Naturally, as we have discussed before (in the case of multi-decade investing), there are instances when you may not want a trailing stop. Or, you may need a slow exit strategy for long-term trades (as in my post on Replicating Repligen). The CHASE exits have many different speed settings, so you can find one that fits your needs.
Wrap-up
If you like to do your own research, my posts should give you a good starting point, with context and suggestions. Then, you can visit my website, chandeindicators.com, for more information and ideas. I hope you will stay tuned and help by subscribing and recommending it to your friends and colleagues.
Thank you for spending some time with me.
Disclaimer
And now for some housekeeping. This publication is for “edutainment,” education, information, and entertainment purposes only. It is not to be construed as investment advice. Past performance is not necessarily indicative of future results. Our disclaimer at chandeindicators.com is included herein by reference.