


Replicating Repligen (RGEN)
A tutorial on how to find and trade stocks with strong trends.

Overview
The rebound in volatility I predicted last week appeared on schedule, and markets sold-off again.
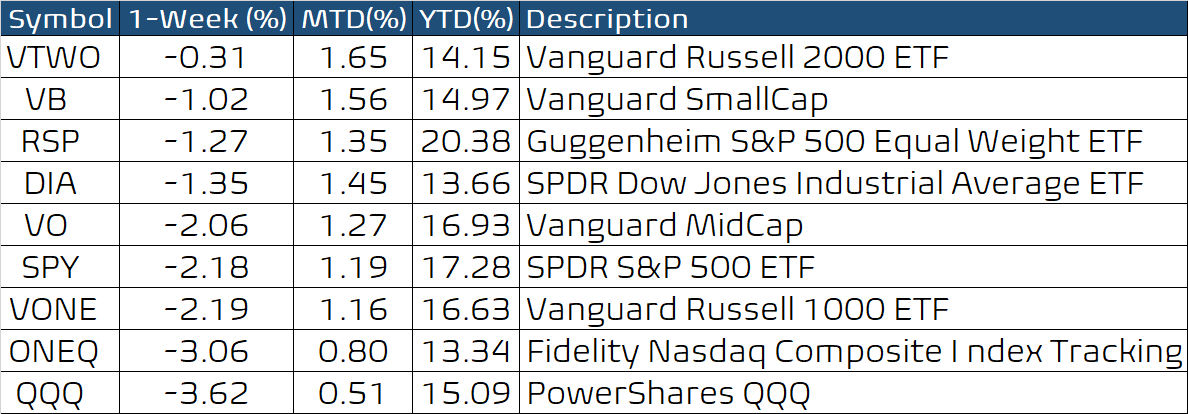
Technology stocks were the weakest, and small-cap stocks held up the best.
There was a little rotation towards value (from growth).
The drama on Capitol Hill riveted the markets, but a bill to keep the government open passed easily, offering some relief.
A retest of last week’s lows also occurred as expected, and the bounce on Friday was perhaps in response to the bill avoiding a shutdown and/or a small decline in the US 10-year yield.
Headline risk continues to dominate trading, but until Congress finishes raising the debt limit, expect more backing and filling in the weeks ahead.
Key Question
Repligen (RGEN) is a biosciences company whose stock had been consolidating under previous highs and moving sideways in the first half of 2021. But, then, RGEN reported strong earnings in late July, and its stock has enjoyed a remarkable rally (see chart below). Clearly, we would love to replicate the Repligen trade consistently. So how can we identify and trade more Repligens in the future? I will explain how you could do just that using my many trading tools.

Performance Summary
A weak open and a relatively strong close to the week showed that small stocks had hung in there despite the heavy selling in technology stocks. The market sentiment is still negative, with Congress the focus of attention. In addition, the US GDP forecasts were revised lower, supply chain issues continue to rattle retailers, COVID-19 cases continue to decline, and Merck reported positive results for a COVID pill. Nevertheless, the strength in small-cap stocks suggests the market should find its footing soon.
The sensitive bull/bear balance from leveraged and inverse ETFs was decidedly bearish, but trading has been very choppy within a moderate downtrend.

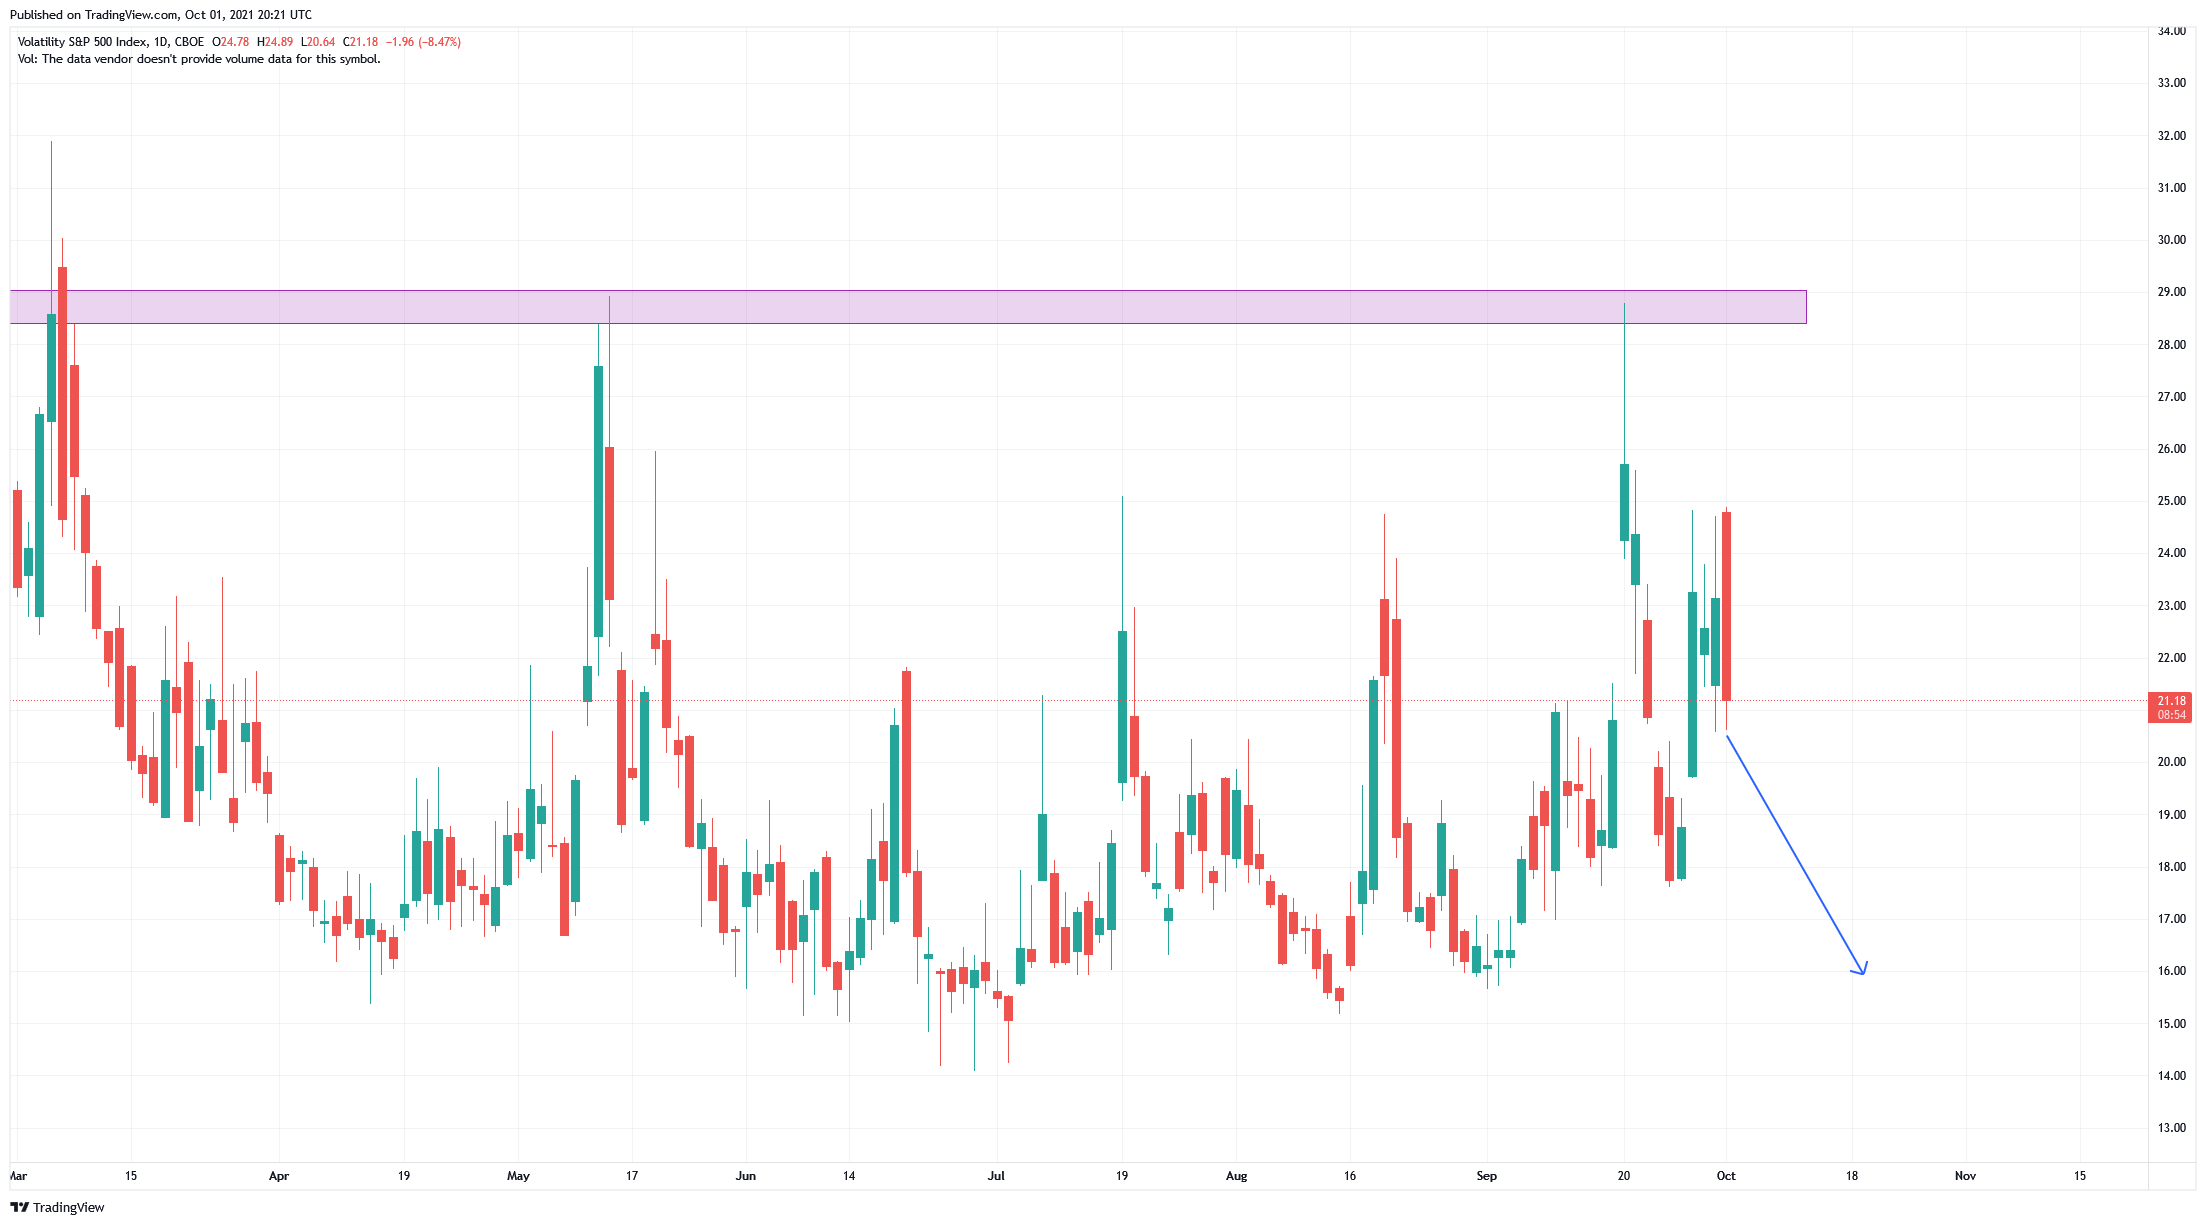
As expected from my commentary last week, the VIX index rebounded but without reaching the prior week’s highs. The drop on Friday was insufficient to change the very short-term trend, so we will say that the VIX remains elevated, so expect some more choppy trading.
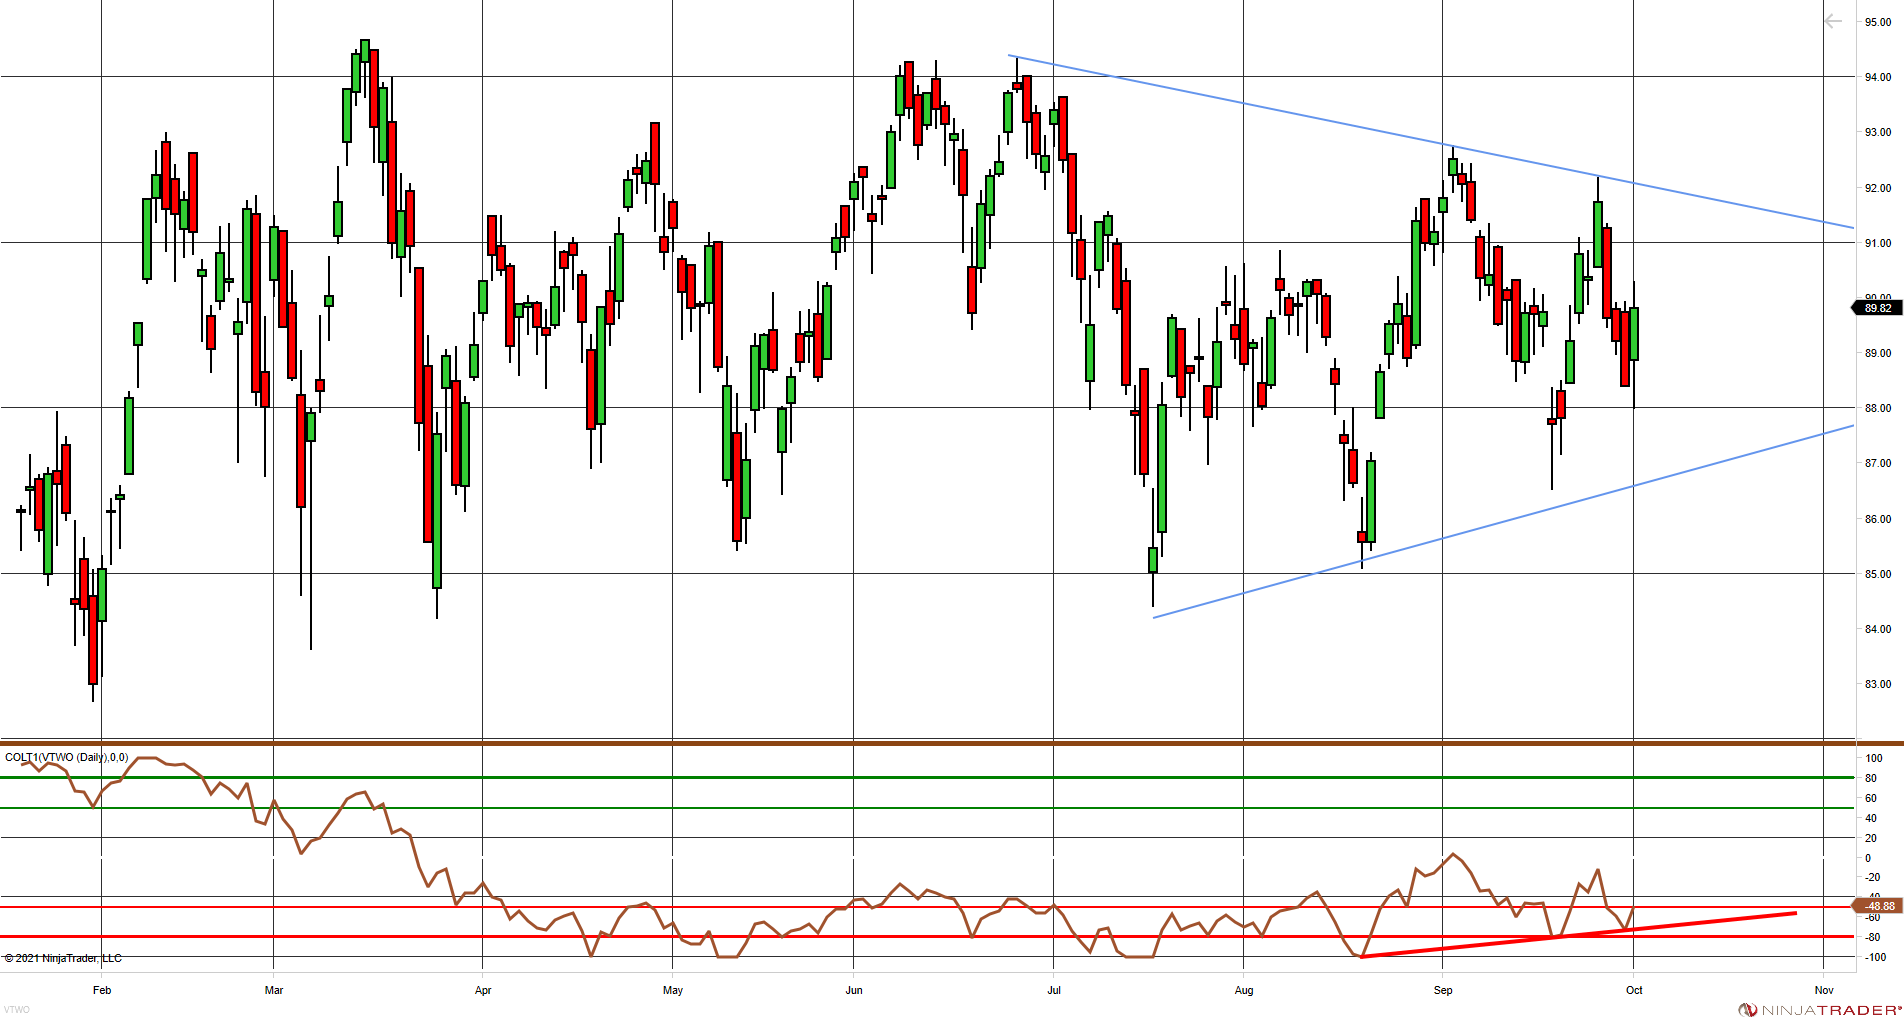
The chart of the Vanguard Russell 2000 ETF (VTWO) below shows one reason to be optimistic. Even as VTWO has gone sideways for the past many months, it is not consolidating within a symmetrical triangle, having made three higher highs and two lower lows. So if it breaks out to the upside, that will help the markets move higher.
Since Congress is driving the news, a possible agreement to resolve their differences could provide an impetus for at least a short-term bounce, but the debt limit is the heavy boulder weighing on prices.

Replicating Repligen
Let us assume you are like me and did not know anything about the company or its fundamentals. How could I have detected this one stock out of thousands? Of course, merely detecting it does not guarantee I would have traded it since there are always competing stocks. However, detecting this rally in its early stages is the bigger problem for which we have good solutions, and today I will show my tools in action.
The first tool is the “swing system” scanning tool in my new MetaStock package, Tushar Chande’s Complete Toolbox (TCCT) for MetaStock (see below). When used as a scanning tool, it shows all stocks which meet their entry criterion on a given day. For example, as the up-arrow in the chart shows, the Repligen stock started moving a few days before earnings, and the swing system detected it right away. The trailing stop would have kept you in the trade for the entire uptrend (see the red exit flag on the right). So this tool not only detected the entry but also showed you potential exits along the way.

My “long-term” system in the TCCT for MetaStock also detected the Repligen rally. This system looks at long-term breakouts, and when used as a scanning tool, shows all the stocks which meet its conditions each day. Note the green arrow (see below) that shows the entry, the series of blue arrows that confirm the trend, and the trailing stop that was hit (see red exit symbol) on the right. There is no connection between the “swing system” and the “long-term” system: they are completely different rule sets. Yet both toolsets detected the major move in RGEN and not only showed entry but also potential exits. In both cases, the Chande Trend Meter confirmed the move by staying close to 100 throughout the uptrend.

The third tool is a combination of trend strength oscillators. The Chande Trend Meter in the upper panel of the two MetaStock charts hints that during strong trends, these oscillators get close to 100 and stay there. The chart below from NinjaTrader shows many of my tools in action. First, the Chande Adaptive Price Channel (or CHAP) is the primary break-out detection rule. The breakout on July 27 after the earnings report is clearly visible and is confirmed a day later by four trend strength oscillators, two short-term (COST1 and COST2) and two long-term (COLT1 and COLT2). These oscillators may look the same but have very different formulas and time periods under the hood. Note, for example, that the long-term oscillators did not confirm the initial breakout past the CHAP channel at the left edge of the chart. So it is only a strong trend for which all four oscillators confirm the breakout. (For your convenience, we tabulate the daily readings of these oscillators for hundreds of stocks and ETFs.) You would have to sort the table using the “Sum of Scores” column to find the stop trending stocks or ETFs.
An accelerating trailing stop (Chande Accelerating Stop Exit or CHASE) is also shown with red dots. This exit strategy started relatively far away from prices and then tightened quite smartly to provide an exit within days of the high for the move.

In summary, the key tools (and where to find them):
TCCT Swing System (TCCT Package for MetaStock)
TCCT Long-term System (TCCT Package for MetaStock)
Chande Adaptive Price Channel (CHAP) NinjaTrader
Chande Oscillators (COLT1/COLT2) NinjaTrader / chandeindicators.com
Chande Oscillators (COST1/COST2) NinjaTrader / chandeindicators.com
You can use these tools to scan large databases for trading opportunities.
Wrap-up
If you like to do your own research, my posts should give you a good starting point, with context and suggestions. Then, you can visit my website, chandeindicators.com, for more information and ideas. I hope you will stay tuned and help by subscribing and recommending it to your friends and colleagues.
Thank you for spending some time with me.
Disclaimer
And now for some housekeeping. This publication is for “edutainment,” education, information, and entertainment purposes only. It is not to be construed as investment advice. Past performance is not necessarily indicative of future results. Our disclaimer at chandeindicators.com is included herein by reference.