
Finding LULU: A Tutorial on Volatility Breakouts
We illustrate how to find and trade volatility breakouts using LULU.

Overview
Stocks showed seasonal weakness as big trading houses unleashed a barrage of negative warnings.
The market tended to open higher and closed lower but held up well.
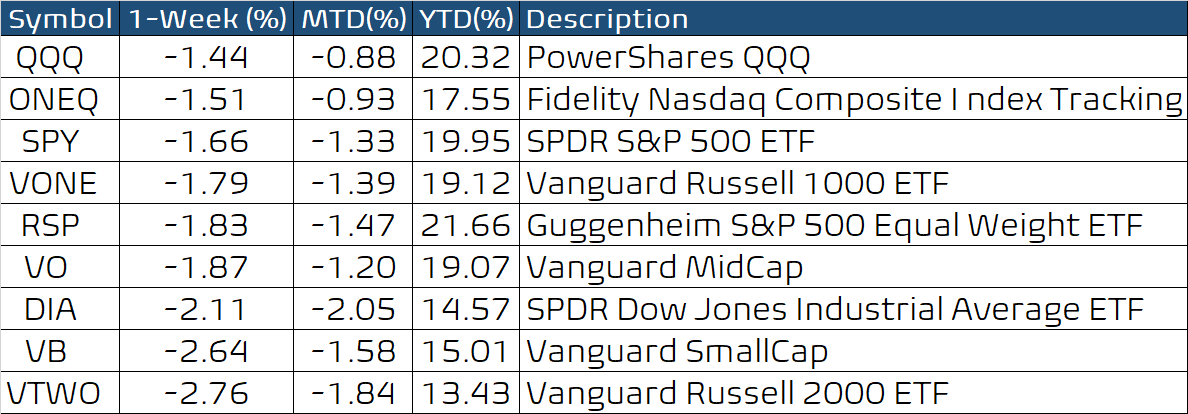
Overall, a losing week, with tech stocks holding up well but small-cap stocks weak again.
Markets are approaching short-term support, even as the long-term trend is firmly higher.
Performance Summary
A losing week in the market, as the start of September opened a period of seasonal weakness. Small-cap stocks reversed their breakout, but tech stocks held up well. It’s the old story about mega-caps versus everyone else. Unfortunately, we will have to wait for the market to work through this period.
Our sensitive bull/bear net balance turned negative at the week’s end. The weakness in the Dow 30 industrials and small-cap stocks helped push it lower. Since this indicator is based on leveraged and inverse ETFs, it quickly responds to changes.

The trend structure in the short term has turned negative when we look at key sectors and their breadth. However, the long-term view of trends in all the major US equity market sectors is positive, so this is selling with a long-term uptrend.

The Dow-30 is now in support, and it will be important to see how the market does next week. The S&P-500 is also approaching its 50-day moving average, an area of support in the recent past. So, we should see a bounce if current trading patterns are to continue.

Key Question
LULU stock jumped after announcing their earnings. So what will LULU do next? Will it be a one-day wonder, or should we expect it to trend higher? We show how to find and trade volatility breakouts using LULU as a template.

Finding LULU
Retailer Lulu reported strong earnings, and its stock broke to all-time highs on the news. So what will LULU do next? Since there are thousands of stocks, how does one find and trade a stock like LULU? What are the different exit strategies?
One way to find such stocks is to, of course, read the financial press. But not every breakout gets reported in the press. So, a systematic way to search for them is by using a volatility breakout “system.” First, we measure the volatility, and then, we look for a close that “is far away from the previous close,” determined as some multiple of the volatility. The new MetaStock package I have developed for them allows you to search their stock databases systematically.
We begin by showing the MetaStock scan screen on the MetaStock Power Console. We choose the “TCCT Volatility Breakout System” (briefly discussed above) and apply these rules to the stocks in the NASDAQ exchange list. The results of the scan are shown below. Only 16 stocks were selected out of 3942 possibilities, with LULU among them. So this process is very selective, greatly reducing your analytical load.

The volatility breakout template below lays out the price action that the scan engine picked up. The green line above prices is the breakout level. Lulu clearly opened well above the green line and closed above it.

Another way to find LULU is to search our Stock Finder table on chandeindicators.com. If one were to rank the stocks by COST2, one of our short-term momentum measures, then LULU is in the top 20 or so. A complete view of the table is shown below.


Now that we know how to find LULU, how can we trade it? First, we need an entry rule. We could buy at the market or above the high of the day of the volatility breakout. My expert commentary on MetaStock recommends buying above the high of the breakout to get additional confirmation that the stock wishes to move higher. In the screenshot below, the suggested entry price is above 445 to avoid a situation with a rapid reversal.

You can imagine that prices could move in infinitely many ways. However, the long-term expectation is that LULU should be higher, say six months from now, because of its strong earnings and guidance. We show a template using the Synopsys chart (SNPS) as a guide.
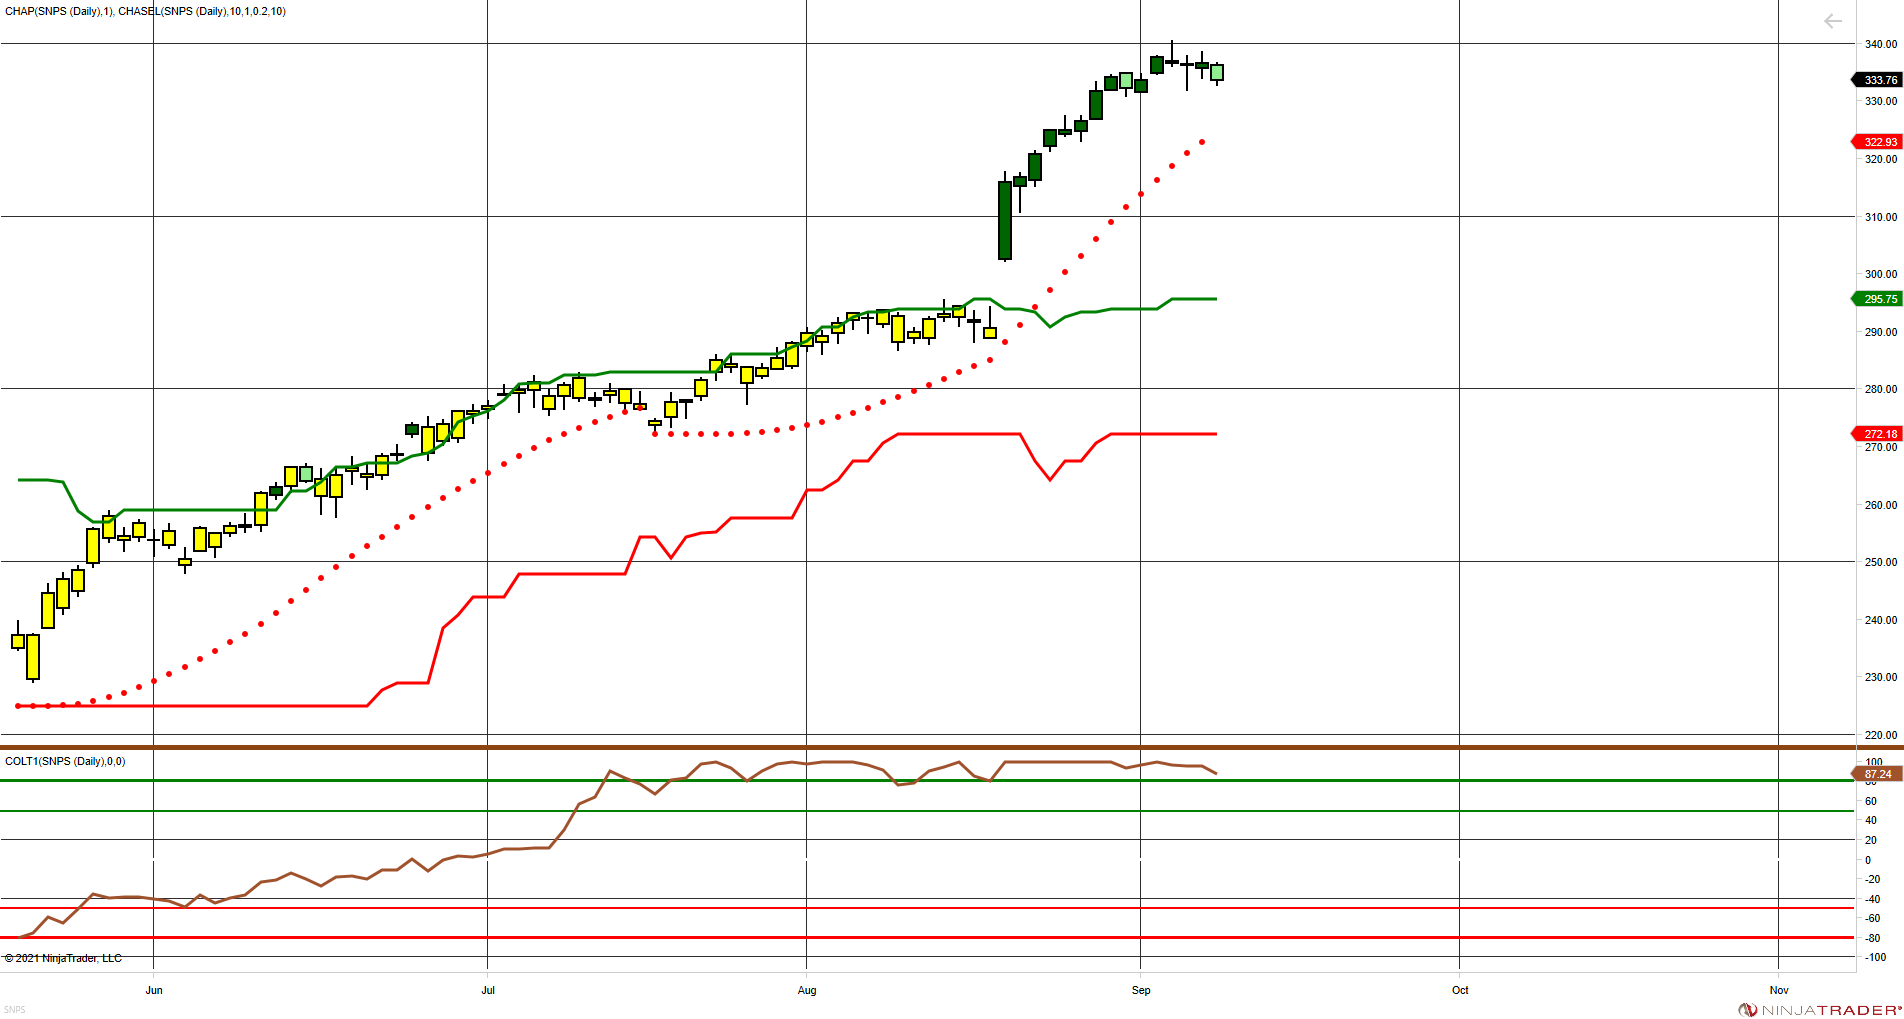
The SNPS chart shows a volatility breakout followed by an immediate follow-through. The SNPS chart is a template. It shows a trailing stop that you could use to get out if you are a medium-term trader. Longer-term traders could use some other trailing stop strategy, or none at all, if you plan to hold for more than a year.
The GOOGL chart below offers another perspective. The red arrow points to the volatility breakout that began a slow but steady climb since February this year. The point of this chart is that trading the volatility breakout can take patience: the volatility breakout model detected an important move in the stock, but investors benefited only with a patient exit strategy.

Clearly, the volatility breakout scan offers an important tool to find investing opportunities, and the model is flexible enough to be useful to traders with various holding periods.
Wrap-up
If you like to do your own research, my posts should give you a good starting point, with context and suggestions. Then, you can visit my website, chandeindicators.com, for more information and ideas. I hope you will stay tuned and help by subscribing and recommending it to your friends and colleagues.
Thank you for spending some time with me.
Disclaimer
And now for some housekeeping. This publication is for “edutainment,” education, information, and entertainment purposes only. It is not to be construed as investment advice. Past performance is not necessarily indicative of future results. Our disclaimer at chandeindicators.com is included herein by reference.