


New Bull or Old Bear?
Bears have not given up yet. We look at the data.

Overview
US nonfarm jobs increased by a super-strong 528,000, and the unemployment rate dropped to 3.5%, defying expectations of an increase of 258,000. Both have now returned to their pre-pandemic (February 2020) levels.
The solid economic data and growth in hourly wages (+5.2% y-o-y) mean that the FOMC can keep raising rates in September.
The services sector expanded with a reduction in input costs indices in the latest data showing a strong economy.
Well-respected Wall Street research firm Ned David Research feels that market technicals support the start of a new bull market. The market is just testing the June highs near 4175, but money managers would need a sustained move above the January low (4222) and the 50% retracement (4227) to affirm the start of a new bull market.

Key Question:
Is this the start of a new bull market, or just another bear-market rally?
Performance Review
The S&P-500 stalled at the June high (4177) as it awaited the employment data on Friday and had to fend off Fed speakers ramming home their anti-inflation message. Technology and small-cap stocks continued their uptrend.

The sensitive net bull/bear balance remained above +60, indicating a continuation of the current uptrend.

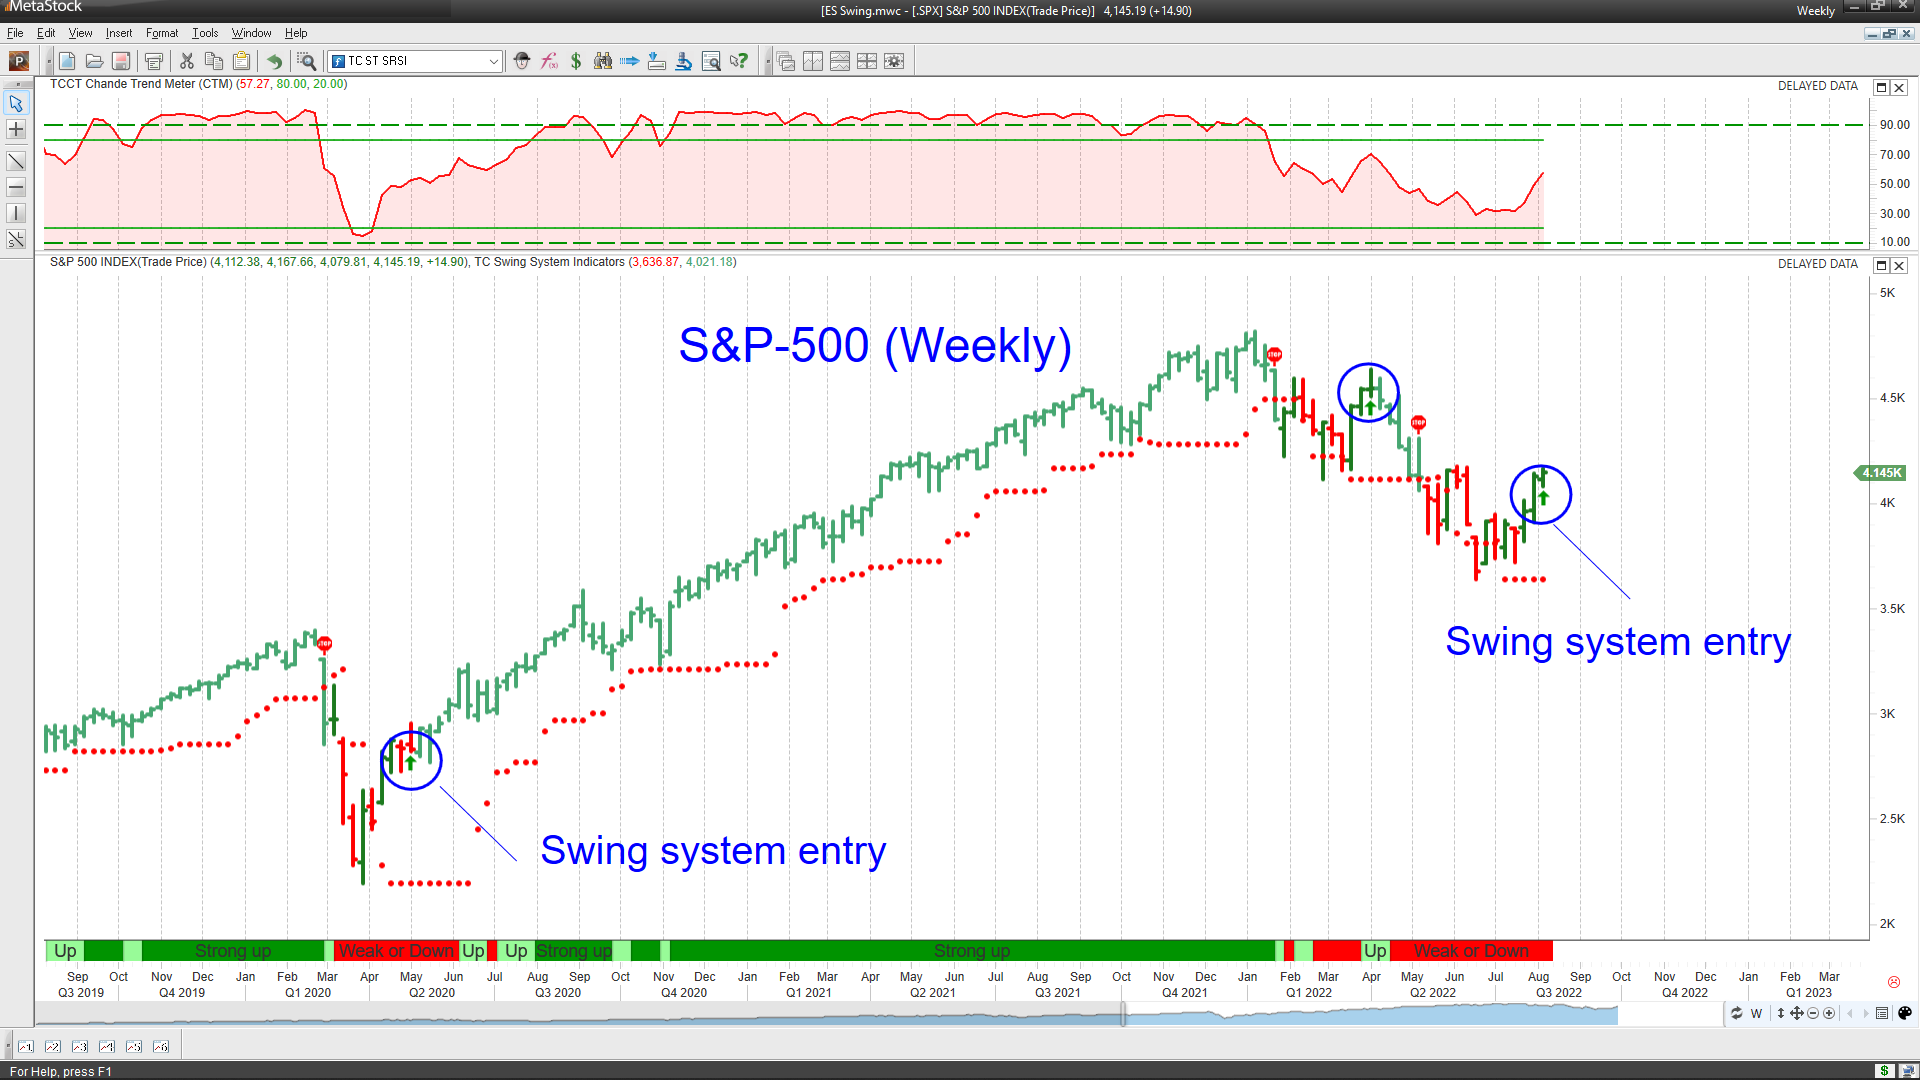
Another sign that the trend is changing is that we now have my Swing System entry into the S&P-500 on weekly data. Observe where the entry occurred after the March 2020 declines and the exit near the very top in January 2022 (red dots). We had one false signal in April. The swing system buys weakness, so a continuation of the prior downtrend does occur frequently, hence the trailing stop (red dots). Of course, the same system gave a long entry on daily data on 06/24 (stopped out) and then on 07/20. On hourly data, the first entry off the lows was on 06/17 (@3704).
A New Bull Market
New Bull? Old Bear? Since the June low (we called it), the rally has been broad, with double-digit percentage gains. But since inflation is high and hawkish Fed talk persists, bears hold out hope for another down leg to 3200. So we analyze whether this is a new bull or an old bear.
First, we look at the internal technical condition of the market using the S&P-500 universe and the 14-day Relative Strength Index (RSI). The RSI is the proportion of up-side momentum over the past 14-days. So, when we see several losing days over two weeks, the RSI drops below 20. Conversely, when there are many up days over the previous two weeks, the RSI rises above 70. However, internally, the RSI smooths the momentum using a variation of exponential moving averages. Therefore, it is difficult to lift the RSI above 70 (or push it below 20) unless there is a sustained upward (or downward) trend in prices.
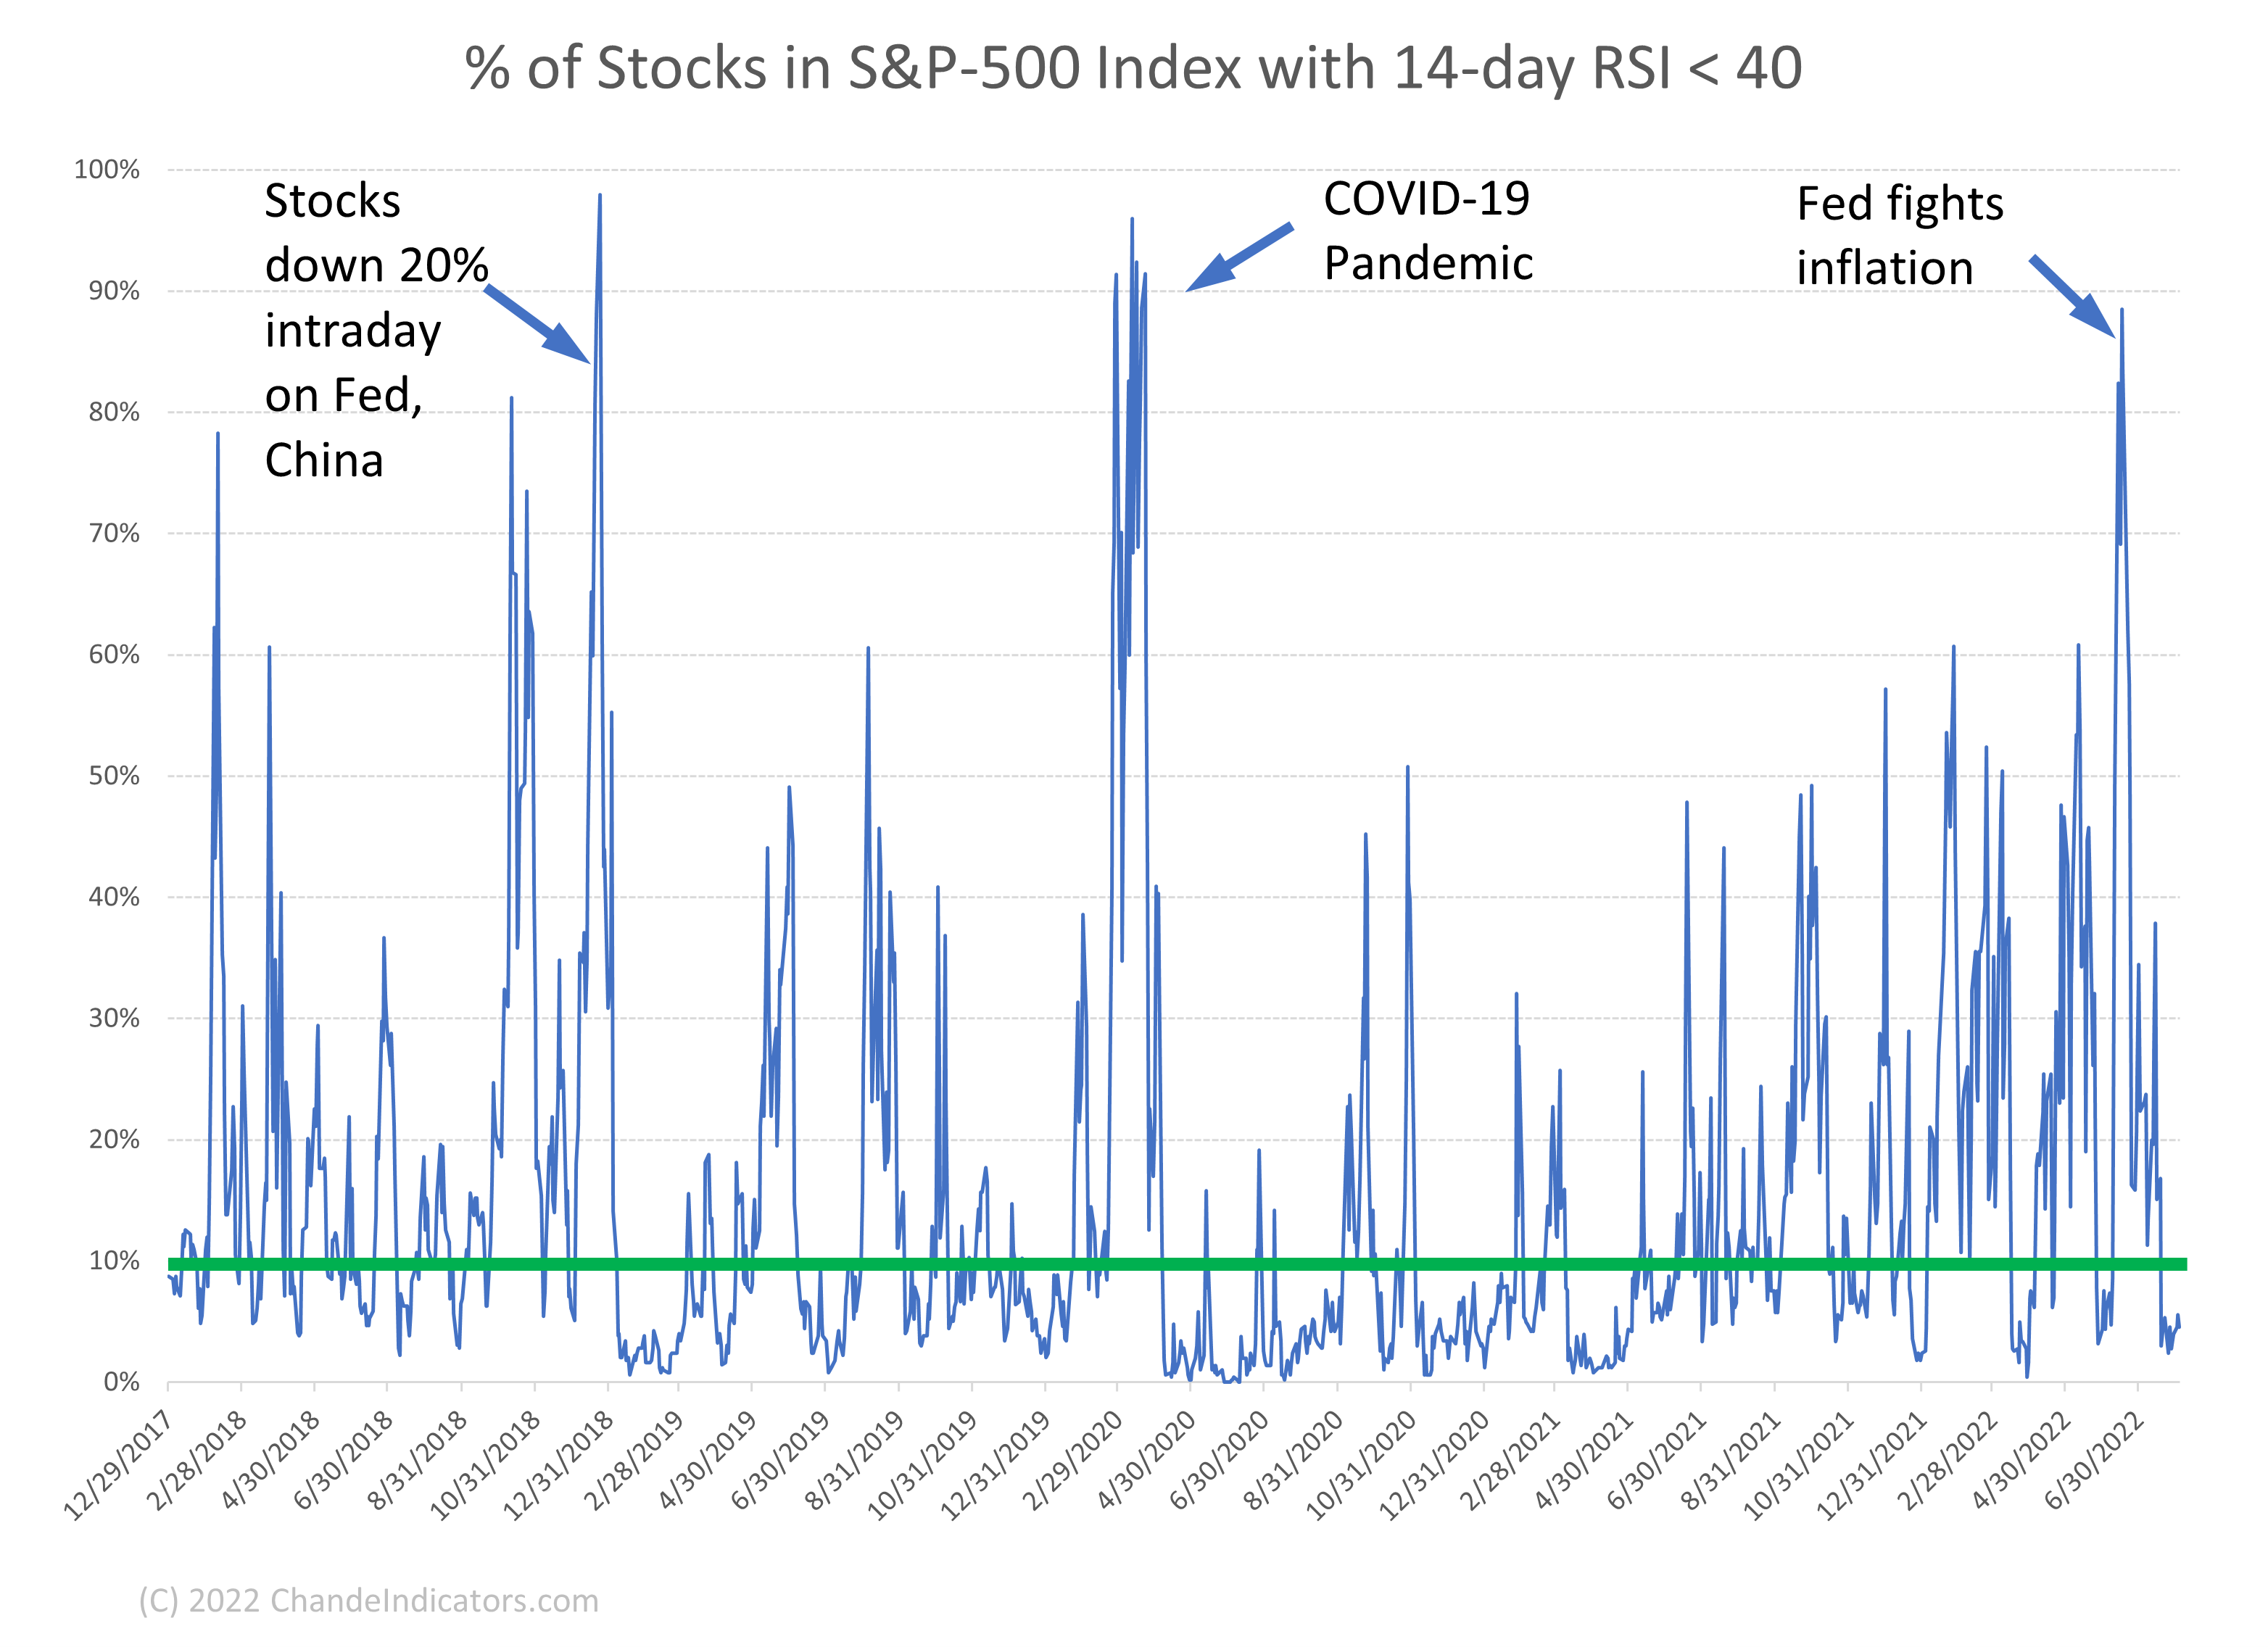
The chart below looks at bear-market conditions. It shows the proportion of S&P-500 stocks with a 14-day RSI below 40 since 2018. During bear markets, we expect this proportion to rise. The chart below shows that the percentage of stocks with a 14-day RSI below 40 spikes above 85% during significant market sell-offs, and it did so earlier this year. Observe that this proportion drops below 10% of all stocks in the index during bull markets.
We now ask how the distribution of 14-day RSI values behaves during the bounce away from a critical market low. Here we plot the proportion of S&P-500 stocks with a 14-day RSI above 70. Again, I will remind you that due to internal smoothing, it takes a lot of bullish momentum to push an individual stock’s 14-day RSI above 70.

During bullish surges from market lows, the proportion of stocks with a 14-day RSI greater than 70 rises above 15%. Note how this pattern repeated during the move off the June lows. This proportion has not yet climbed above 25%, giving bears hope and bulls a pause.
So, the current market recovery has met both of the abovementioned conditions. First, the proportion of stocks with weak momentum (a 14-day RSI < 40) has fallen below 10%. Second, the ratio of stocks with a 14-day RSI greater than 70% rose above 15%. Hence, this market looks more like a bull and less like a bear using the 14-day RSI analysis.
The bears believe we are in a recession (which could worsen) because we did get two successive negative real GDP readings. However, the National Bureau of Economic Research (NBER), which is the arbiter of recessions, uses a different definition. The NBER uses nonfarm payroll employment data as one of the many factors to be considered. Therefore, I have plotted the US Unemployment rate (along with its 12-month simple moving average and a line 5% above the average) and compared it to official NBER recessions since 2000.

As a general rule, the unemployment rate was at least 5% above the 12-month average before an NBER recession call. Currently, the unemployment rate is below the 12-month average, so the NBER is unlikely to assess that we are in a recession.
So, taken together, the internal technical strength of the market, the resilience of the job market, and the resurgence of the US services sector suggest that we are more likely to be in a new bull market than an old bear market. But, of course, anything is possible, and the Ukraine war remains the wild card that could upset this apple cart.
Where the Trends Are
The CPRX (Catalyst Pharmaceuticals) chart below is in our favorite trending indicator setup. CPRX has sustained a breakout with CTM > 90, a sure sign of trend strength.

For more investing ideas, explore the following symbols in the S&P-500: Enhpase (ENPH), Lamb and Weston (LW), Brown-Foreman Corp. (BF.B), Cadence Design (CDNS), and Genuine Parts (GPC).
For those with a sector focus, here are the major equity sectors ranked by CTM courtesy of MetaStock.

Wrap-up
My posts should give you a good starting point, with context and suggestions if you like to research. Then, you can visit my website, chandeindicators.com, for more information and ideas. I hope you stay tuned and help by subscribing and recommending it to your friends and colleagues.
Thank you for spending some time with me.
Disclaimer
And now for some housekeeping. This publication is for “edutainment,” education, and entertainment, not for investment advice. Past performance is not necessarily indicative of future results. Our disclaimer at chandeindicators.com is included herein by reference.