


Falling Knives, Bouncing Dead Cats
We discuss my swing system to buy near market lows.

Overview:
The bulls gained confidence this week. On Tuesday, 90% of the NYSE stocks were up, accounting for more than 90% of the day’s volume. A 90% up day is typical of significant bottoms and consistent with my market low call four weeks ago.
A Bank of America Fund Manager Survey showed the widespread pessimism needed for market bottoms, further encouraging bulls.
Americal Express earnings were robust due to ~30% jump in consumer spending on travel. So, the consumer is still alive and well.
Turkey, Ukraine, and Russia have signed an agreement to permit grain shipments from Ukraine, which would be significant for world hunger (and grain price inflation). In other war-related news, Richard Moore, head of UK’s MI6, said that he expects the Russian military operation to “run out of steam” in the coming weeks. Both these factors, if true, will help ease market worries.
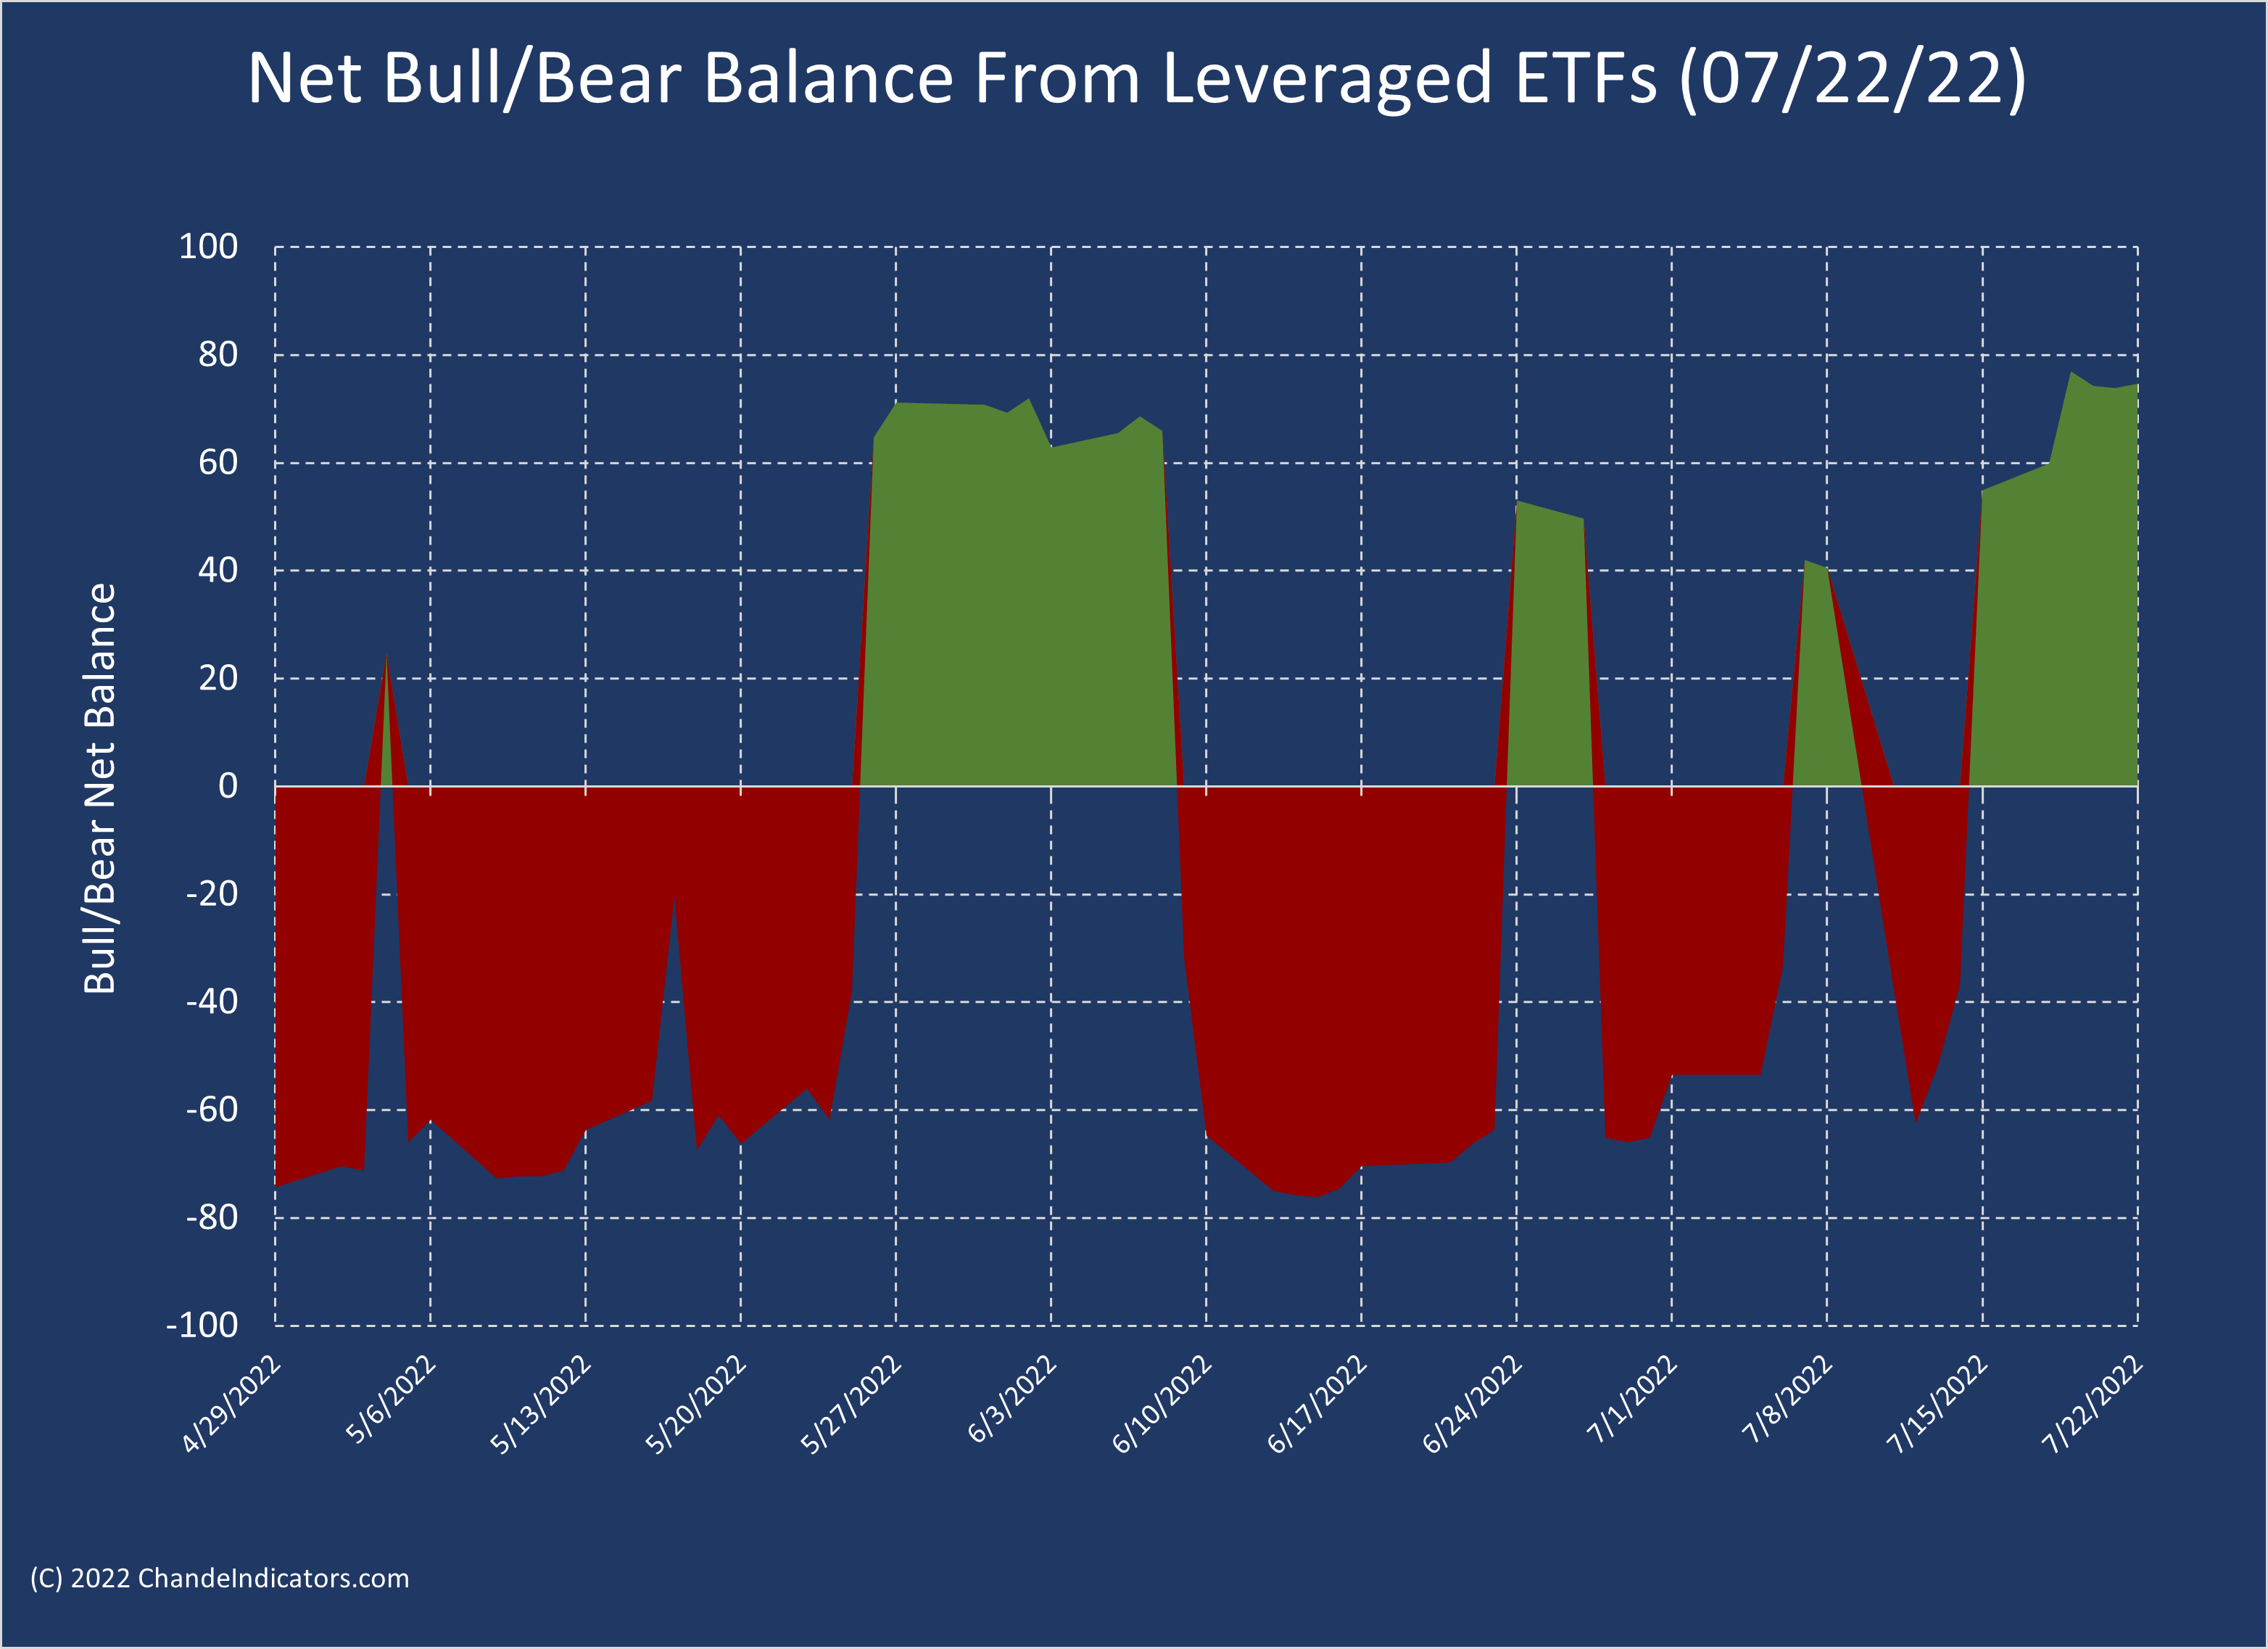
Our net bull/bear indicator rose above +70, indicating that the uptrend can continue.

Key Question:
How does one buy “near” market lows? When the market crashes, buying is discouraged with advice such as “don’t catch a falling knife” and skeptics ignore rallies as merely a “dead-cat bounce.” Now that the markets may have put in a near-term low, such rebound opportunities abound. We discuss my swing system for a systematic approach to buying near lows. (The Swing System is included in Tushar Chande’s Complete Toolkit for MetaStock.)
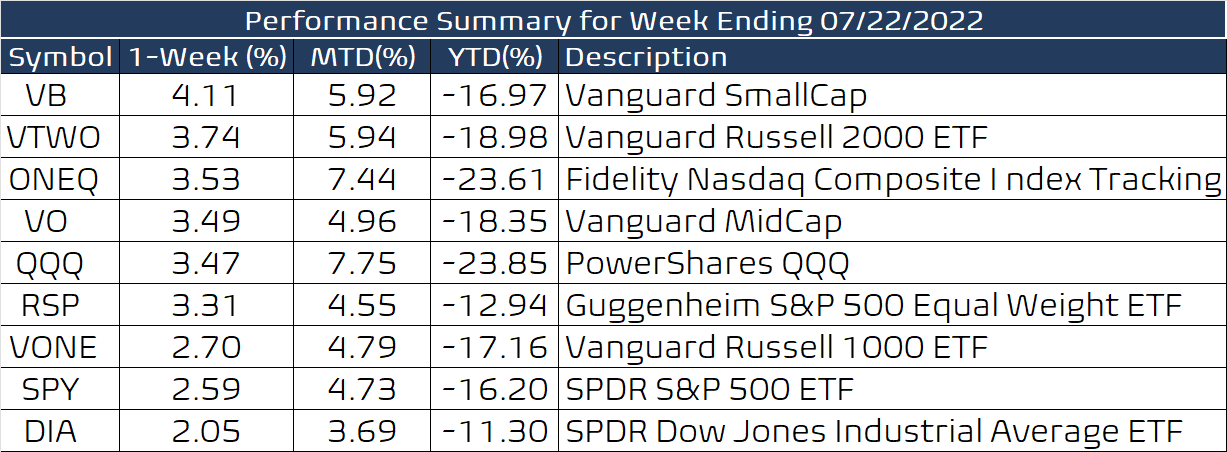
Performance Summary
As I hoped last week, the S&P-500 closed the upper downside gap, and the VIX index declined decisively outside its triangular consolidation. Both are good for bulls. In addition, the Chande Trend Meter for the SPX rose above 90, indicating strong upward momentum. Now we must go past the FOMC meeting next week.

The downside breakout in the VIX index is bullish because it shows that fear is subsiding and risk-on rallies are likely to succeed.

Small-cap and technology stocks led the way in this week’s rally, and the QQQ has already risen above the upper gap, which marked the May sell-off.
The 20-day selling intensity has diminished this week, which is another sign of rising upside momentum.

The Swing System
It is difficult to systematically identify significant price lows using rules that can be applied to any instrument on any timeframe. Naturally, the rules will not be perfect since there could be many unprofitable trades due to the random behavior of prices.
If you tried to pick a low at random, you would be hard-pressed to do it successfully thousands of times. Specialized data, such as breadth, sentiment, and the commitment of traders’ reports, are available for market indexes or futures contracts. These can be useful to locate significant lows but are not available for individual securities. Price patterns, such as the Doji candlestick patterns, often do not occur consistently at every market bottom. Further, patterns (or data) on the daily charts may not be visible (or available) on weekly or intraday charts. So this is a non-trivial problem to find robust rules suitable for any instrument or time frame, but the Swing System does just that. Here are a few examples.
The Ark Innovation ETF has suffered intense selling since the start of the year. The chart below shows the most recent swing system entries. The red dots are the trailing stop, and the green line is the “trigger line.” A close above the trigger line is needed to set the entry conditions. The upper panel shows the 7-period stochRSI indicator on a scale of 0-1. When short-term momentum is weak, we see the indicator is close to zero. Note how low readings of the stochRSI indicator preceded entries and high readings followed after entries. So the swing system buys strength after weakness.

The power of this approach is that it is universally applicable for any instrument and any time frame. Below we show an example of the system on the S&P-500 futures contract using a 30-minute chart. The three unprofitable trades in a row near the middle of the chart show that the system is imperfect since its entry conditions can be fulfilled without a follow-through to the upside by the market, i.e., the downtrend can resume.

Next, we use the daily chart for a stock, EQT corporation, to show that this strategy can work very well when the market reverses into a sustained uptrend. The system identifies a bounce after weakness but cannot guarantee that the short-term uptrend discovered by the model will continue.

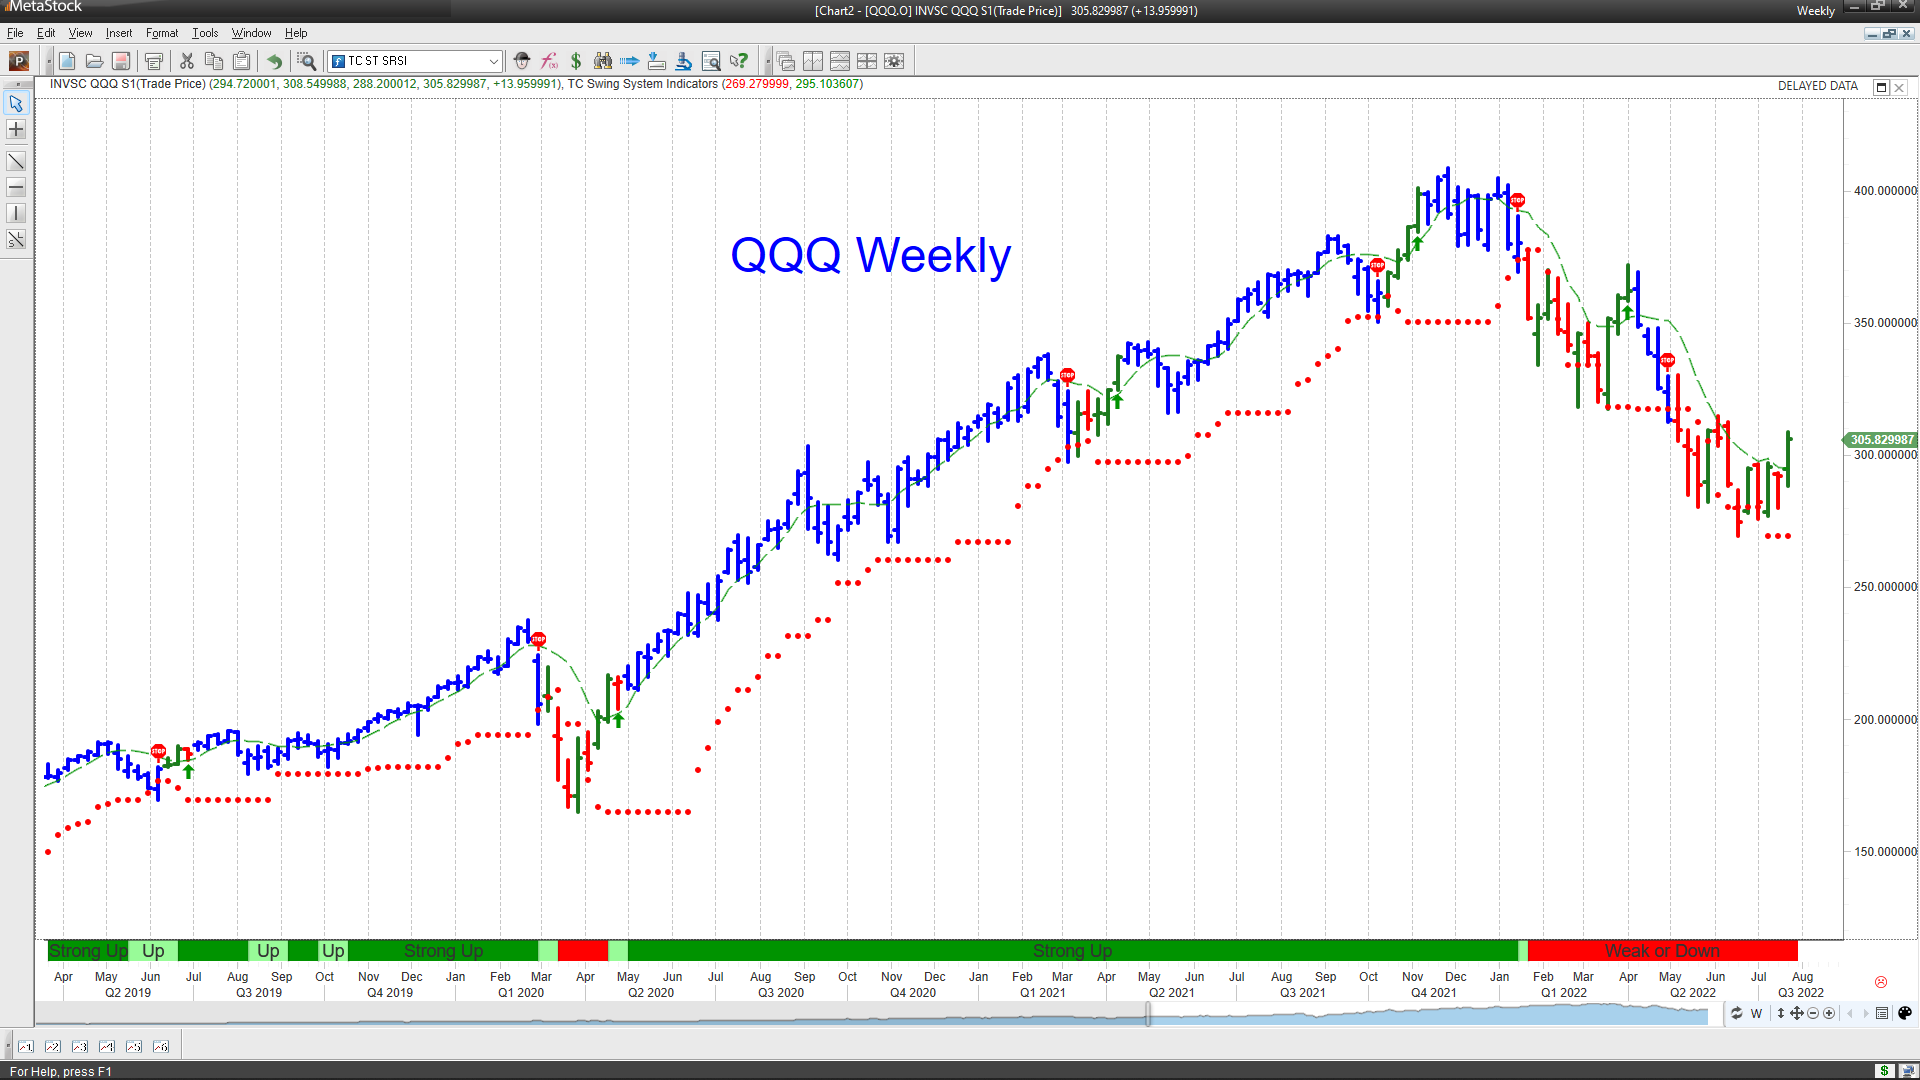
Lastly, here is an example of applying the system to weekly data for the QQQ ETF. The chart shows the 2020 decline and how the system followed the trend quite effectively to the January 2022 high. The system’s power derives from combining a counter-trend entry with a trend-following exit.
MetaStock Webinar on Swing System
There is not enough space to discuss the many details of the Swing System. I am hosting a seminar with MetaStock on July 27 (3:00-4:00 pm NewYork time) that you can visit in person or check out later on Youtube. To register, please use this link.

Wrap-up
My posts should give you a good starting point, with context and suggestions if you like to research. Then, you can visit my website, chandeindicators.com, for more information and ideas. I hope you stay tuned and help by subscribing and recommending it to your friends and colleagues.
Thank you for spending some time with me.
Disclaimer
And now for some housekeeping. This publication is for “edutainment,” education, and entertainment, not for investment advice. Past performance is not necessarily indicative of future results. Our disclaimer at chandeindicators.com is included herein by reference.