


Market Low?
Could weaker commodities and recession fears subtly create a market bottom?

Overview
Key interest rates reversed this week as fears of a recession rose.
Futures contracts on grains and energies have crumpled over the past two weeks, perhaps helping to ease inflation readings later this year. (See Dan Yergin’s energy market comments here.)
The markets found a ledge of support from weakening rates and commodities, even as sentiment remains hugely bearish, and JP Morgan raised their year-end S&P-500 forecast to 4800.
Next week’s PCE report will be crucial for market action. The Cleveland Fed Inflation Nowcast projects PCE at 6.6% for June (vs. 6.46% in May), with core PCE slowing slightly to 4.70%.

Composite charts for US 10-year yield, US 2-year yield, Wheat, Soybeans, RBOB Gas, and Natural Gas futures show declines over the past month. (Charts courtesy CNBC.com)

Key Question:
During FOMC Chair Powell’s two-day testimony to Congress this week, he reiterated his unconditional commitment to fighting inflation while acknowledging the many factors outside his control. One such factor might be rising shelter costs. We explore the impact of rising rates on CPI calculations.
Performance Summary

The markets showed some resilience this week, even as commodities and interest rates declined over rising recession fears. The S&P-500 rebounded to close the first of two crucial gaps on daily charts. We should note that the $VIX volatility index remained below the recent highs (between 36-38) during the intense selloff last week.

The net Bull/Bear balance turned positive at the week’s end but remained just below the level (i.e., +60) needed to indicate continued strength. As we discussed last week, we are all data-dependent now, and the PCE report (June 30, Thursday) will drive trading all week. Since there is a long weekend (July 4th holiday Monday), expect some selling ahead of it.

The $VIX index, a crucial measure of risk-on/risk-off behavior, is locked in a triangular consolidation. A break below the lower trend line would be bullish, and a break above the upper trendline would be bearish.

Extended Fibonacci charts for the 10-year T-Note futures and S&P-500 showed them both at significant support. We start with the Sep-22 T-Note chart, which found support near the 262% decline extension. Note below how the TN contract traded near the 50%, 100%, 162%, 200%, and 262% extensions. These same levels will provide resistance as rates cool, and the ~130 contract price is an area of key resistance.

The same pattern is visible in the S&P-500 Sep22 contract chart (see below).

Rising Rents Are Inflating the CPI
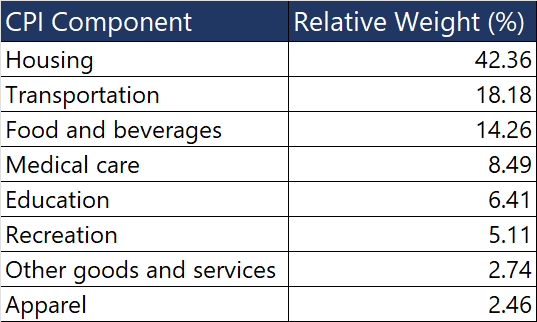
Since the ongoing monetary tightening is driven entirely by inflation data, I decided to look into the components of the CPI itself. As the table below shows, housing-related expenses account for more than 42% of the relative weight. Specifically, the cost of shelter (not shown but included in the Housing component below) has a relative weight of approximately 33%.
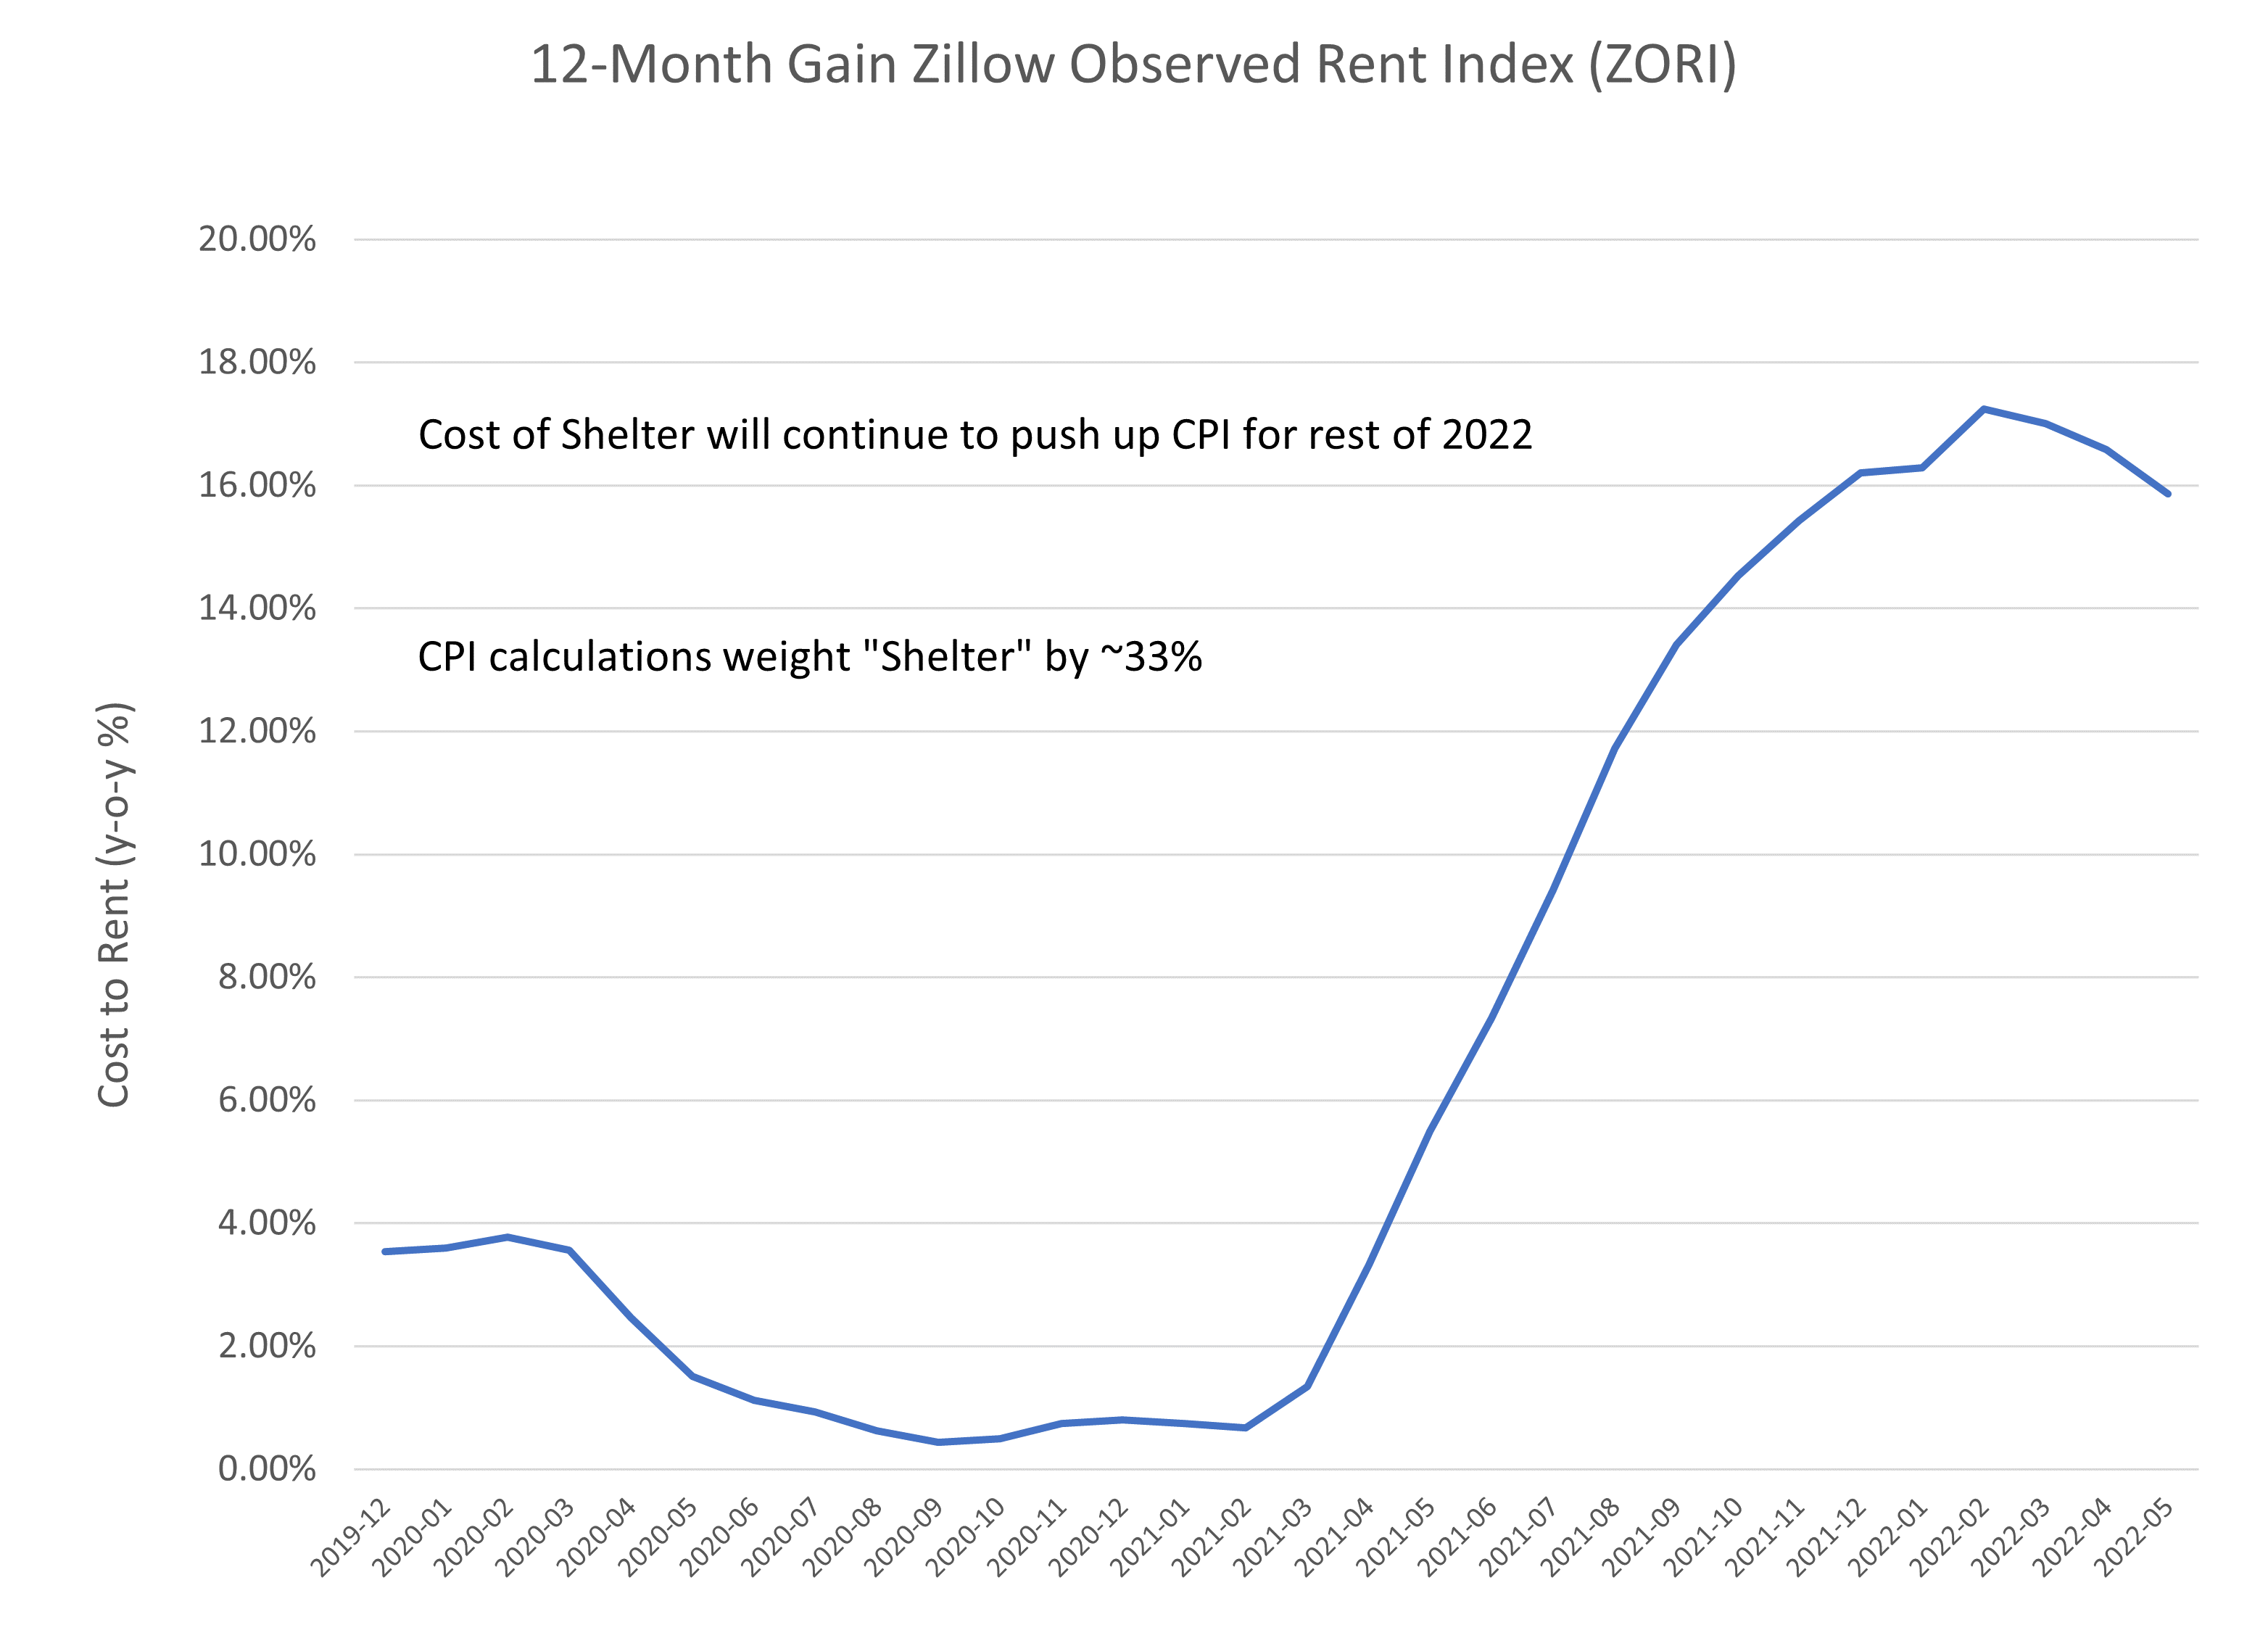
Zillow publishes actually observed data on rents, called the Zillow Observed Rent Index (ZORI). During the early phases of COVID-19 shutdowns, rents fell rapidly. However, recently they have been rising rapidly (see below). In addition, NPR reports that some renters are entering into bidding wars. A look at the CPI methodology suggests that these rising rental costs will continue to push the CPI higher for the rest of the year, complicating the FOMC’s war on inflation.
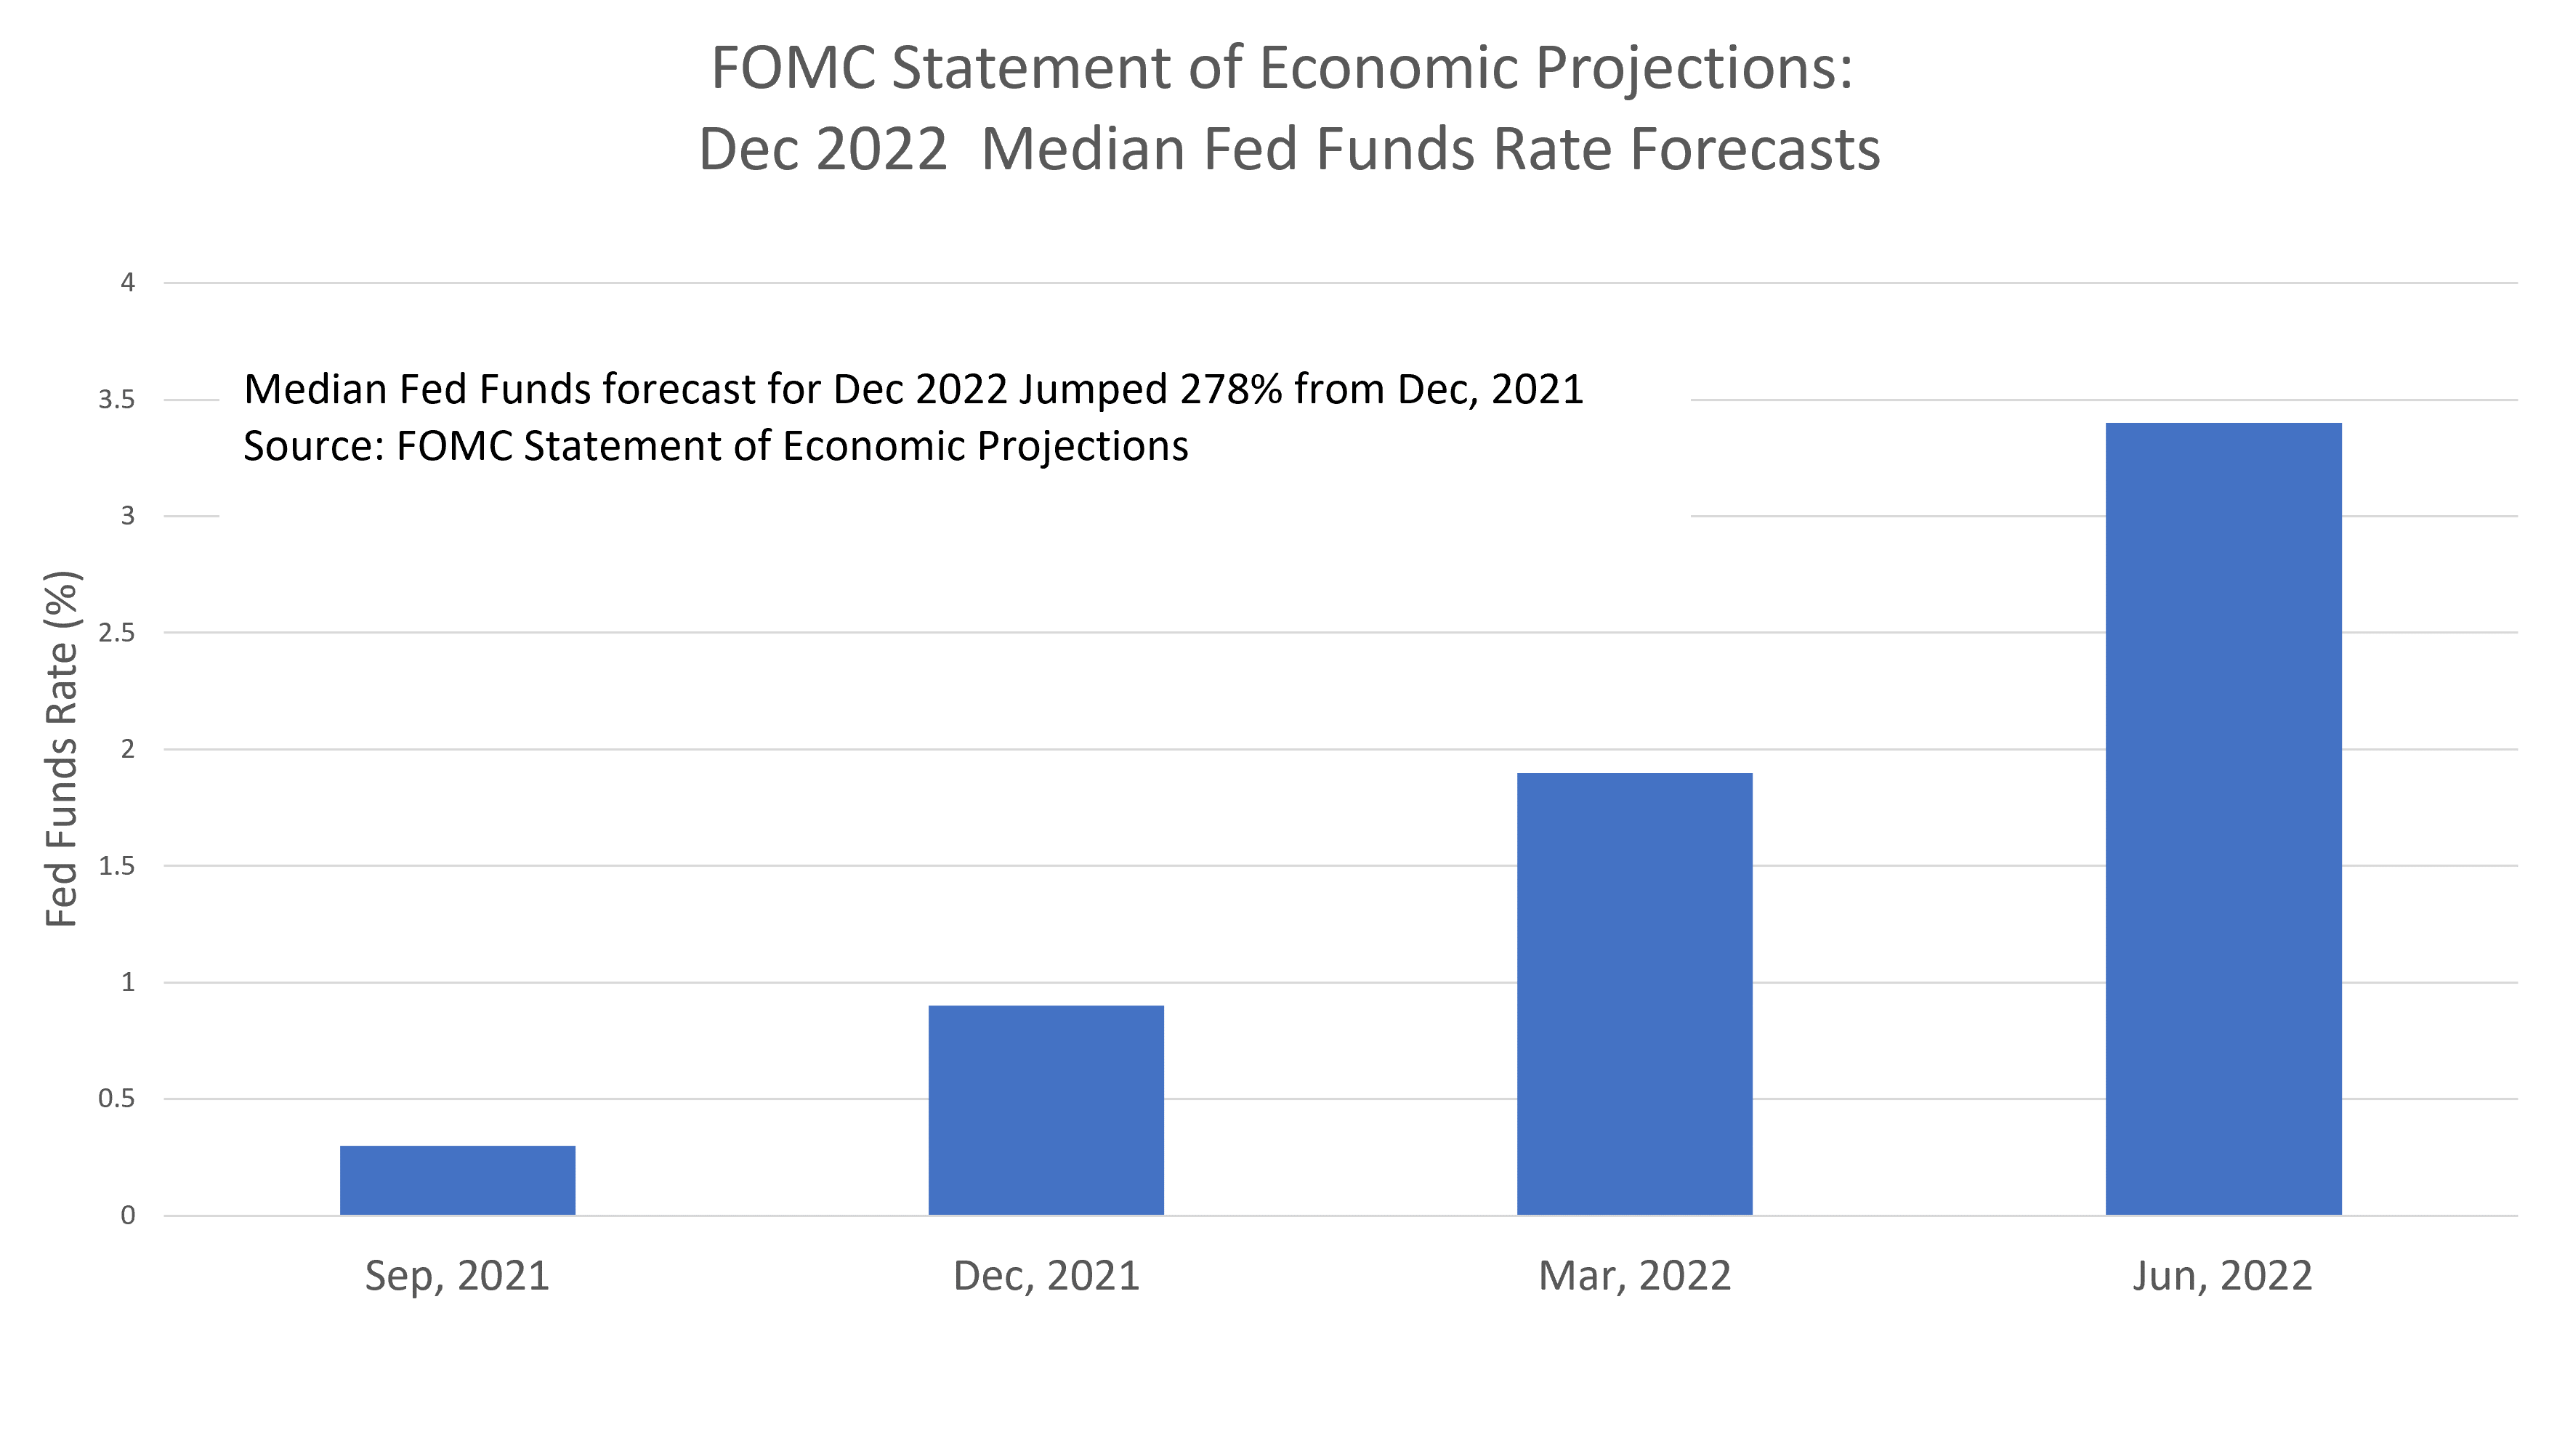
The FOMC compensated for its tardy response to rising inflation by juicing its rate hikes. The chart below shows the data from the Summary of Economic Projections issued by the FOMC. The median Fed Funds forecast for December 2022 was just 0.9% as recently as December 2021. However, their year-end 2022 forecast rocketed from 0.9% to 3.4% over the next six months. Hence, the fears of recession have been growing because some in the market fear that the FOMC will cool the economy faster than it expects, just it was wrong last year about how hot inflation would get.
Wrap-up
My posts should give you a good starting point, with context and suggestions if you like to research. Then, you can visit my website, chandeindicators.com, for more information and ideas. I hope you stay tuned and help by subscribing and recommending it to your friends and colleagues.
Thank you for spending some time with me.
Disclaimer
And now for some housekeeping. This publication is for “edutainment,” education, and entertainment, not for investment advice. Past performance is not necessarily indicative of future results. Our disclaimer at chandeindicators.com is included herein by reference.