

Soft Inflation, Hard Rally
Soft Inflation, Hard Rally
We review the accuracy of our major calls over the past few weeks.

Overview
The markets rallied hard after CPI came in a bit cooler than expected, albeit due to a quirk in its calculations. We’ll take it because other “quirks” have been holding up the CPI, such as its shelter cost algorithm. The chart below shows that the CPI yearly change has fallen below its 12-month moving average, a welcome sign of weakness.

The more important development may have been the steep declines in the 2-year T-Note (-30bp) and 10-year T-Note (-33bp) yields. It confirmed that even the bond market vigilantes feel this was a meaningful data print. Technology stocks were the primary beneficiaries of the lower rates.


The FOMC is likely to step down to a 50-bp increase in its Fed Funds rate in December and continue its current tightening regime through the first quarter before pausing. (It and the markets remain dependent on inflation and unemployment data.)
Key Question:
Last week we wrote: “The longer-term Diversified Trend Index also declined into the neutral zone, which means the uptrend could resume next week since the decline occurred without a significant increase in VIX or a change in the futures curve.”
How have my recent predictions worked over this very volatile period? We review them below.
Performance Review
As we said for the past three weeks, the election and the CPI report were event risks. In this case, a risky event for shorts, so the bulls were delighted. The powerful rally which ensued after the weak CPI data with follow-through on Friday was everything the bulls could have hoped for after some hesitation on Tuesday and Wednesday. In addition, mega-cap growth stocks bounced up vigorously as interest rates collapsed on Thursday, closing the gap to the value-weighted stocks. Finally, note, for example, the 8.8% gain for the tech-based QQQ ETF, with virtually all of it coming after the CPI report.

The rally used a lot of oxygen or energy, so I expect some consolidation next week. However, the Net Bull/Bear balance is well above 60, suggesting that the rally can continue.

The broader Diversified Trend Index also had a bullish week ending at +300, after some choppiness mid-week. A reading of +300 means that the three models underlying the DTI are all trending up, which implies that the uptrend can continue.

The short-term trend is certainly up, though bears are looking to push back against an overbought or overdone market. So we will stick to my indicators and look for the uptrend to continue.
A Review of My Recent Posts
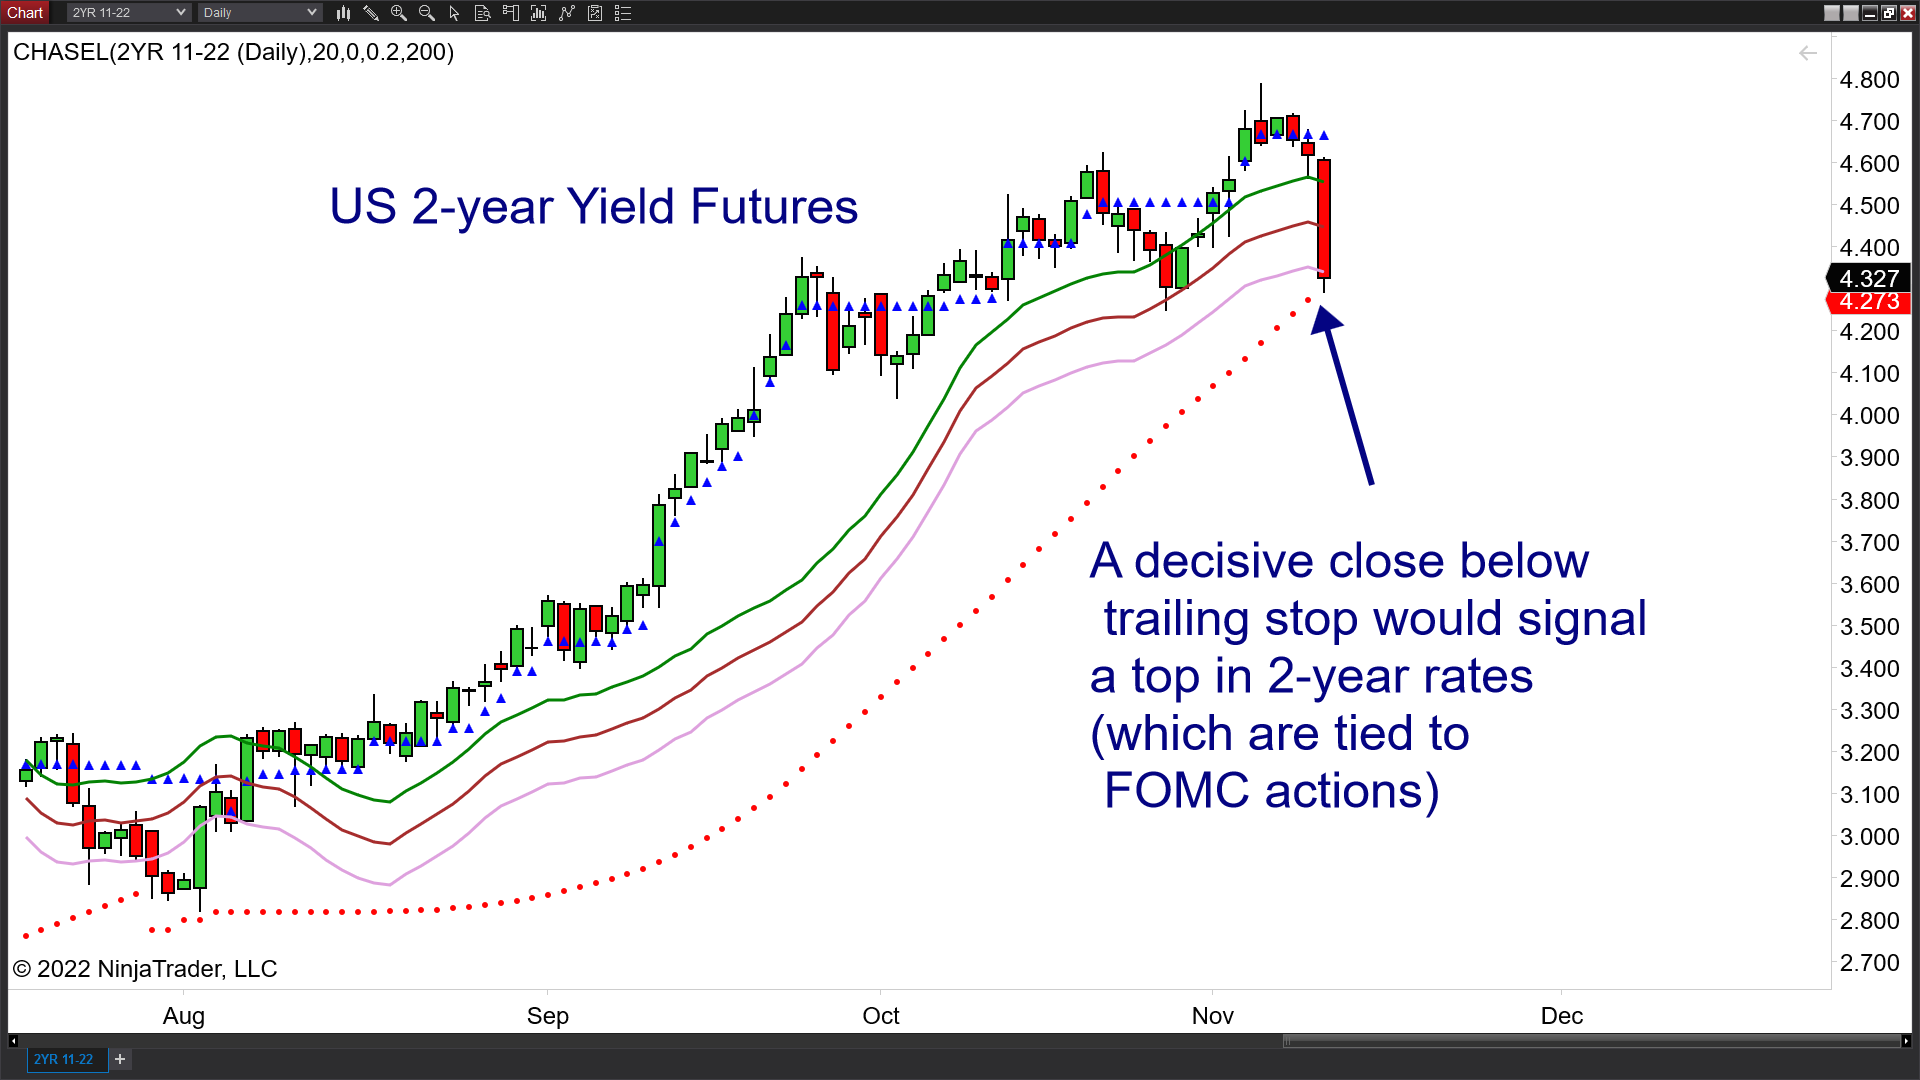
In an earlier post (October 21), I suggested that rates may be peaking and the broader stock market could breakout to the upside. As I hoped, the 2-year yield futures pulled back to a critical trailing stop on Thursday.
In that same post (October 21), I wrote about the 10-year T-Note “Currently, the 10-year note is near critical support via Fibonacci extensions” and showed the chart below.

Here is that chart as of last evening. Again, we pinpointed the low to the day.

In my post on Oct-14, I discussed that we may have formed the second low of a triple bottom on October 13. Here is the chart I used then.

Here is the ES 12-22 weekly chart as of 11/10 after the post-CPI rally. The discussion of the bottom seems well-timed in retrospect.

We highlighted Annika Therapeutics in my post on October 28. Here it is as of 11/10. A review of the top few sectors ranked by Chande Trend Meter showed that they also did well today.

So, I was right on the money on the two most important calls, the low in 10-year Note futures prices and the S&P-500 low. Of course, I recognize that I will be wrong frequently in the future, but it is good to know I could handle all the uncertainty of the past few weeks. (This justifies my claim below that “my posts should give you a good starting point for your research.”)
Wrap-up
My posts should give you a good starting point, with context and suggestions if you like to research. Then, you can visit my website, chandeindicators.com, for more information and ideas. I hope you stay tuned and help by subscribing and recommending it to your friends and colleagues.
Thank you for spending some time with me.
Disclaimer
And now for some housekeeping. This publication is for “edutainment,” education, and entertainment, not for investment advice. Past performance is not necessarily indicative of future results. Our disclaimer at chandeindicators.com is included herein by reference.