

Forming A Triple-Bottom?
Forming A Triple-Bottom?
Inflation data lose shock value as market reverses at SPX~3500.

Overview
The markets shrugged off stronger-than-expected inflation data to form a key reversal: they dropped more than 2% but closed substantially higher (and above previous highs). However, there was no follow-through on Friday as the S&P-500 closed lower.

British PM Truss roiled their bond market on Friday after ditching some of her fiscal proposals. The tug of war between the Bank of England and the new prime minister also nudged US 10-year yields higher, pressuring US equities.
The September CPI data showed inflation 8.2% higher than a year ago, on the heels of higher produce prices reported earlier in the week. Increases in the cost of shelter, food, and medical care expenses contributed most to the data.

The Conference Board’s probability of a US recession over the next year has spiked to 96%. They have a nice chart showing their projections for the path of US GDP over the next year. However, persistent inflation could push back their projected US recovery into 2024 (and affect the US stock market’s path as well).
Key Question
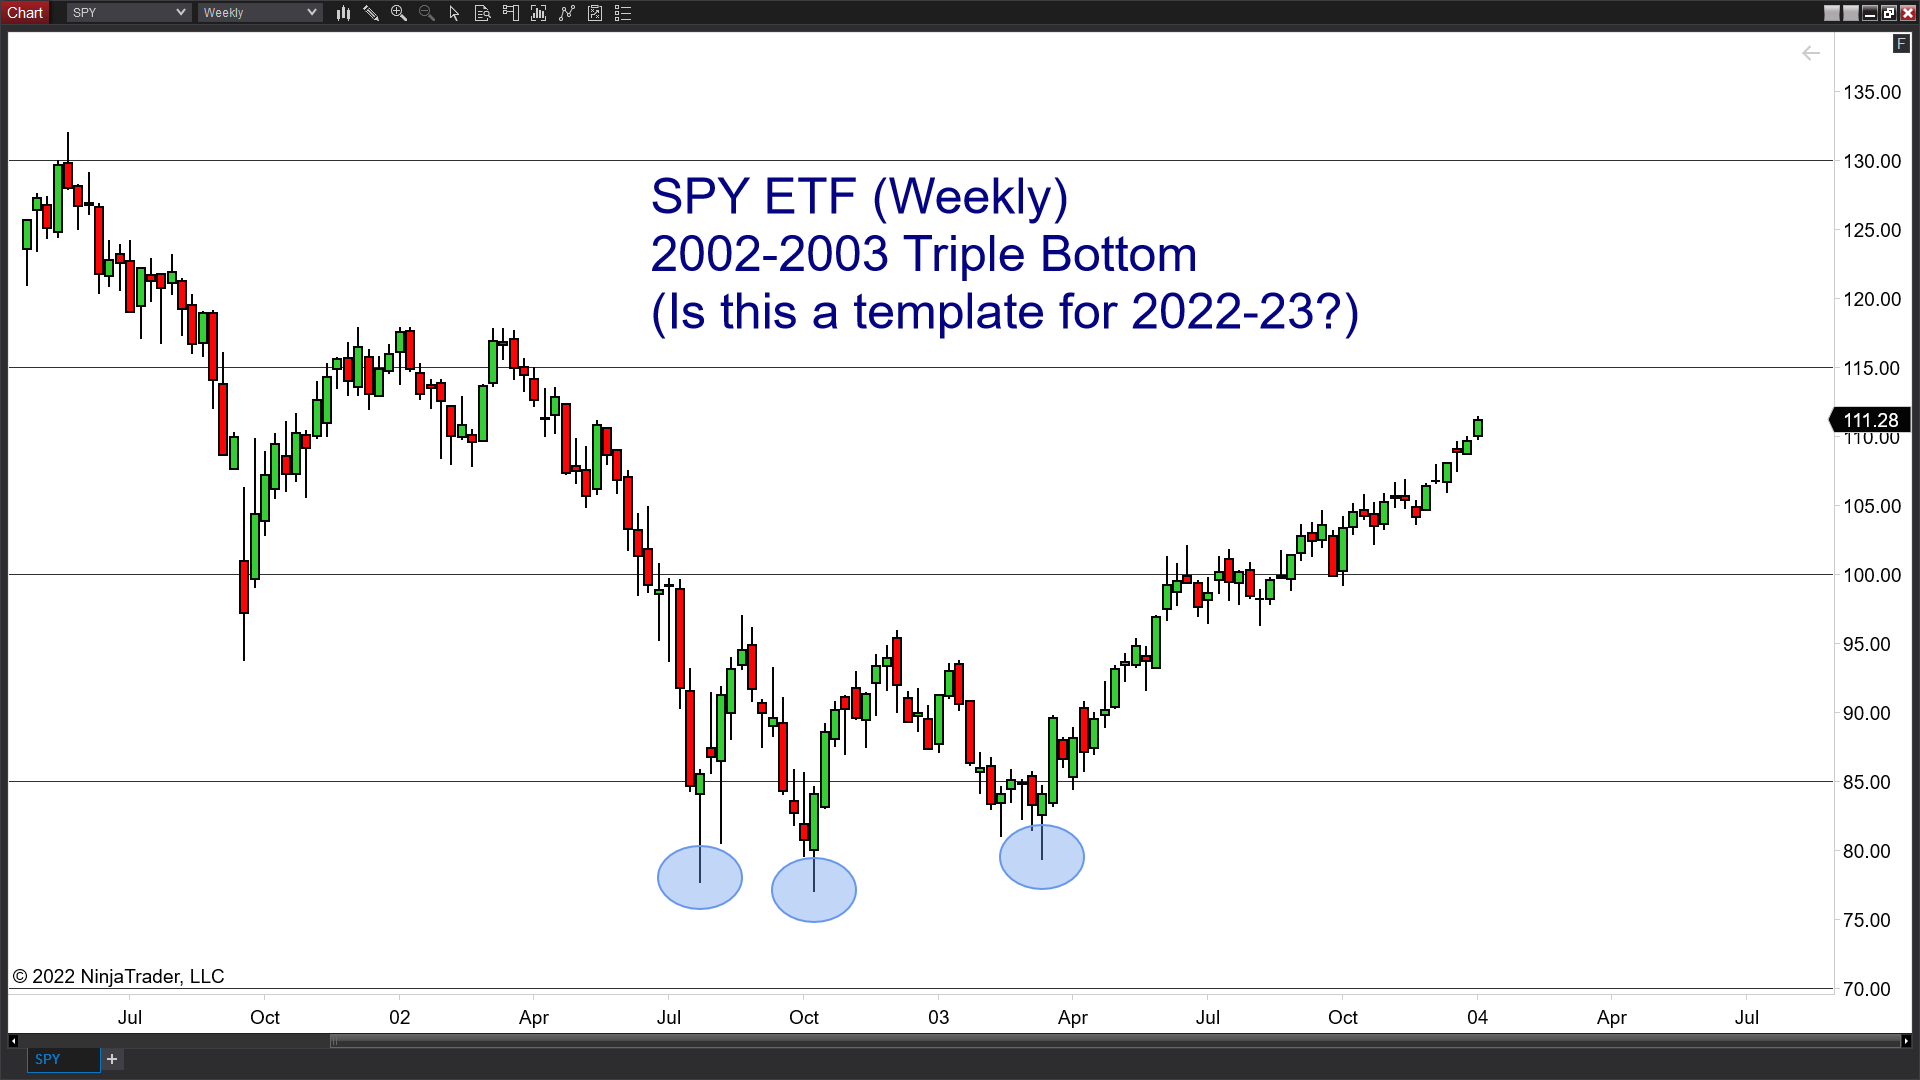
Could Thursday’s rebound be the critical low for the quarter and point to the start of the 4th Quarter bounce? RBC’s Lori Calvasina suggested that the market could form a triple bottom similar to 2002. We explore this question below.
Performance Summary

The markets were weak going into the CPI report, fell sharply after the report, and then reversed with a vengeance. However, US equities did not follow through on Friday partly because of rising 10-year yields. As a result, the sensitive Net Bull/Bear balance was below -60 again this Friday, pointing to further weakness, as it did last week.

The Diversified Trend Index rallied toward -100 on Thursday but closed lower Friday; hence, there is no trend-change signal for the market as a whole.

So objectively, the trend is still down. However, the good news for bulls was that the VIX index did not break through to new highs.
A Triple Bottom?
We begin by acknowledging that we are all data-dependent now, and future inflation data (CPI and PCE) will guide both the market’s and FOMC’s actions. A good summary of the current state of play from the FOMC’s point of view is available via Vice-Chair Lael Brainard here.
One possible evolution is for the FOMC to raise rates in November and December this year, raise it one final time in March next year, and then wait for their actions to take effect. Such a scenario would allow the markets to rally in the fourth quarter, sell off into February and form a bottom in February-March as they did in 2002-2003 and 2008-2009.
So schematically, the rebound might look like my speculative layout below (where the path is of interest, not the price levels.) Depending on incoming inflation data, the price recovery into 2024 could be sluggish or rapid, and the bottom could form after the first quarter of 2023.

Many bear markets made their ultimate lows in October. So, the market could form the second of triple-bottom lows between now and mid-November.
Wrap-up
My posts should give you a good starting point, with context and suggestions if you like to research. Then, you can visit my website, chandeindicators.com, for more information and ideas. I hope you stay tuned and help by subscribing and recommending it to your friends and colleagues.
Thank you for spending some time with me.
Disclaimer
And now for some housekeeping. This publication is for “edutainment,” education, and entertainment, not for investment advice. Past performance is not necessarily indicative of future results. Our disclaimer at chandeindicators.com is included herein by reference.