

Room for Optimism
Room for Optimism
After a horrible six months, can the markets rebound?

Overview
The Personal Consumption Expenditures Price Index (PCE) report from the Bureau of Economic Analysis today showed the index up 6.3% from last May (in line with the Cleveland Fed forecast we pointed to last week).
The PCE excluding food and energy came in at 4.7%, which continued a recent downward trend (see below).

The FOMC’s favorite inflation gauge, the PCE less food and energy, declined for the third consecutive month. (Data from BEA.)
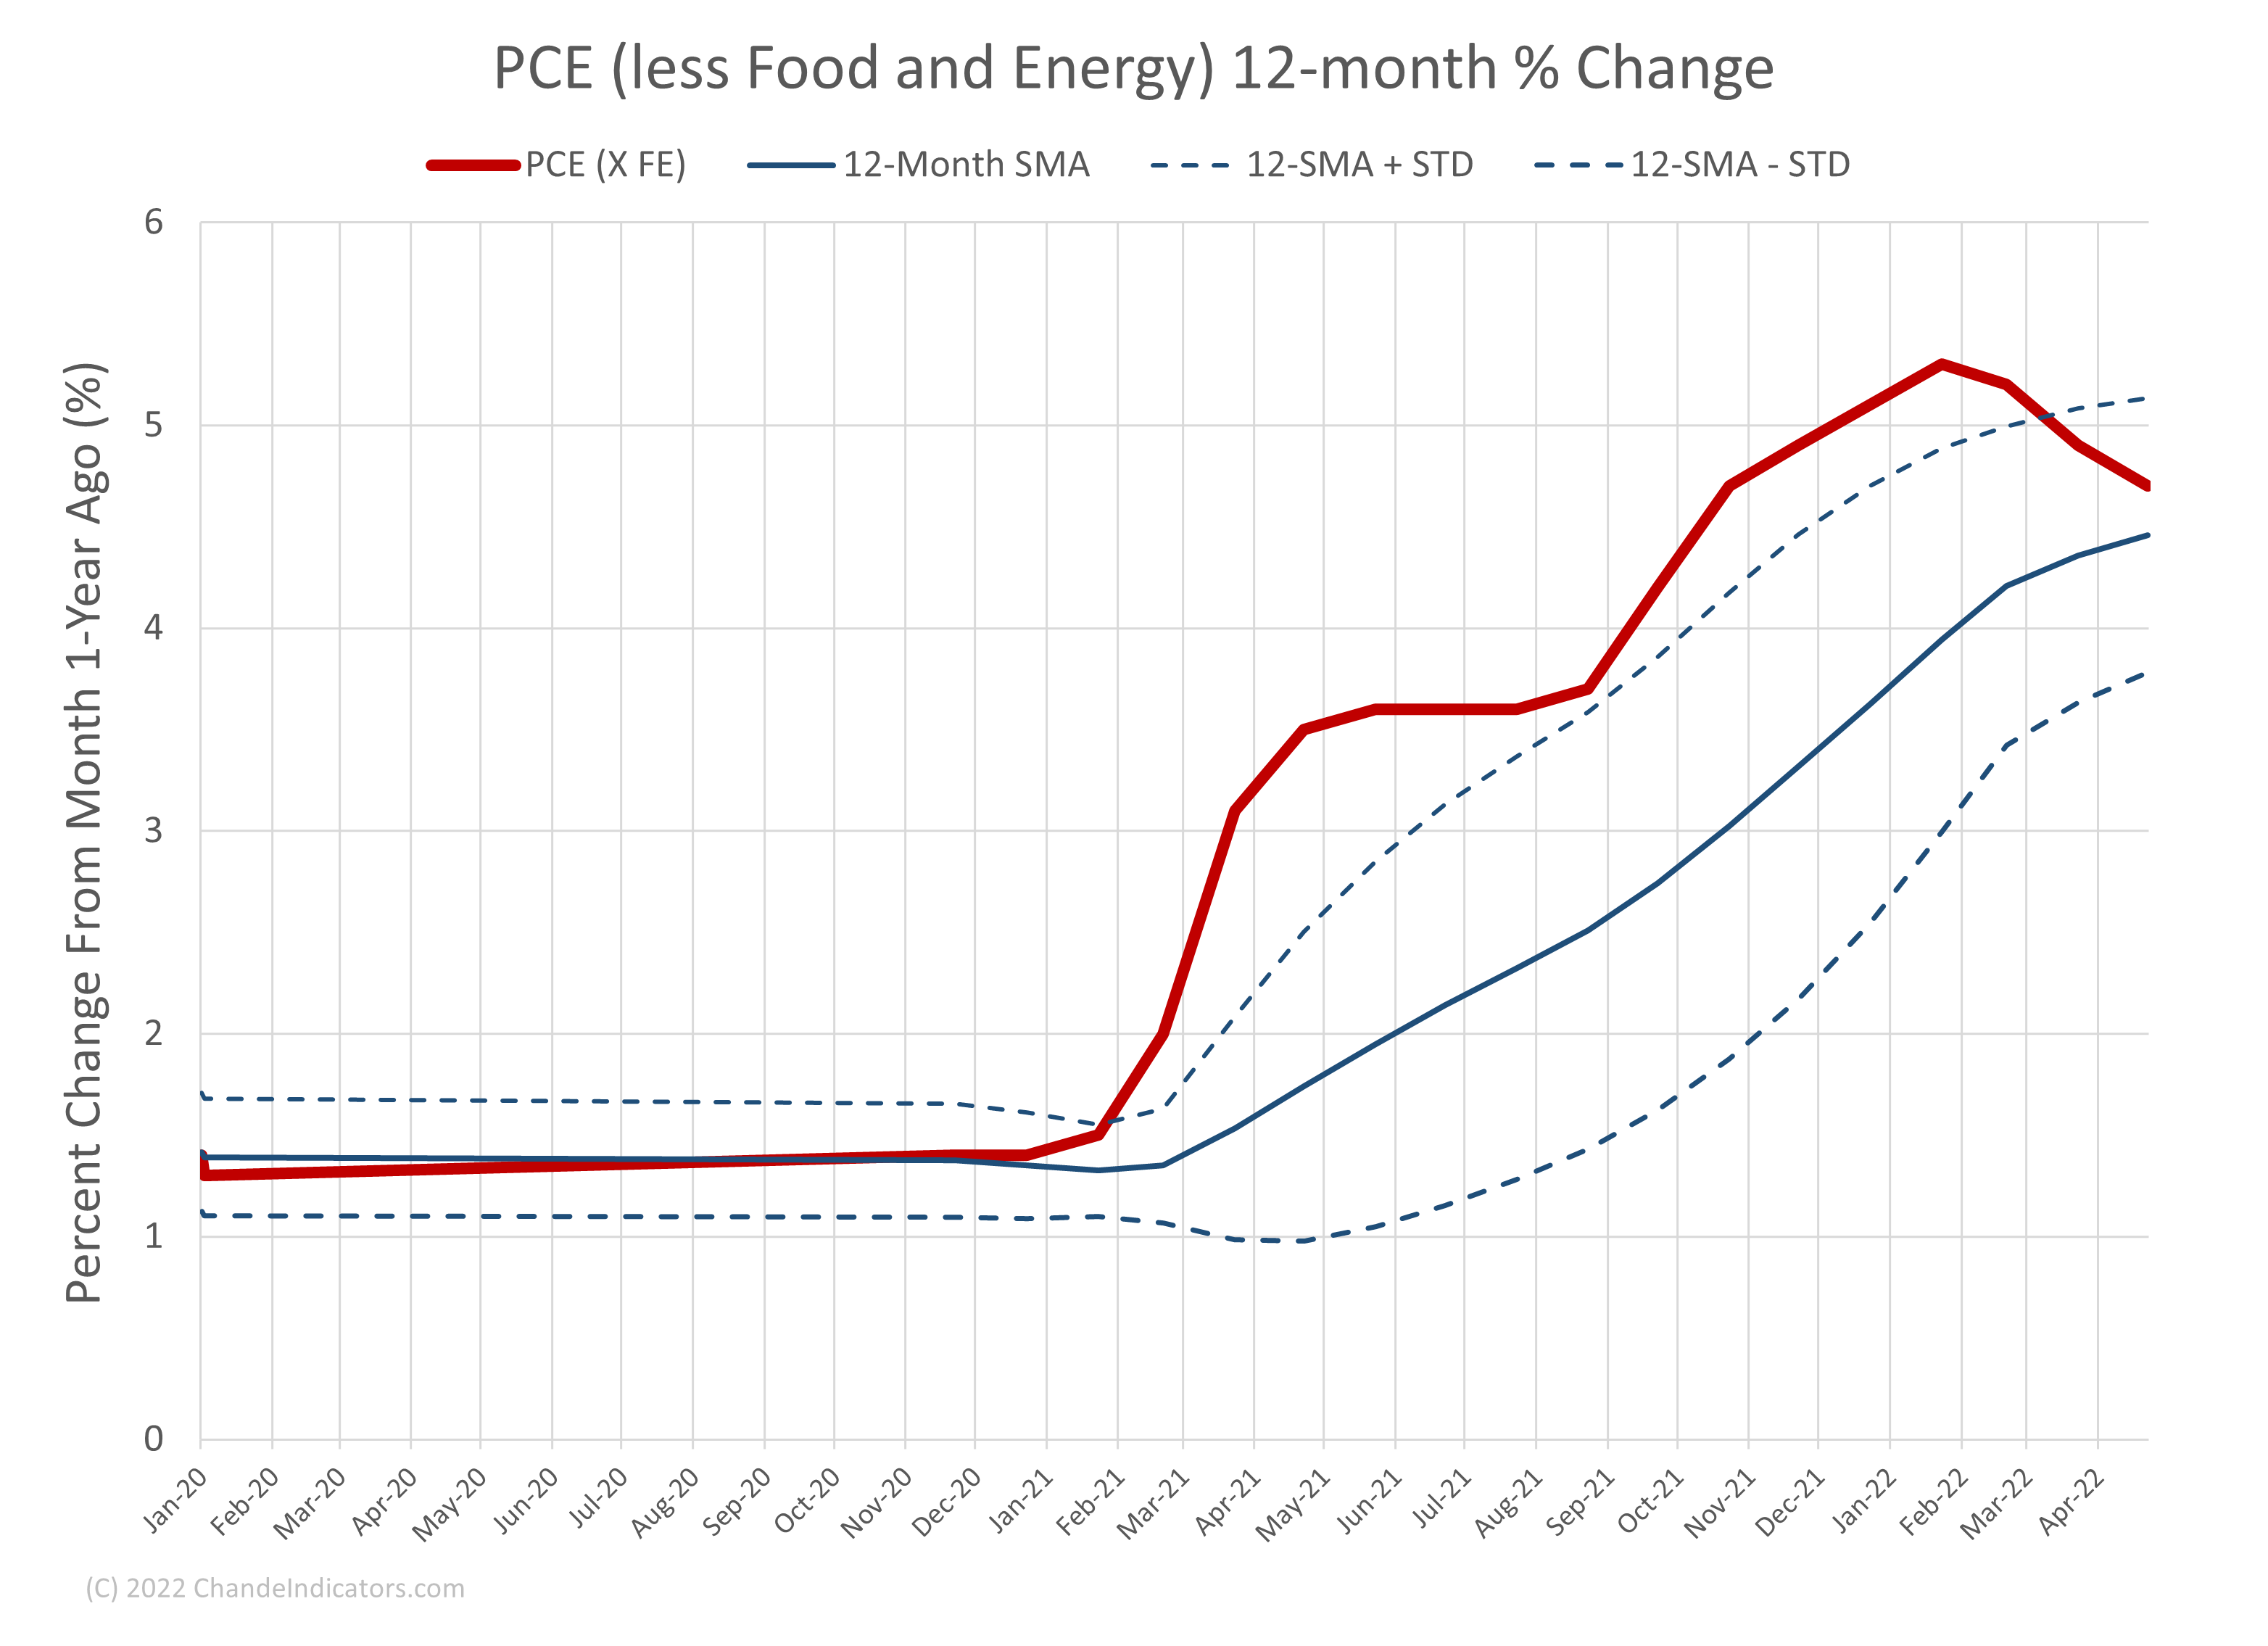
Interest rates declined in June, along with futures contracts for grains and energy. These declines will take a few months to seep into the PCE and Consumer Price Index (CPI), but the inflation data will probably get incrementally better.
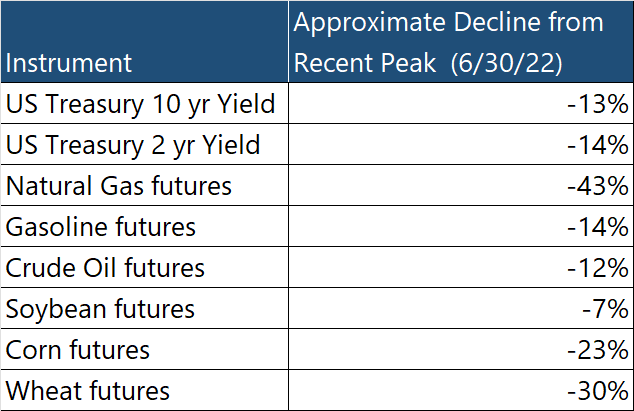
The decline in factors driving inflation is a reason for optimism for the year's second half. But, of course, the two significant wild-cards are the Ukraine invasion and the COVID-19 pandemic and its effects later this Fall, both globally and in China.
Key Question:
We ask, where are the trends? One of the sectors highlighted below is a bit of a surprise.
Performance Review
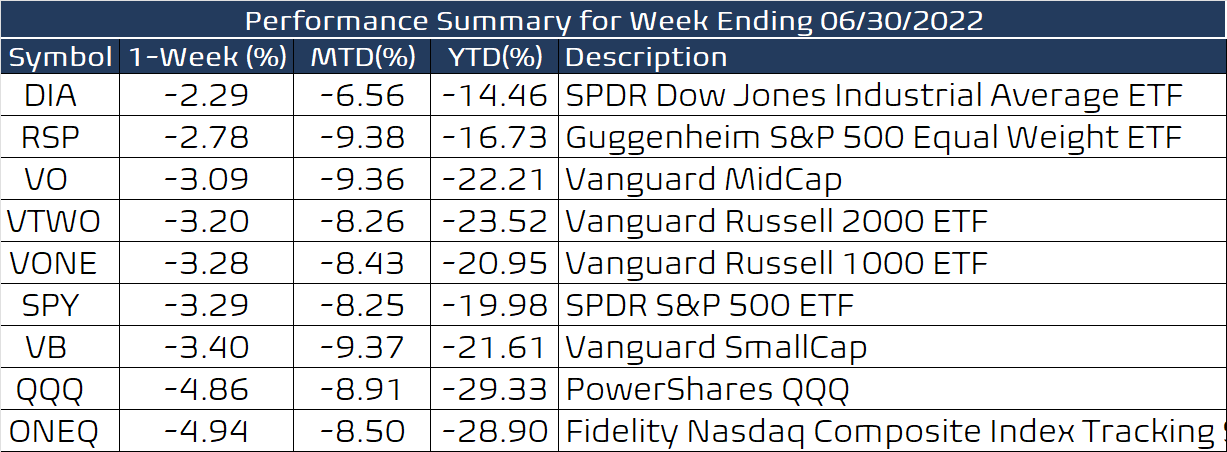
The market ended perhaps its worst first half of the year since 1970. The S&P-500 is down 20%, and technology is doing much worse. As we have discussed for many weeks, we are dependent on inflation data, with a 75-bp rate hike already scheduled for the FOMC meeting at the end of July. So we may have to wait till the end of September for a better handle on inflation. (The period between August and October in election years can be volatile, but the average returns are slightly negative for the three months.)
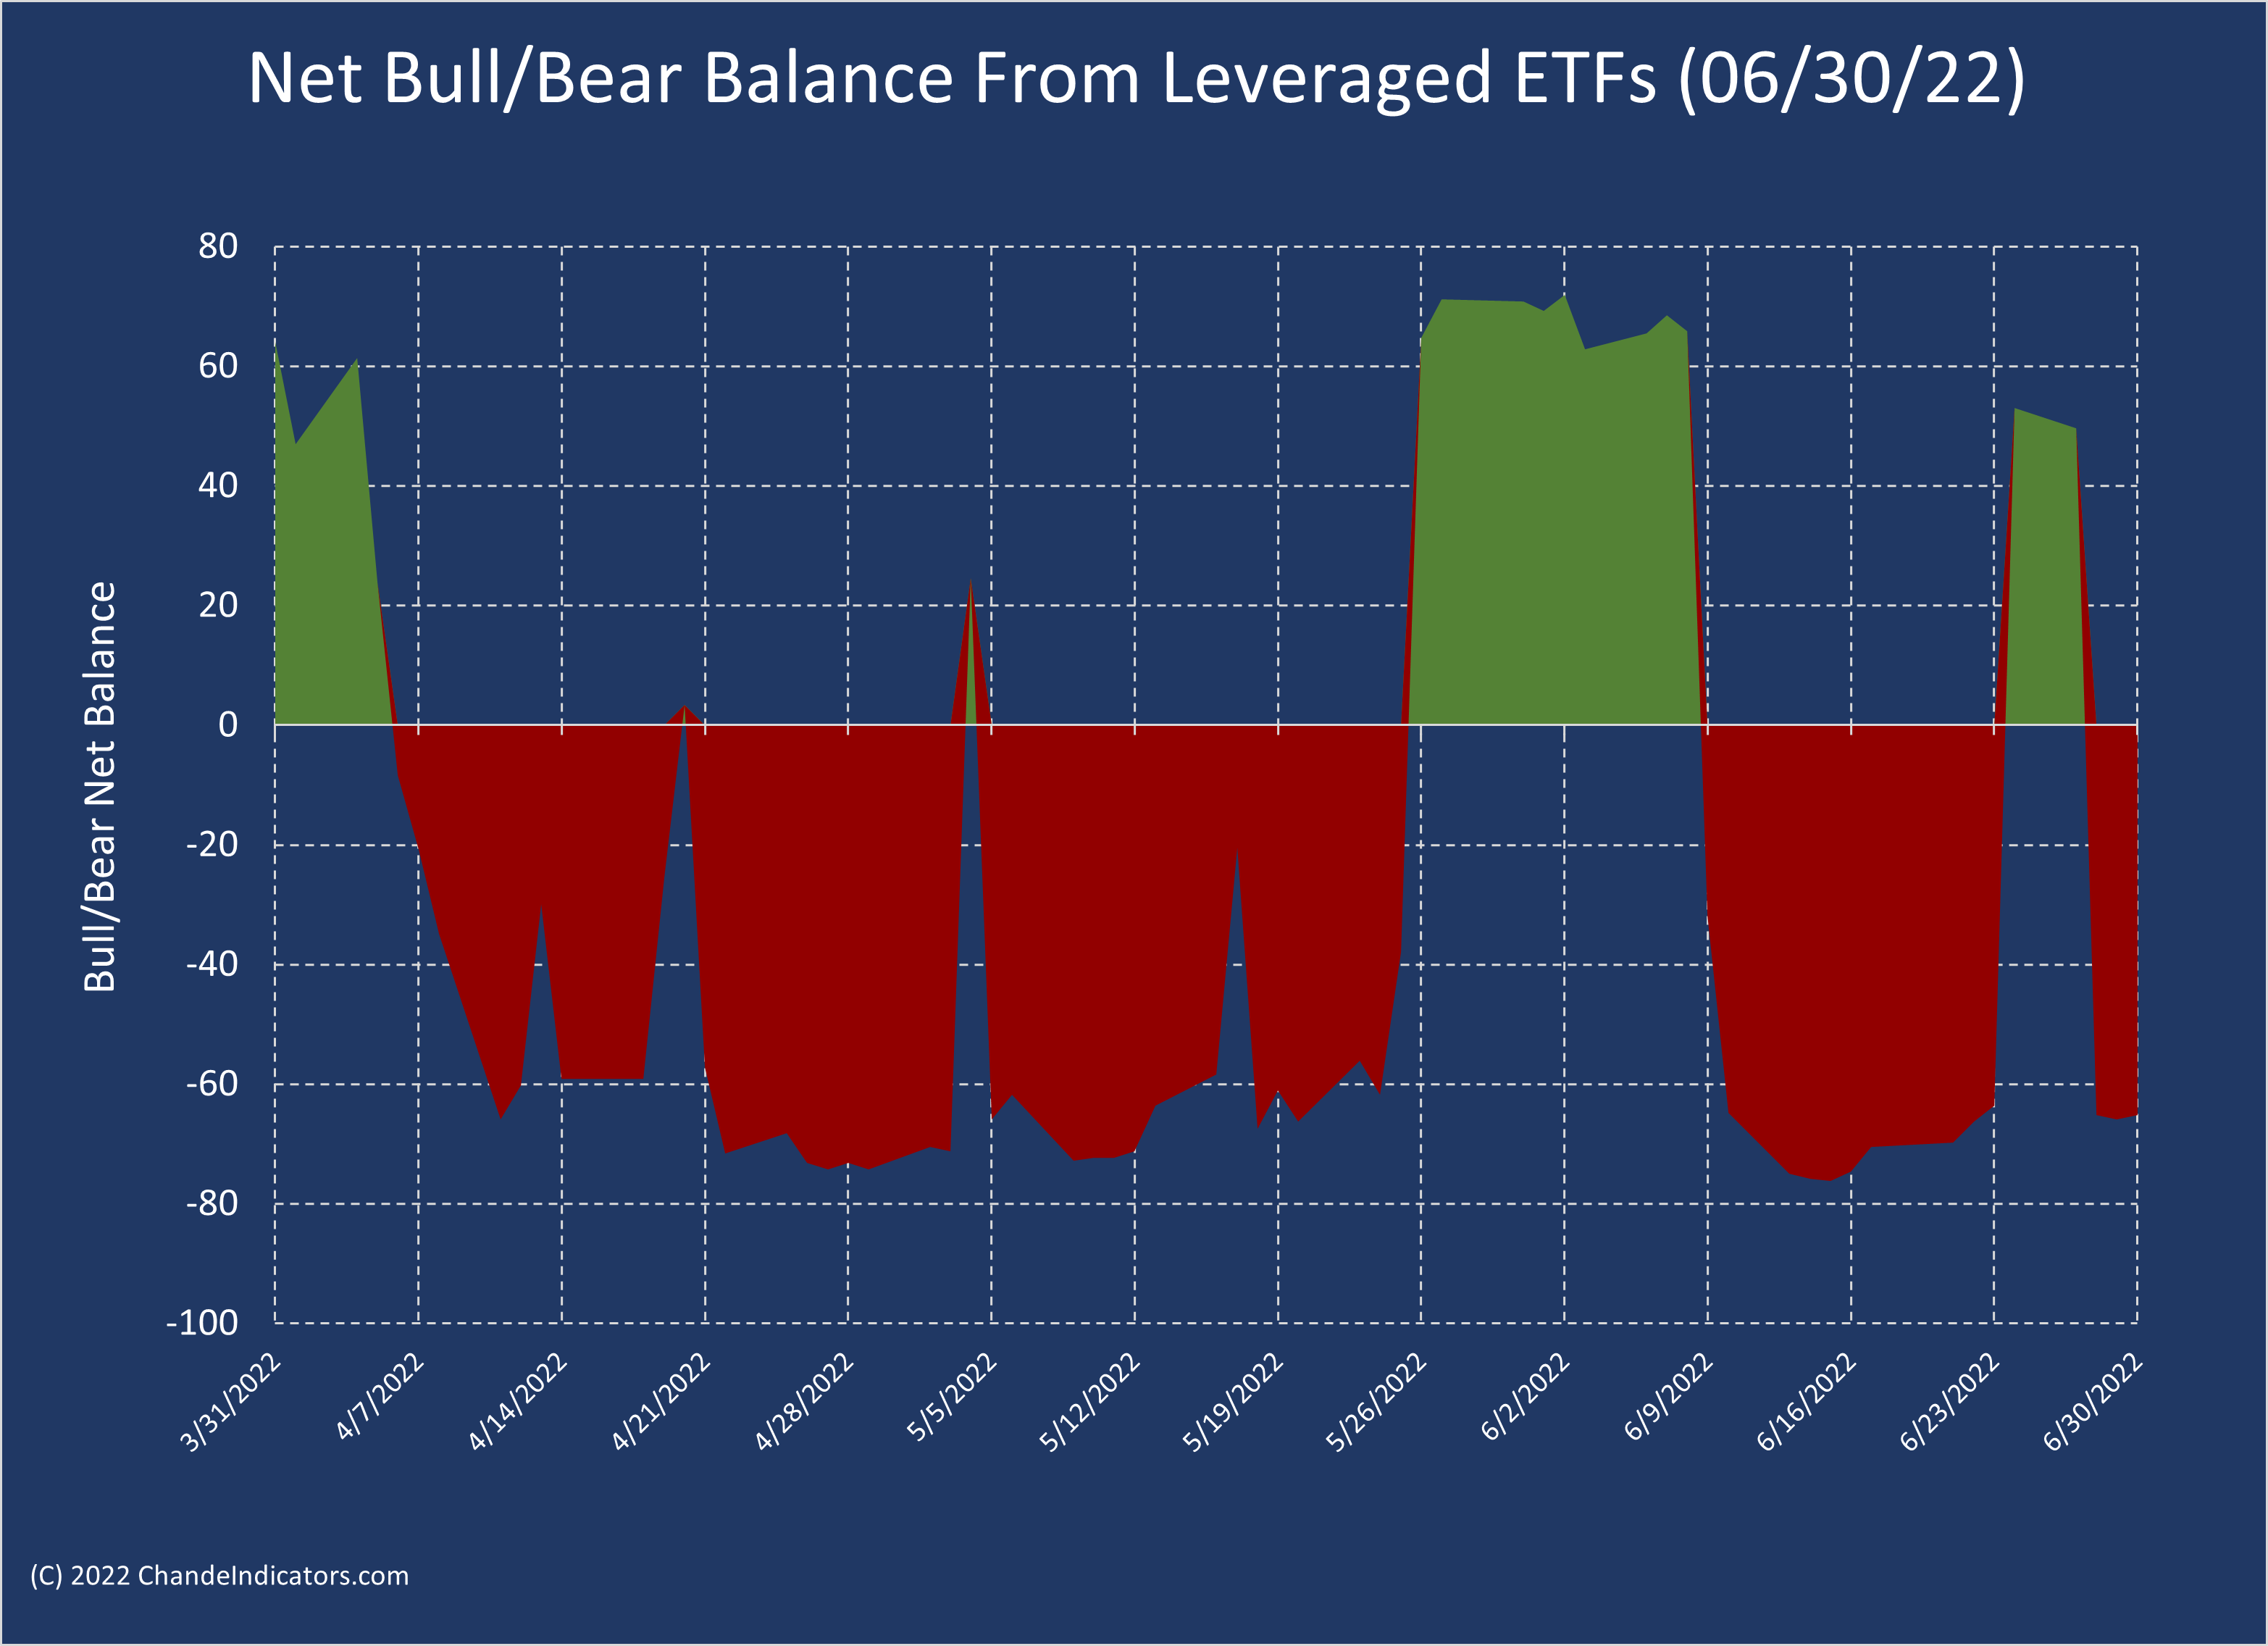
The sensitive net bull/bear balance was positive for two days before turning negative again. (As we noted last week, it was below +50, so we expected market weakness this week.)
Where the Trend Are
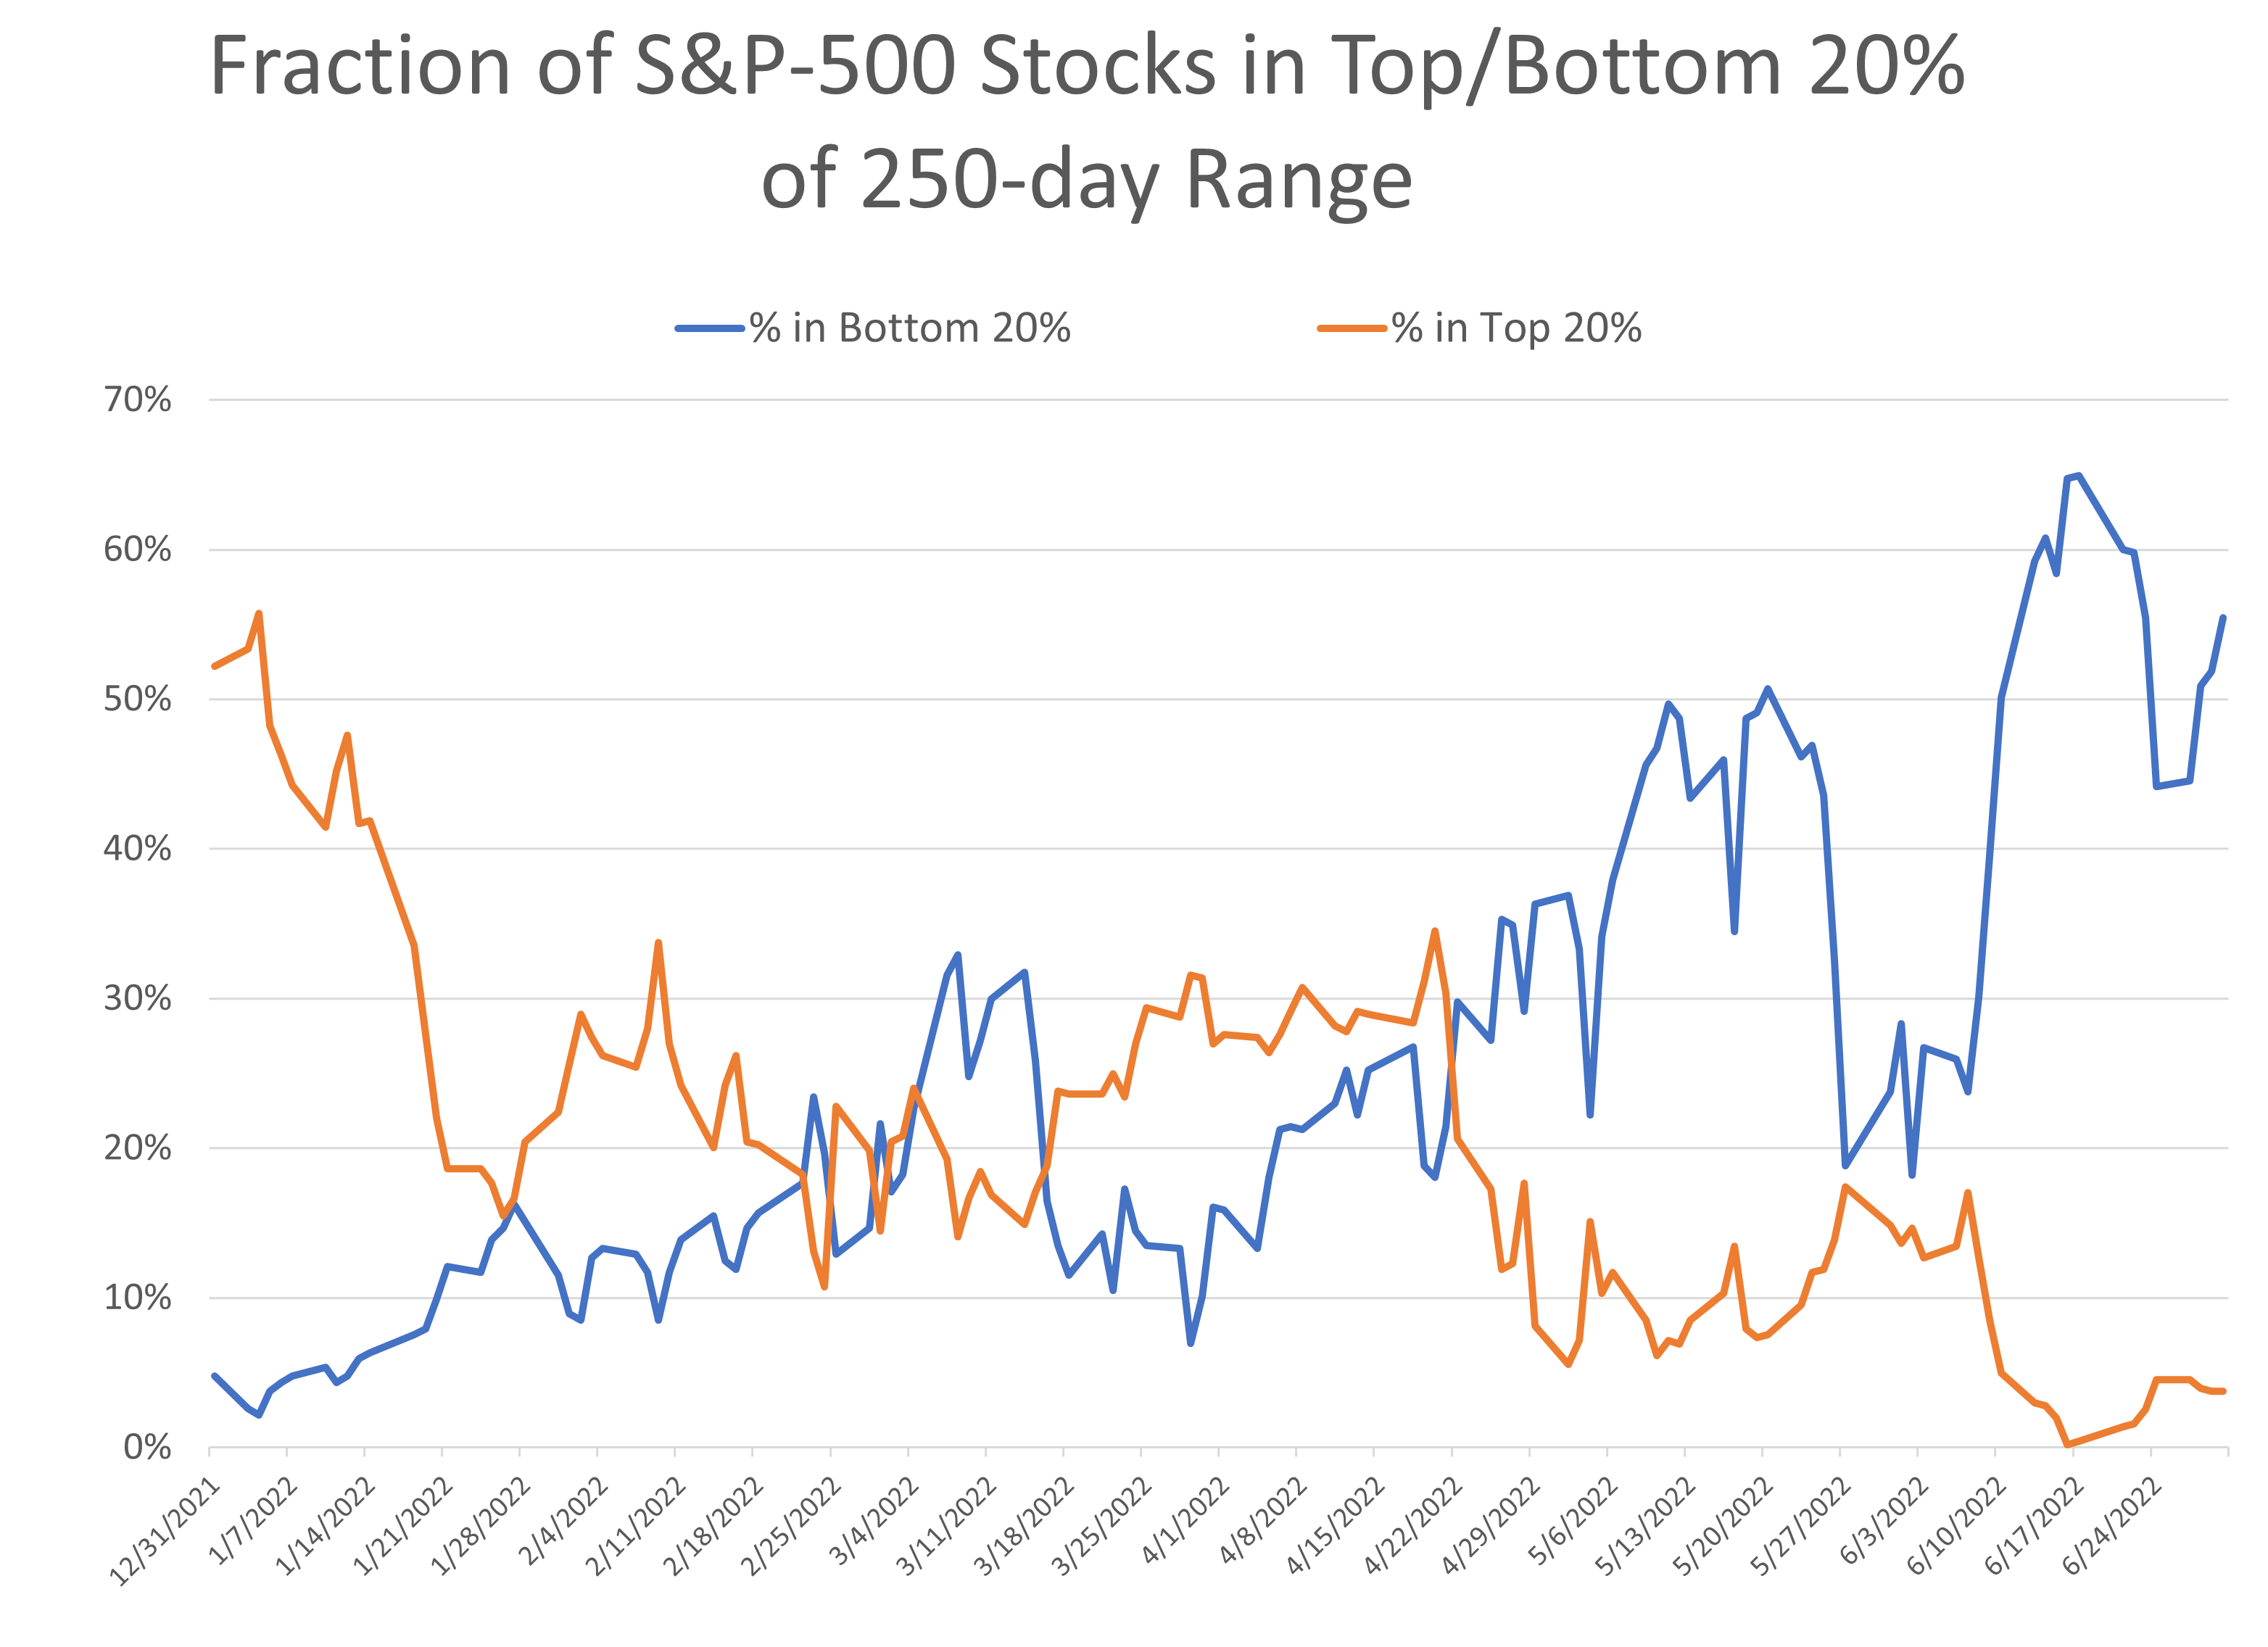
Most 11 groups in the S&P-500 index have a Chande Trend Meter reading under 20, which means they are trending lower. Next, I looked at the proportion of S&P-500 stocks within 20% of their 250-day (one-year) lows (see blue line in the chart below). As is expected, most (more than half) of the stocks are within 20% of their 250-day lows. Fewer than 10% of S&P-500 stocks are within 20% of their 250-day highs (see orange line below). The intense selling in the recent months has caused a lot of technical damage to stock charts.
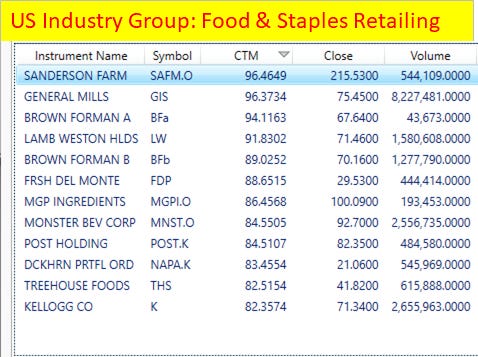
Food and food retailing stocks are a refuge in declining markets, and recently they have gained trend strength. Therefore, I used MetaStock to rank stocks in the Food and Staples Retailing sector using the Chande Trend Meter (CTM) to measure trend strength. For example, Sanderson Farms, General Mills, and Kellogg are defensive holdings and trending well, as shown below.
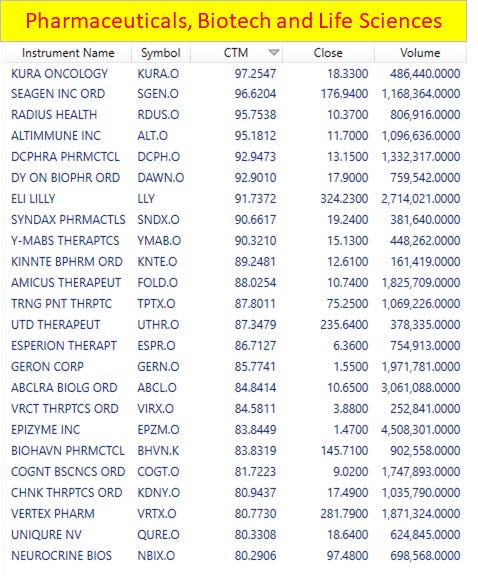
Surprisingly, Pharmaceuticals, Biotechnology, and Life Sciences stocks have also been strong, especially after Merck’s bid for Seagen (see table below).
These data support the view that there’s always a bull market (the Chande Trend Meter can help you find trending stocks).
Wrap-up
I am posting the blog a day earlier this week in light of the holiday weekend.
My posts should give you a good starting point, with context and suggestions if you like to research. Then, you can visit my website, chandeindicators.com, for more information and ideas. I hope you stay tuned and help by subscribing and recommending it to your friends and colleagues.
Thank you for spending some time with me.
Disclaimer
And now for some housekeeping. This publication is for “edutainment,” education, and entertainment, not for investment advice. Past performance is not necessarily indicative of future results. Our disclaimer at chandeindicators.com is included herein by reference.