

Market Sets Key Low
Market Sets Key Low
We look ahead using a statistical analysis of S&P-500 returns after a loss in January.

Overview
As I expected last week, the S&P-500 set a key spike low on Monday (and the VIX index made a surge high). However, despite the choppy price action since then, the S&P-500 has held above its Monday low, implying the formation of a key low.
The FOMC meeting released a dovish statement Wednesday, but the subsequent Powell Q&A session seemed more hawkish. The FOMC did not lay out a specific path for raising rates and managing the runoff of its balance sheet. However, it indicated the economy is strong enough to support the steady removal of policy accommodation.
Some fear the FOMC is moving too slowly, and others feel it may move too fast, and hence we have an increase in market volatility.
The Russian threats against Ukraine also add to the market’s worries, but the Ukrainians themselves seem quite chill about it.
As a contrary indicator, individual investor sentiment is reaching bearish extremes that, in the past, have been a prelude to reversals in the market.

Key Question
This is the worst January in the history of S&P-500 declines. Since much about the path of interest rates is unknown, traders are free to fear the worst. So I will look past the current market action and look to history to understand what might happen.
Performance Summary
I expected last week to see additional selling leading to a surge in the VIX and a spike bottom, followed by some stabilization after the FOMC meeting. That is exactly what unfolded, though the month-to-date (MTD) losses in the table below tell the story better than I can.

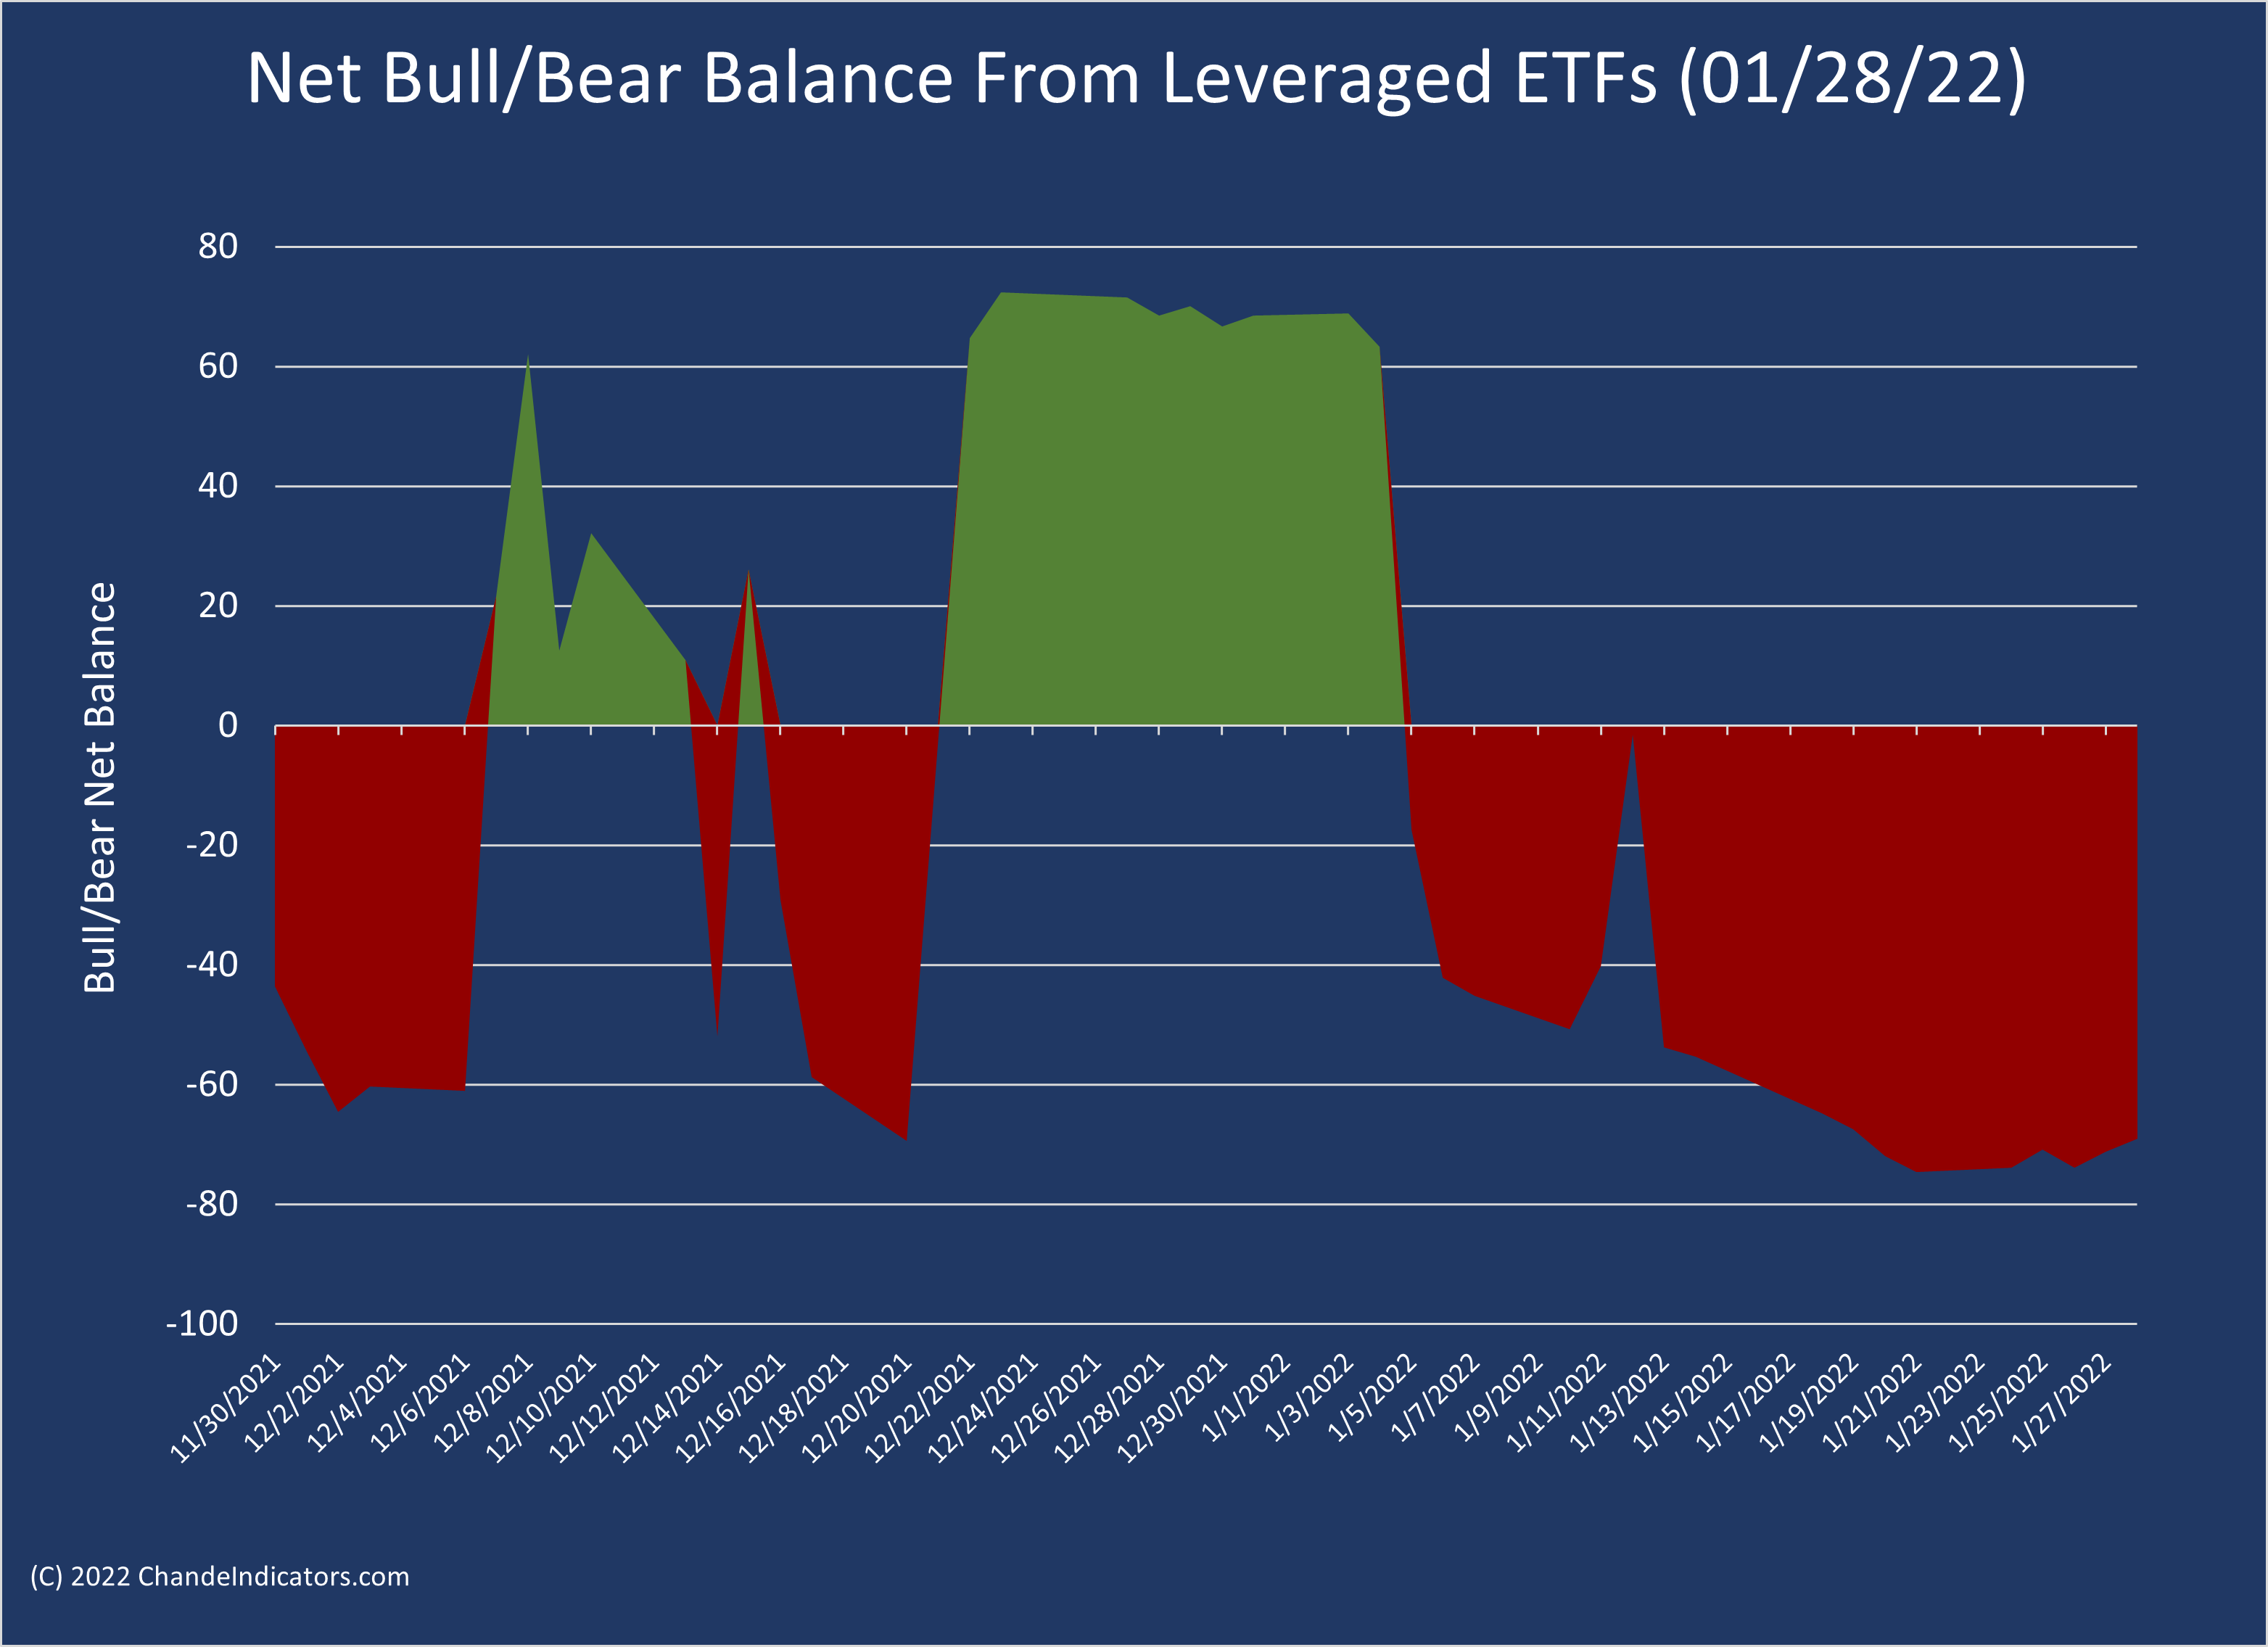
Our sensitive net bull-bear balance remains solidly negative, as it has since Jan 5th. There may be a hint of an uptick on Friday, but the overall short-term trend is still bearish.
The Dreaded January Declines
Yale Hirsh’s Stock Traders Almanac originally (1967) popularized the January Barometer, which suggested that the S&P-500 performance in January could predict the performance for the entire calendar year. Moreover, the data suggest that a losing month in January is “often” followed by weak or even negative returns for the remainder of the calendar year. We explore these ideas in greater detail below, looking at the downside risk and reward. We then extend the analysis to understand the implications of negative returns over January and February combined and the performance over a two-year period (instead of just one year).
Here we look at S&P-500 monthly data since 1950 without worrying about which year it is in the presidential cycle or the magnitude of the changes in January. The dataset is sufficiently long to make decent estimates of probabilities, but the analysis does not guarantee any particular outcome.
Here is the overall summary in a tabular format. First note that the probability of a losing year after gains in January is only 12%, but if there is a loss in January, then the probability of a losing year rises to 48%.
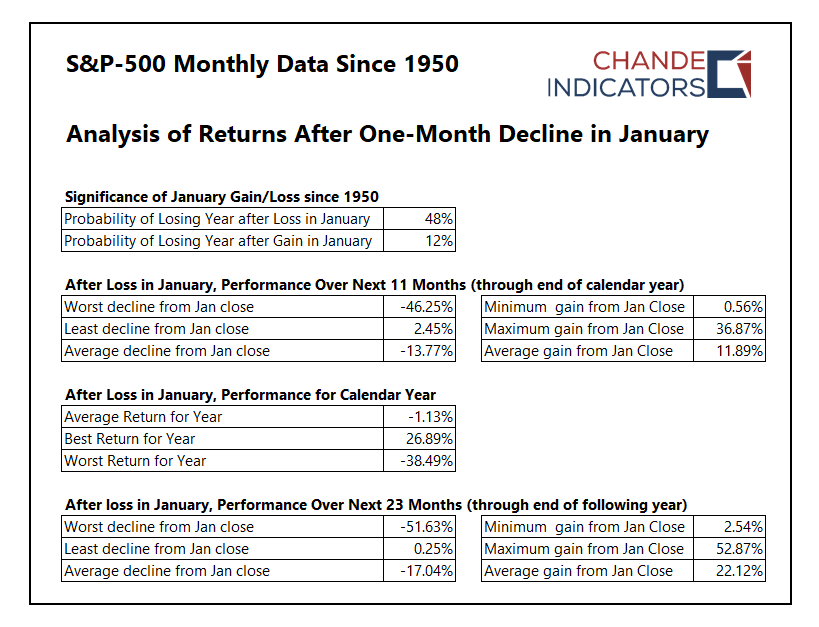
We next look at the performance over the next 11 months after a loss in January, using the monthly January closing price as the reference. The average decline from the January close was -13.77%, with the worst-case exceeding -46%, which means additional selling usually follows January declines. On the other hand, the average gain from the January close (to the highest high over the next 11 months) was 11.89%, which implies that the markets tend to bounce a bit after the January losses.
For a better perspective, I extended the analysis window to 23 months or the end of the following year. In every instance, the gain to the next highest high from the January close was positive and averaged 22%. So, in every instance, the market subsequently exceeded the January close, often by substantial margins.
There is a large variation in the range of subsequent returns, whether gains or losses. For example, the chart below shows the return from January close to the lowest low in the subsequent 11 months in the S&P-500 data since 1950 (after a loss in January). About 55% of the subsequent declines were worse than -10%, giving you a sense of the potential for additional downside risk.

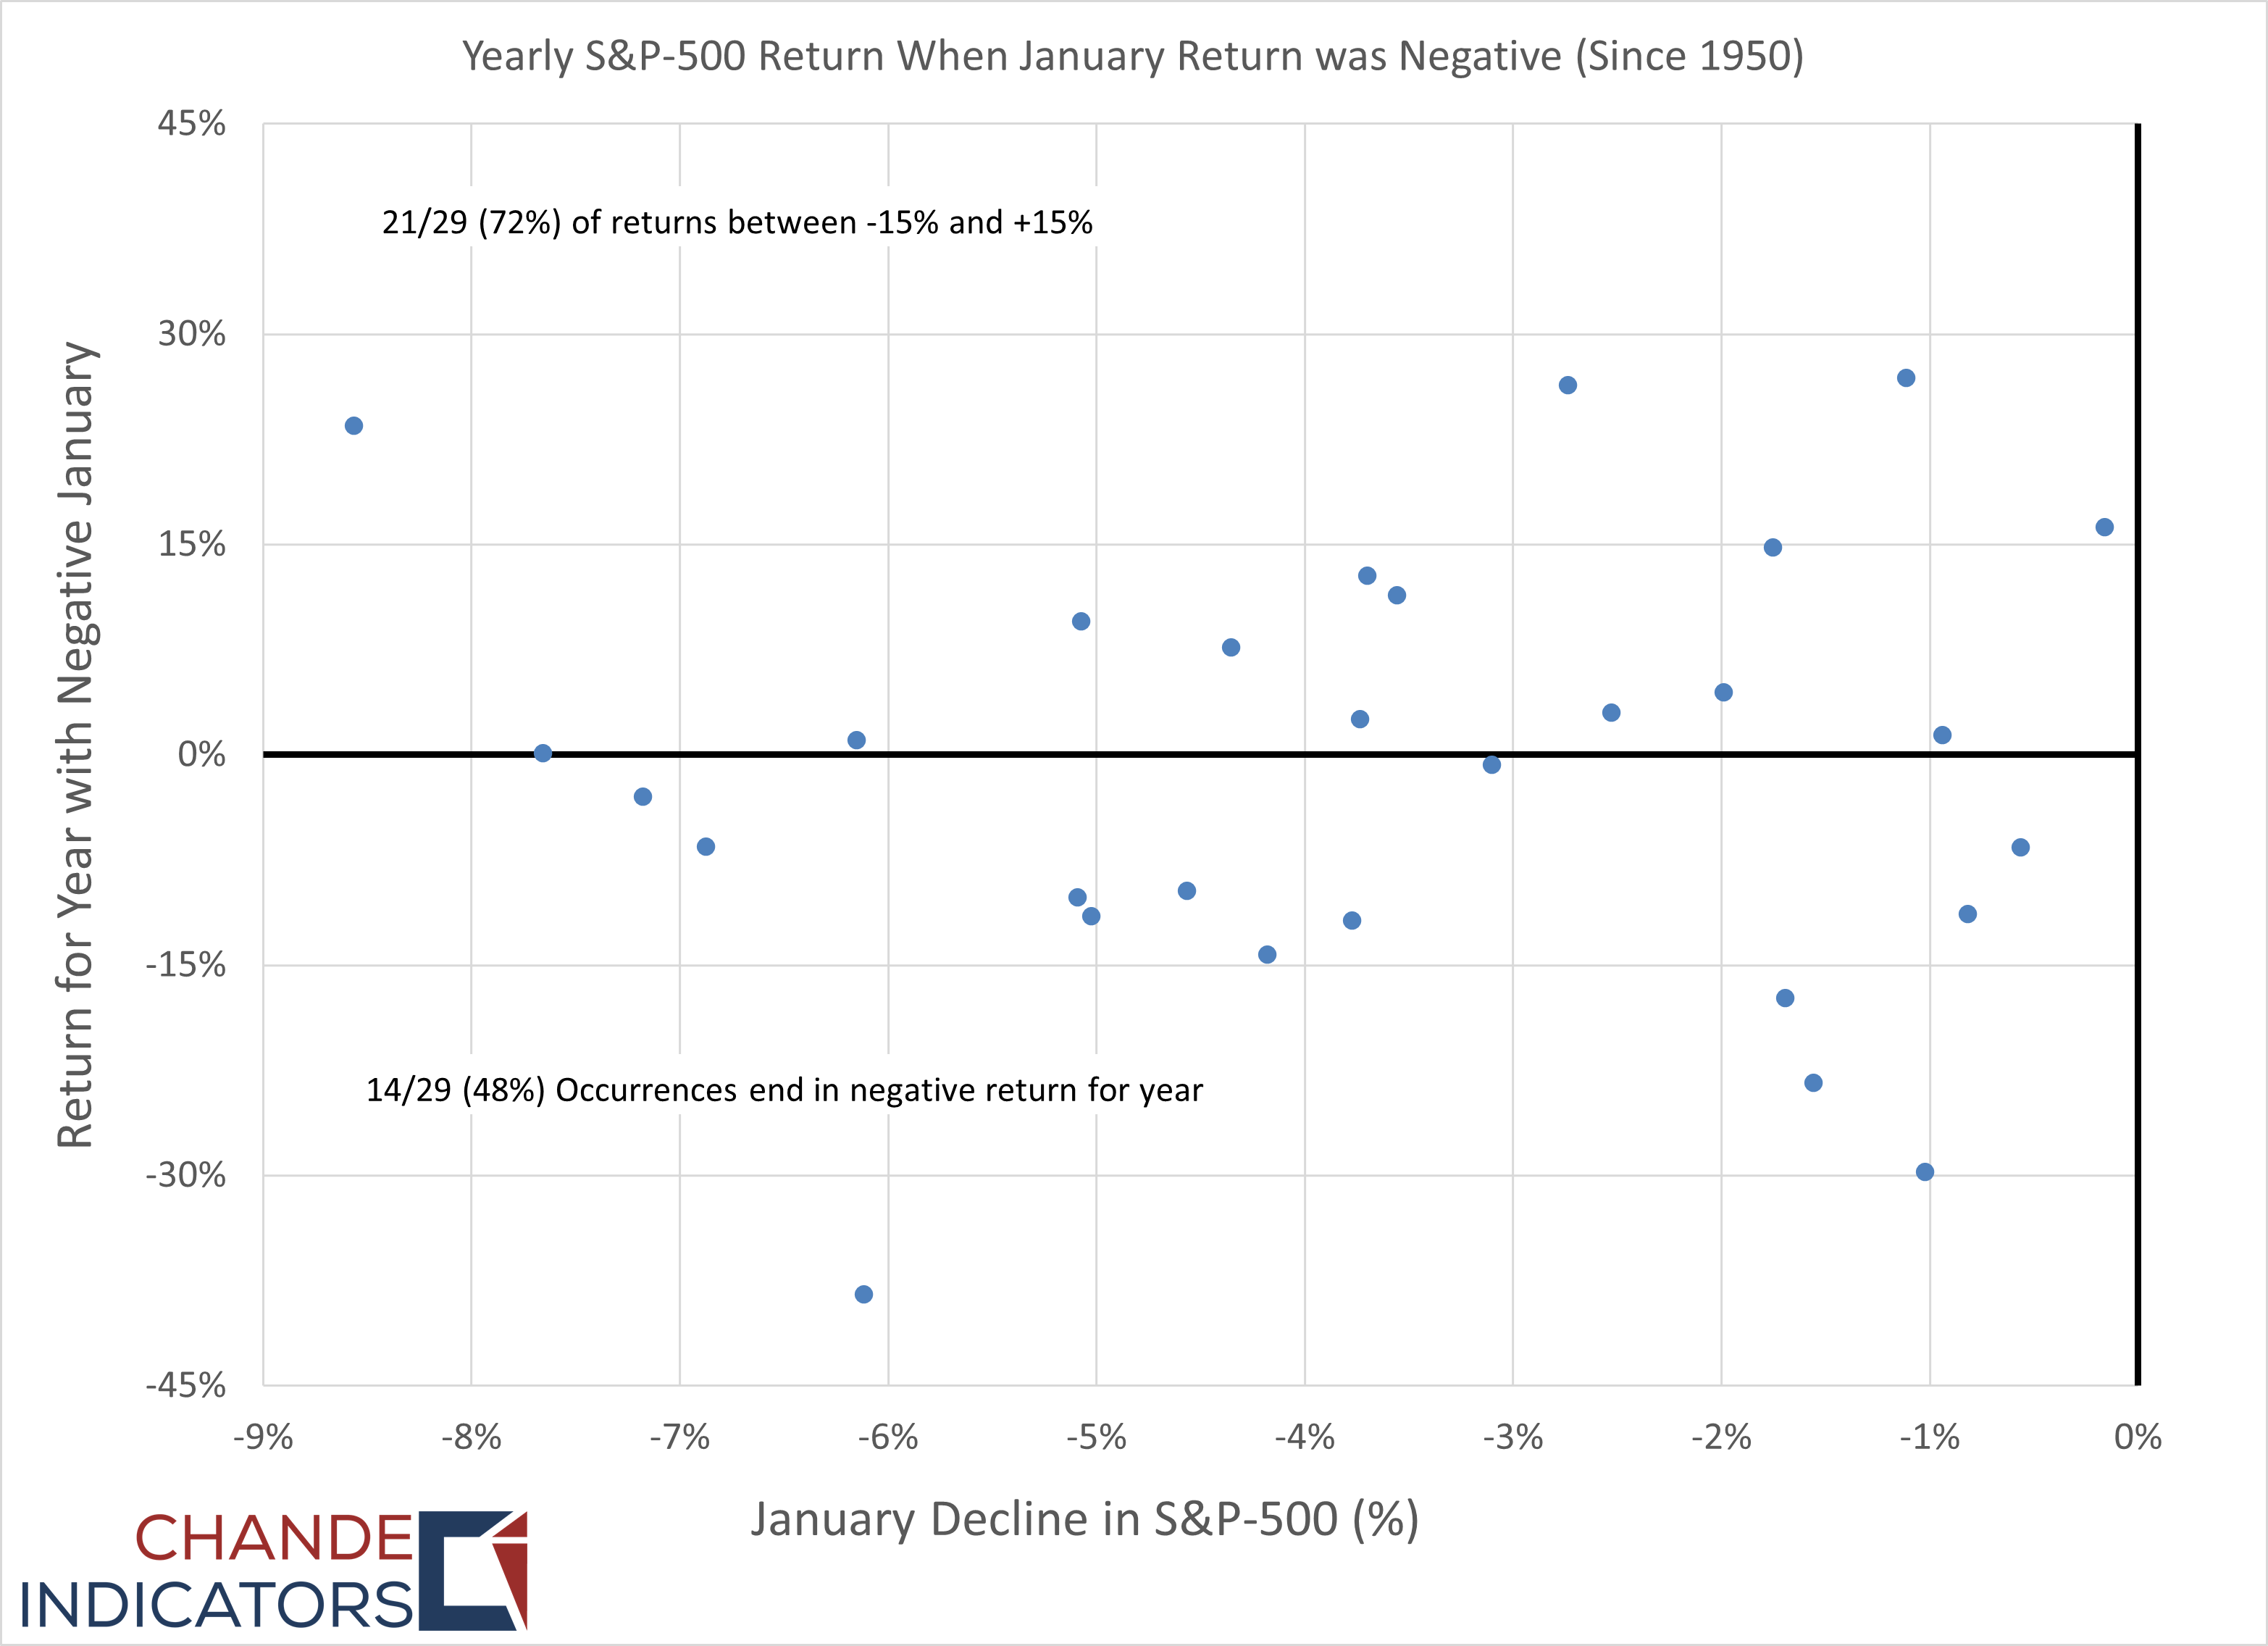
The chart below shows the calendar year returns for those years that had a loss in January. The data are about evenly divided between positive and negative returns. The probability of a losing calendar year after a losing month in January is about 50% (which is substantially greater than the same probability when the market has a positive return in January).
We expand our time window by 23 months to look at the returns through the end of December for the following year (after the market has a losing month in January). The idea is that the market has more time to recover from whatever drove the negative returns in January. The returns are measured from January close to the highest high over the next 23 months. The good news is that the market gains were positive in every instance, implying that the market exceeded the January close over the next 23 months.

The next logical question is to ask what the performance would look like if we had a two-month losing period at the start of the year, i.e., the January+February returns were negative (see table below).
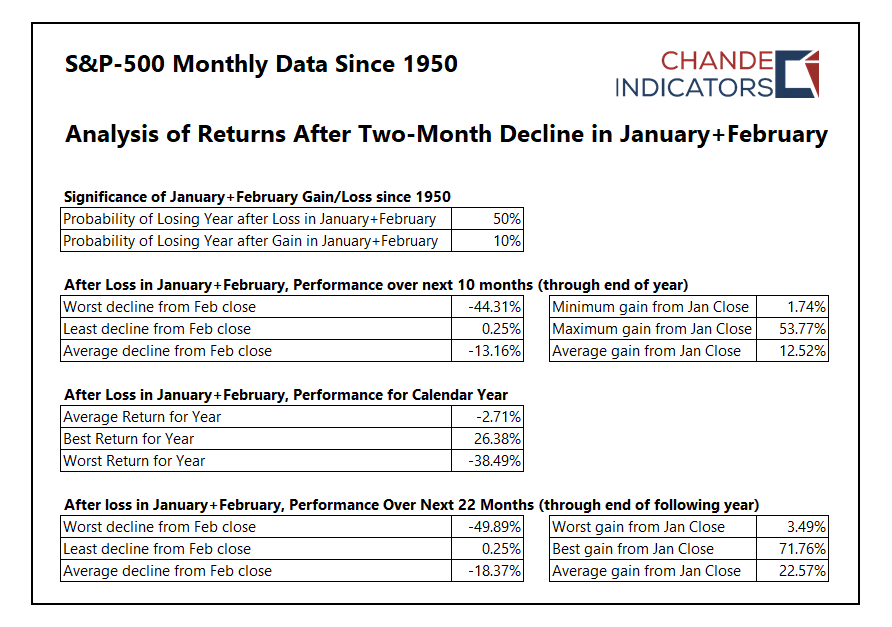
The average return for the remaining ten months of the year is slightly worse (-2.7%), though the performance through the end of the following year-end remains positive.
The main implication of this analysis for the long-term investor is that the markets will recover from this month’s sell-off.
Wrap-up
My posts should give you a good starting point, with context and suggestions if you like to do research. Then, you can visit my website, chandeindicators.com, for more information and ideas. I hope you stay tuned and help by subscribing and recommending it to your friends and colleagues.
Thank you for spending some time with me.
Disclaimer
And now for some housekeeping. This publication is for “edutainment,” education, information, and entertainment purposes only. It is not to be construed as investment advice. Past performance is not necessarily indicative of future results. Our disclaimer at chandeindicators.com is included herein by reference.