


Falling Yields Add Volatility, Spur Growth Stocks
Could bond yields go even lower?

Overview
The US 10-year yield fell to 1.25% this week, a marked reversal from earlier this year.
Mega-cap stocks and growth stocks surged to new highs.
Small-cap stocks fell sharply before bouncing late in the week, but they are lagging badly.
Key indexes are diverging a bit from the S&P-500 index.
Key Question:
In an earlier post, we discussed then-rising rates and said, “US 10-year yields face strong technical resistance as they approach 2%”. Rates peaked shortly thereafter and made new lows for the current leg-down. How low could rates go?
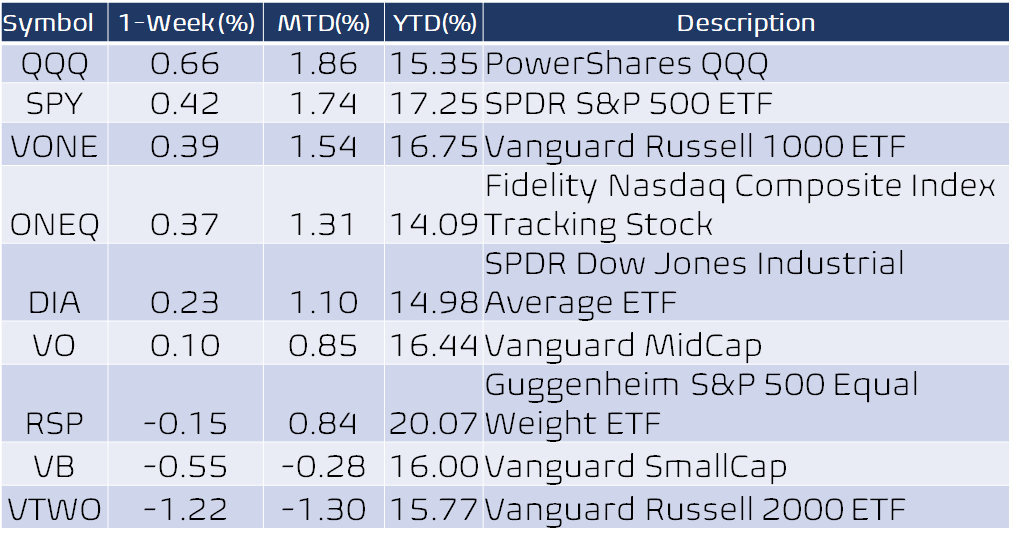
Performance Snapshot
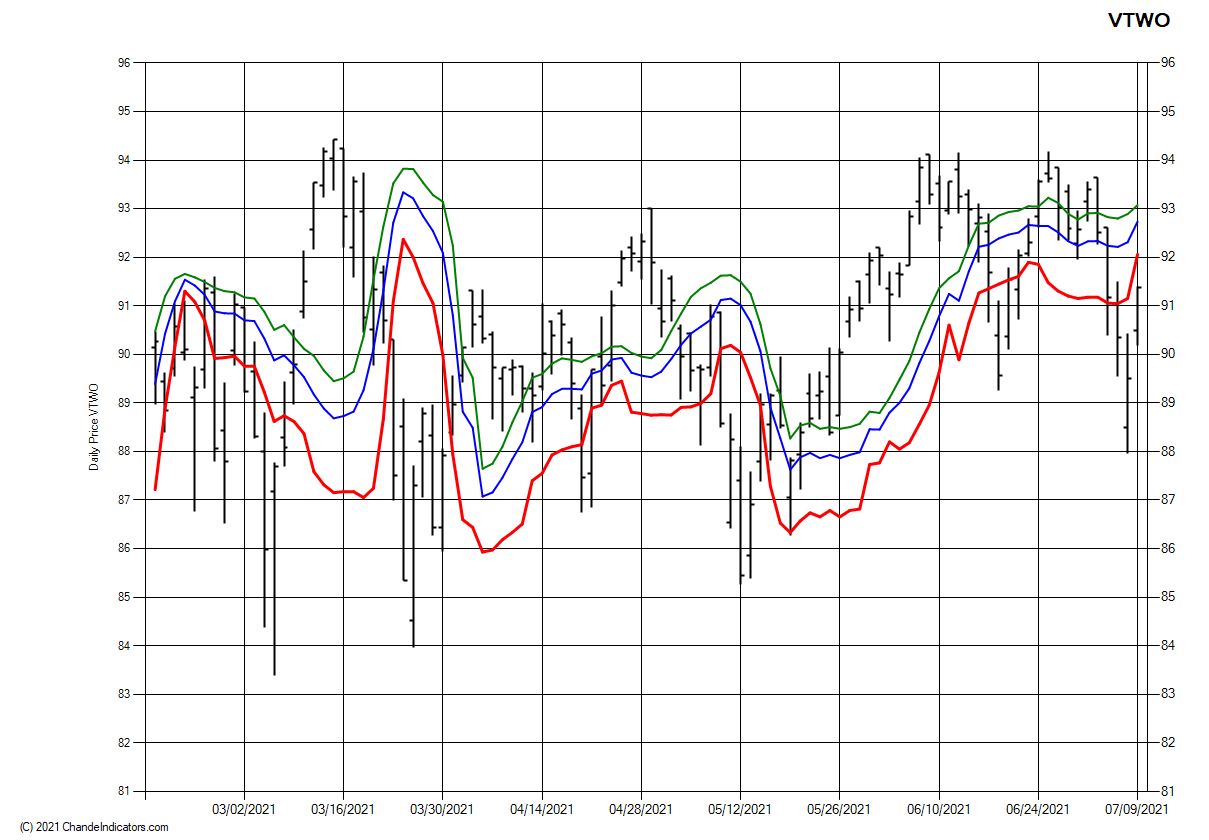
A holiday-shortened week saw some volatility on Thursday before a rebound on Friday. Small-cap stocks are still much weaker than the broad market (as you can see by comparing the charts of VONE to VTWO). For example, the VONE ETF made new highs this week, but the VTWO ETF is approximately 3% below its most recent highest high (from March 15). The Dow Industrials were lagging but caught up nicely this week, though they too have not quite made new highs since May.
We highlight the VTWO chart to show that it dipped below the midpoint of its trading range from about 95-83 on Thursday this week, a sign of weakness. VTWO remains locked in a trading range since mid-March and shows the relatively narrow action in the market led by mega-cap growth stocks.
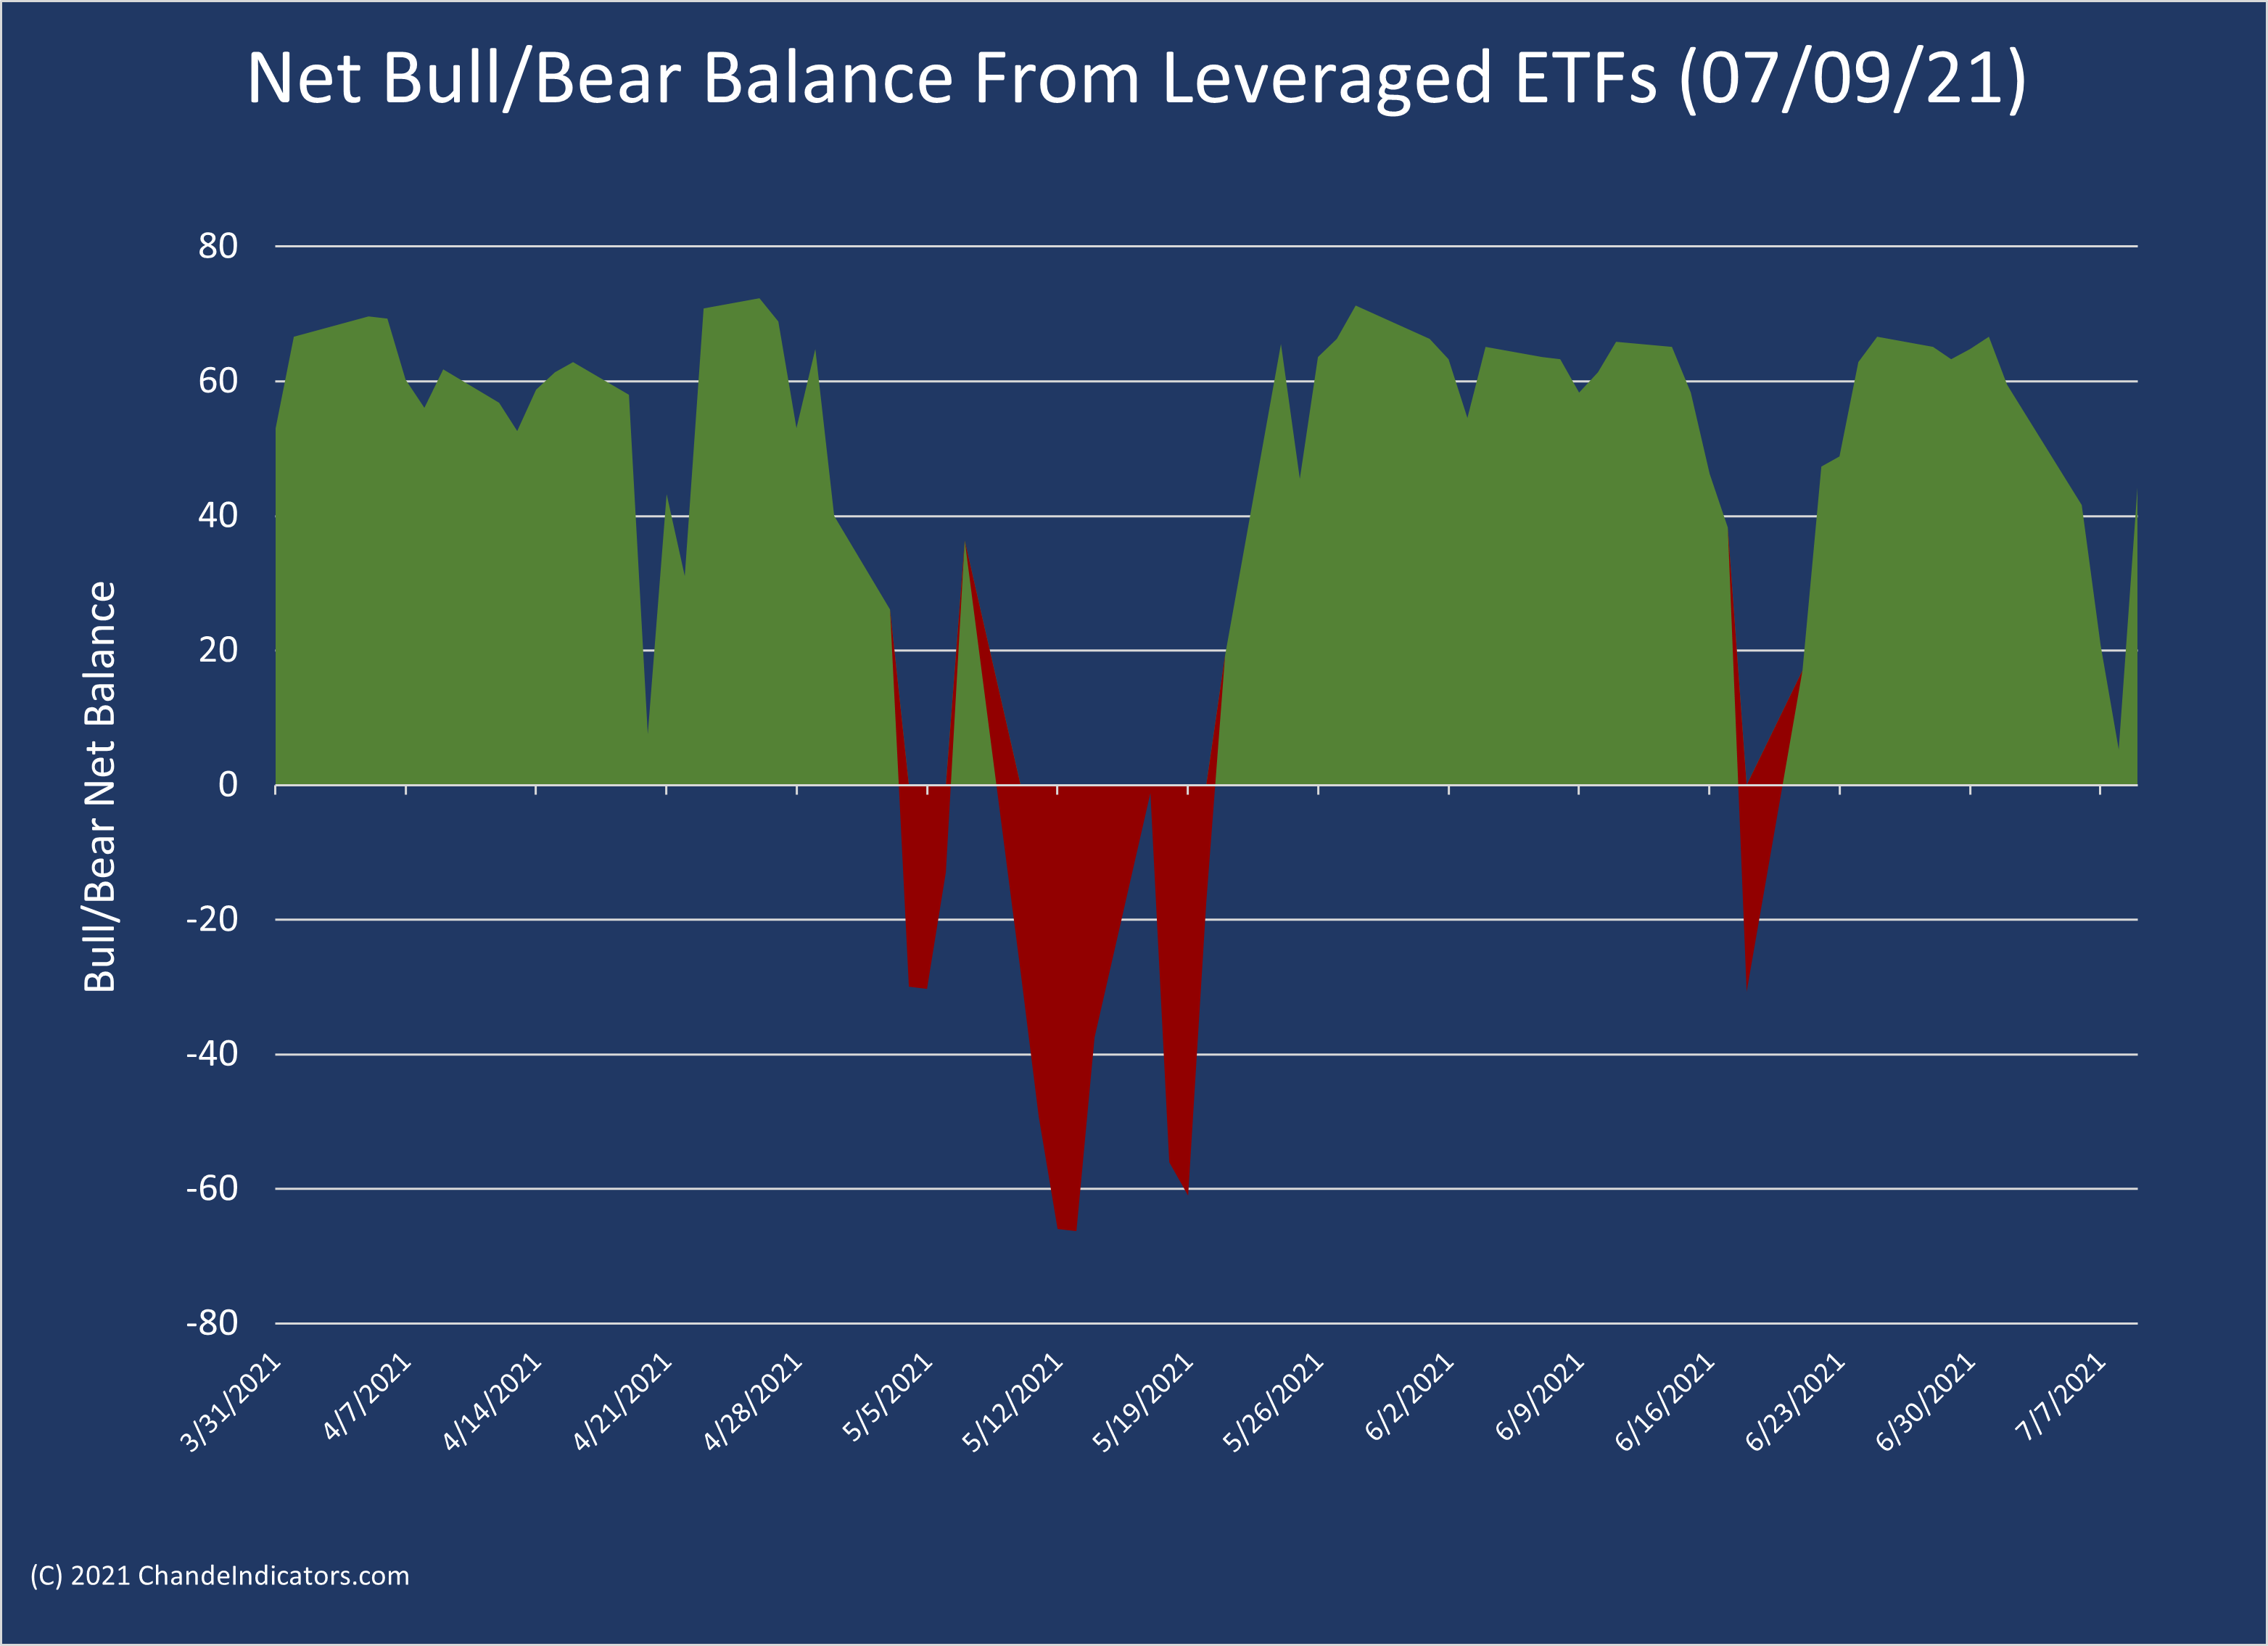
Our bull-bear balance using leveraged and inverse ETFs ended the week at 43, after dipping down near +5, so it nearly turned negative on Thursday. Overall, this indicator has been bullish, though it has dipped below -60 only briefly since March. Nevertheless, its sudden drop this week is hinting at volatility to come in the weeks ahead.
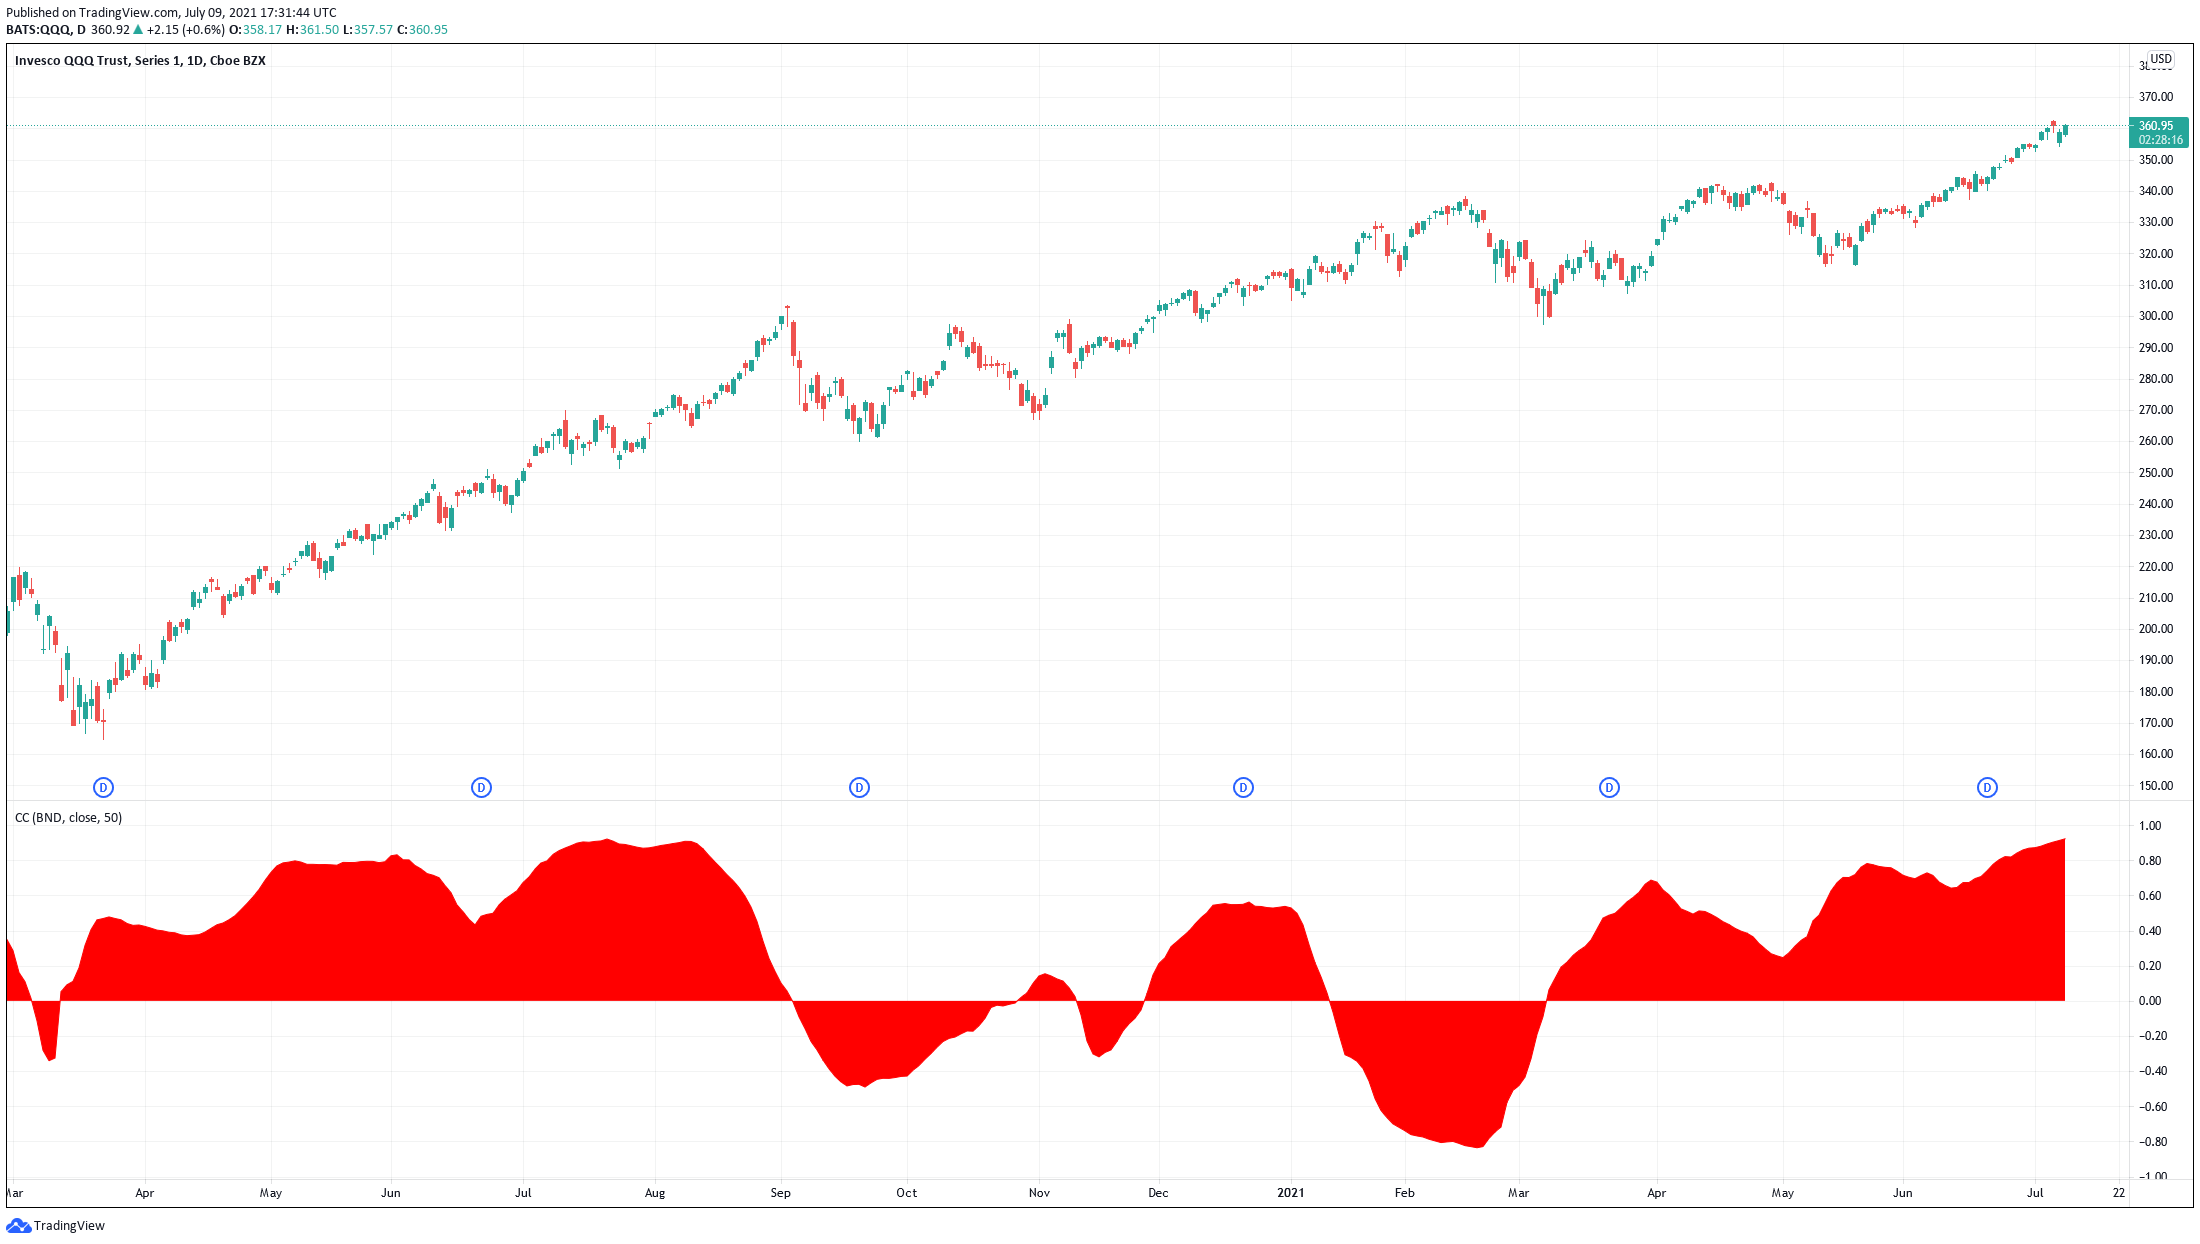
We have mentioned that the QQQ has rallied strongly over the past few weeks, and indeed its earlier decline was attributed to rising rates since traders thought that rising rates would slow the growth rate of the high-flying growth stocks. The chart below shows the rolling 50-day correlation between QQQ and the Vanguard Total Bond Market ETF (BND). The correlation has been rising since the BND bottomed in mid-March and is currently above 0.80, suggesting that falling rates have indeed boosted technology stocks.
Technical Analysis of Bond Yields
In my post in August, I mentioned that I felt bond yields were about to hit strong technical resistance. But, as luck would have it, yields bottomed soon thereafter. The chart below shows that yields are well off their pandemic lows since the late-Summer of last year.
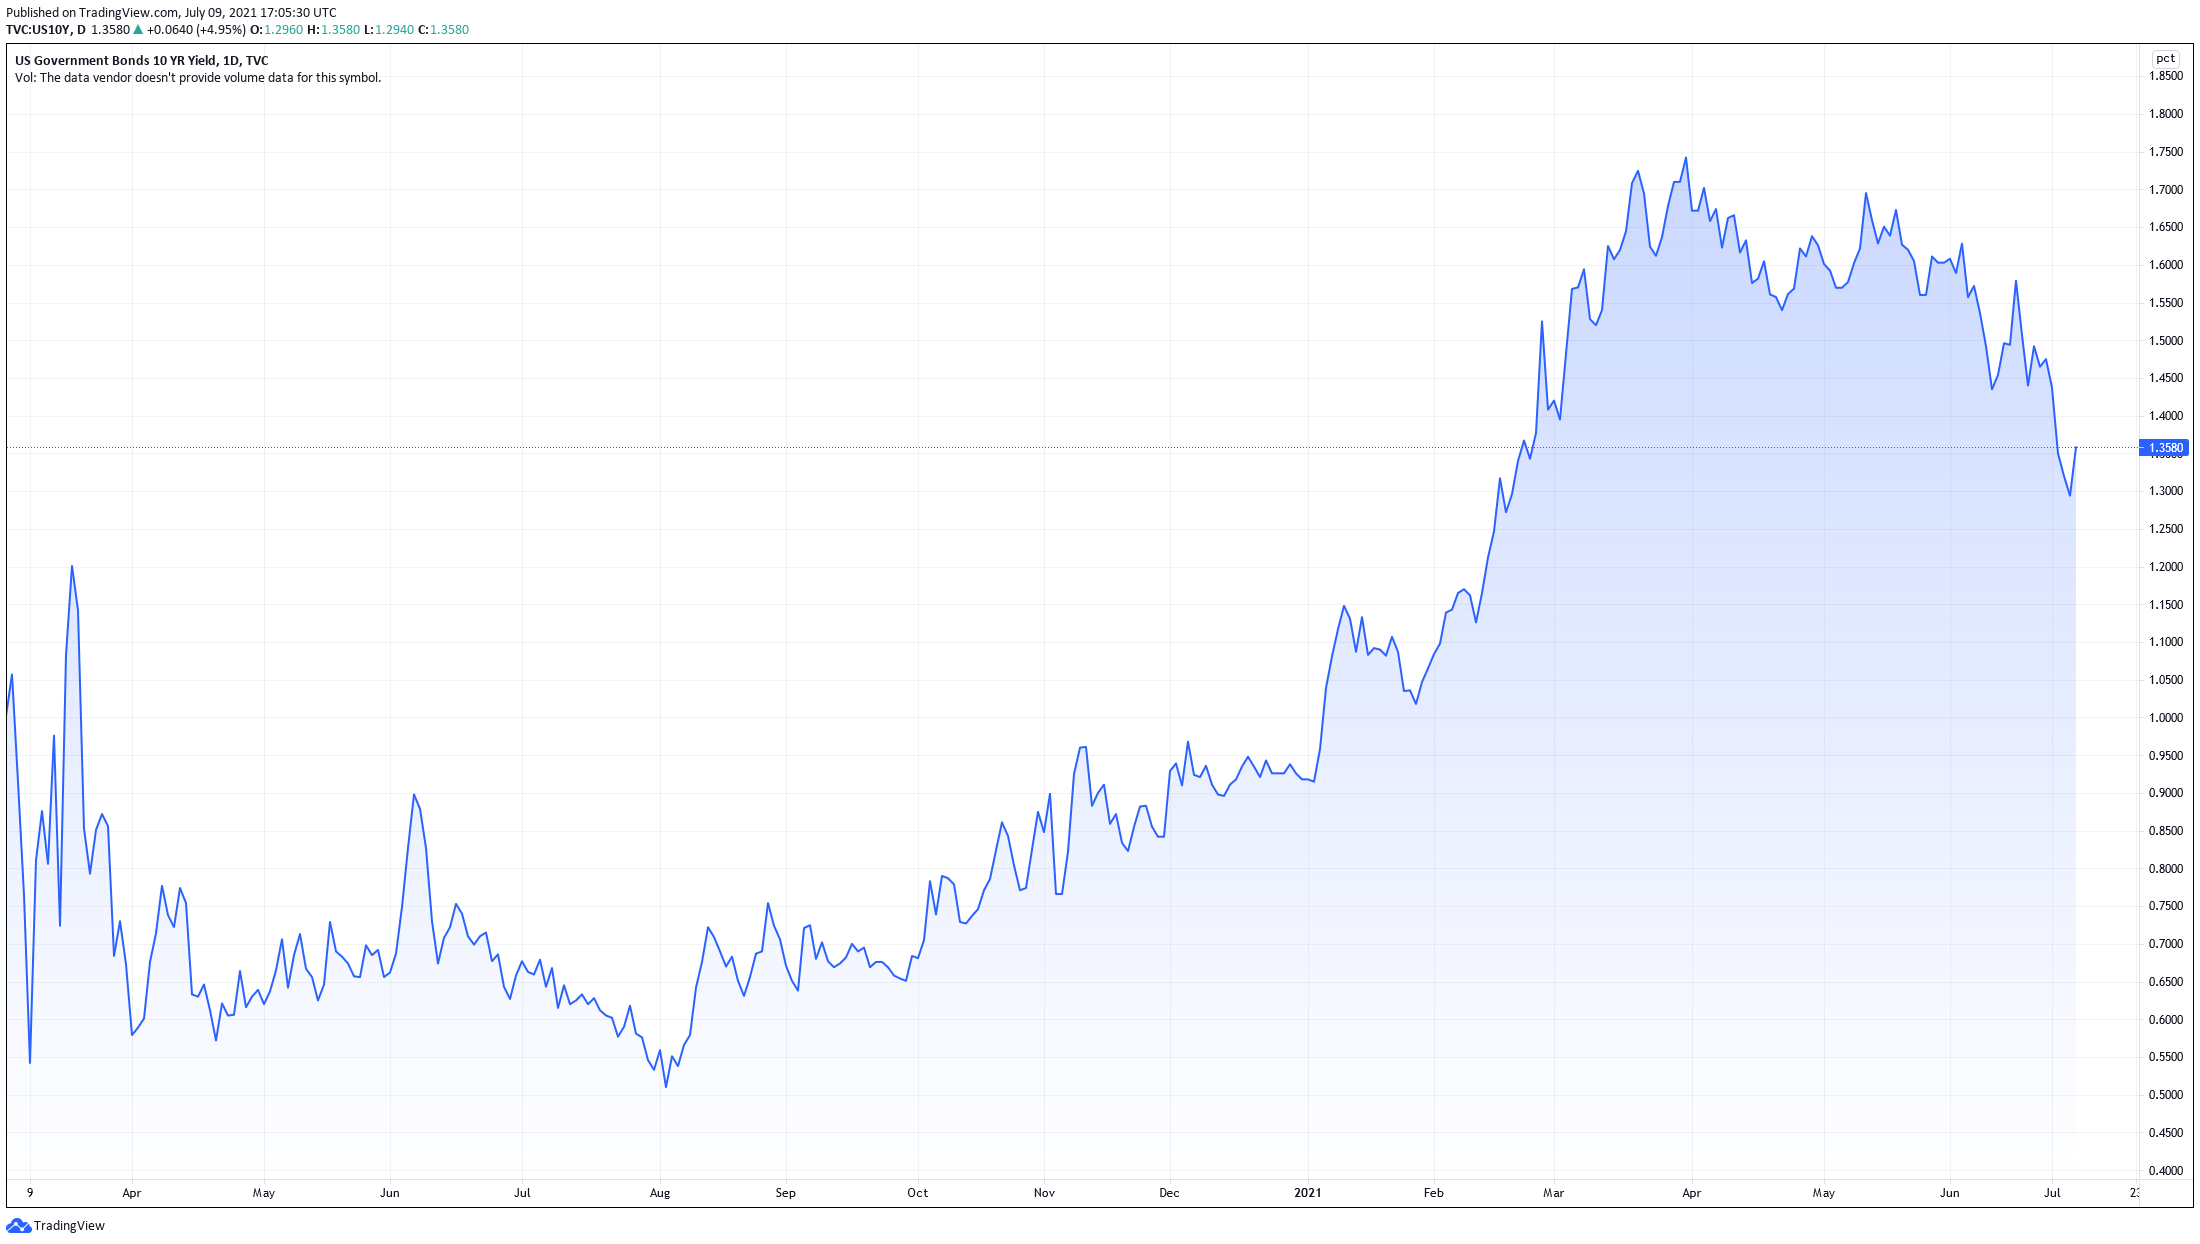
The Conference Board forecast (in June) that US Real GDP growth will rise to 9.0 percent (annualized rate) in Q2 2021 and 6.6 percent (year-over-year) in 2021. Following solid economic growth in Q1 2021, they expect the recovery to continue through the remainder of the year. Looking further ahead, they forecast economic growth of 3.8 percent (year-over-year) in 2022 and 2.5 percent (year-over-year) in 2023. We note that some expect yields to go to 1% for completeness, while others think they may have bottomed. So Wall Street experts have widely diverging opinions.
Since economic growth is essentially peaking just about now, it is not unreasonable to expect rates to drift lower, given the risk from COVID-19 variants in the Fall. Using standard Fibonacci retracement analysis, the yields declined to a 38.2% retracement before bouncing a bit this week. The next two big levels are the 50% retracement (at 1.36% or so) and 61.8% (at about 0.98%). If growth slows, we should expect interest rates to trade in a range of drift slightly lower, so my expectation is a trading range from, say, 1.35%-1.6%, which seems almost too broad to be helpful.
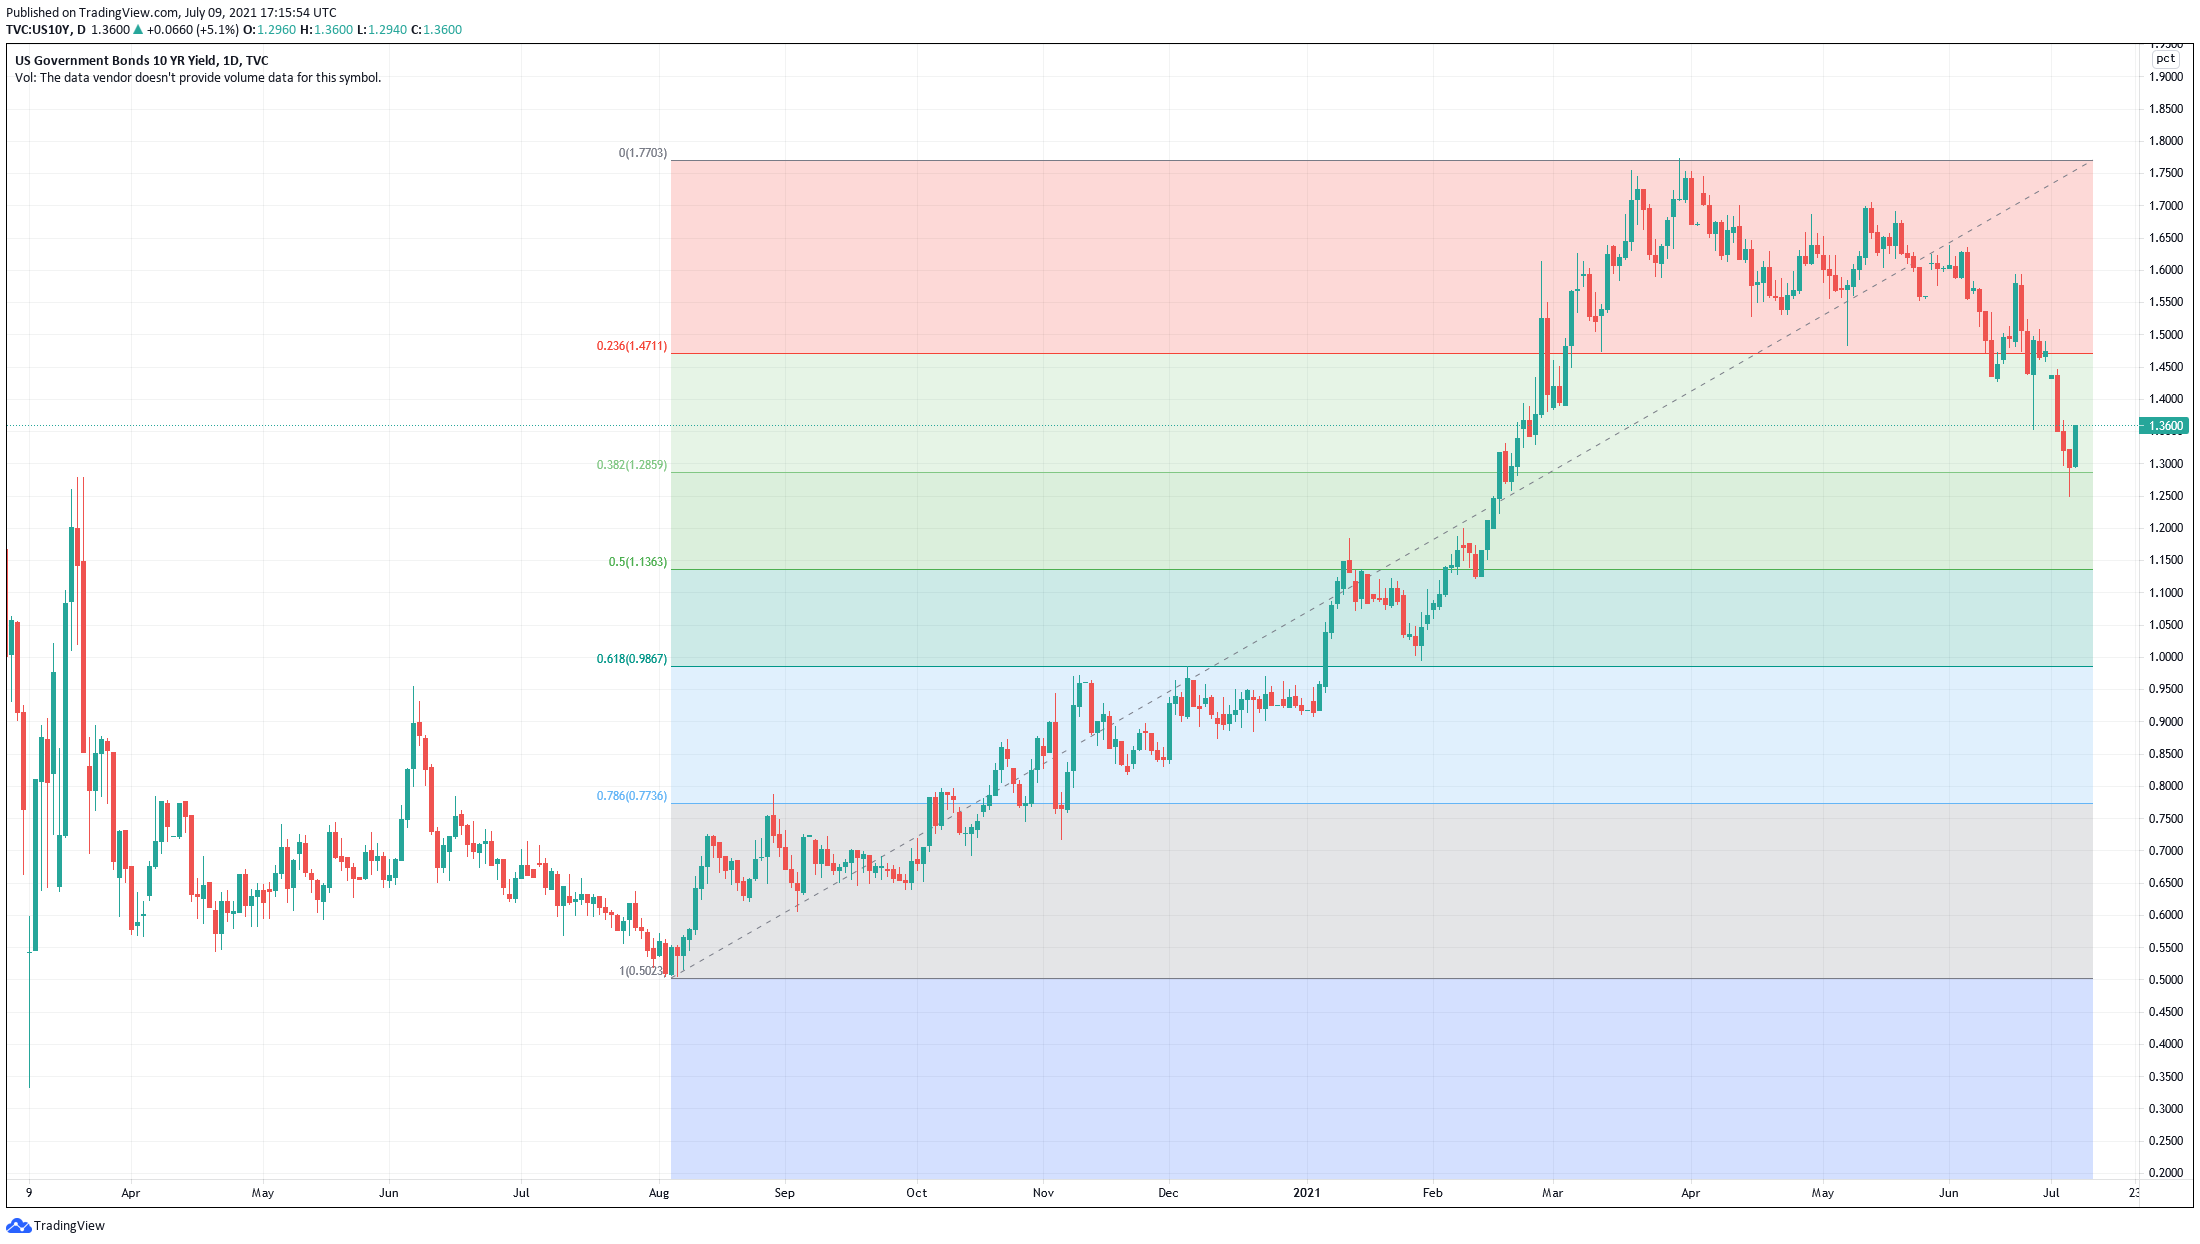
The future path of interest rates is important because it will affect the FOMC decisions, housing, consumer debt, and the trajectory of growth stocks, which are currently leading the market higher.
Wrap-up
If you like to do your own research, my posts should give you a good starting point, with context and suggestions. You can visit my website, chandeindicators.com, for more information and ideas. I hope you will stay tuned and help by subscribing and recommending it to your friends and colleagues.
Thank you for spending some time with me.
Disclaimer
And now for some housekeeping. This publication is for “edutainment,” education, information, and entertainment purposes only. It is not to be construed as investment advice. Past performance is not necessarily indicative of future results. Our disclaimer at chandeindicators.com is included herein by reference.