


Crypto Melto
Cryptocurrency volatility spills over into the stock market.

Overview
Cryptocurrency volatility exploded on Tuesday-Wednesday, spilling into the equity markets. (In my April 23 post, I had pointed to the increasing weakness in Bitcoin with a downside target of 41,000.)
3 Down, 2 Up: This week repeats last week’s trading pattern, when we sold off Monday-Wednesday and rallied Thursday-Friday.
Tech-stocks may have found a key low, especially with a strong rebound on Wednesday.
European markets (Austria, Belgium) made new highs even during the weakness on Wall Street. Hence, EWO is our ETF of the week.
CVS has broken out of a multi-year consolidation after reporting strong earnings in early May, and is our stock of the week .
Key Question:
The alarming volatility in the cryptocurrency market was a wake-up call for highly leveraged traders. After massive 24-hour plunge (-30%) and a dizzying rally off a low near 30,000, should we expect more of the same? We plot support and resistance on the BTCUSD chart and use the GME chart to show more consolidation may be the most likely outcome.
Performance Snapshot

Strong selling early in the week gave the market a chance to test the lows of last week. The subsequent rebound suggests that the technology stocks may have found a key low. For example, the QQQ came down to a supporting trend line before bouncing from a level that was around the middle of the earlier consolidation in March. The key indexes were slightly lower, though small stocks and tech stocks eked out small gains. Not a bad recovery from the early week selling.

The Direxion Daily S&P 500 Bull 3x Shares ETF (SPXL) handily illustrates how the market is trading. SPXL came down to retest the gap just below 89.50. This is now key support, and only a break below this level would be cause for concern. The long-term COLT2 oscillator is showing an uptrend, so the sideways consolidation continues, until we have highs below 89 or notch a couple of lows above 103.

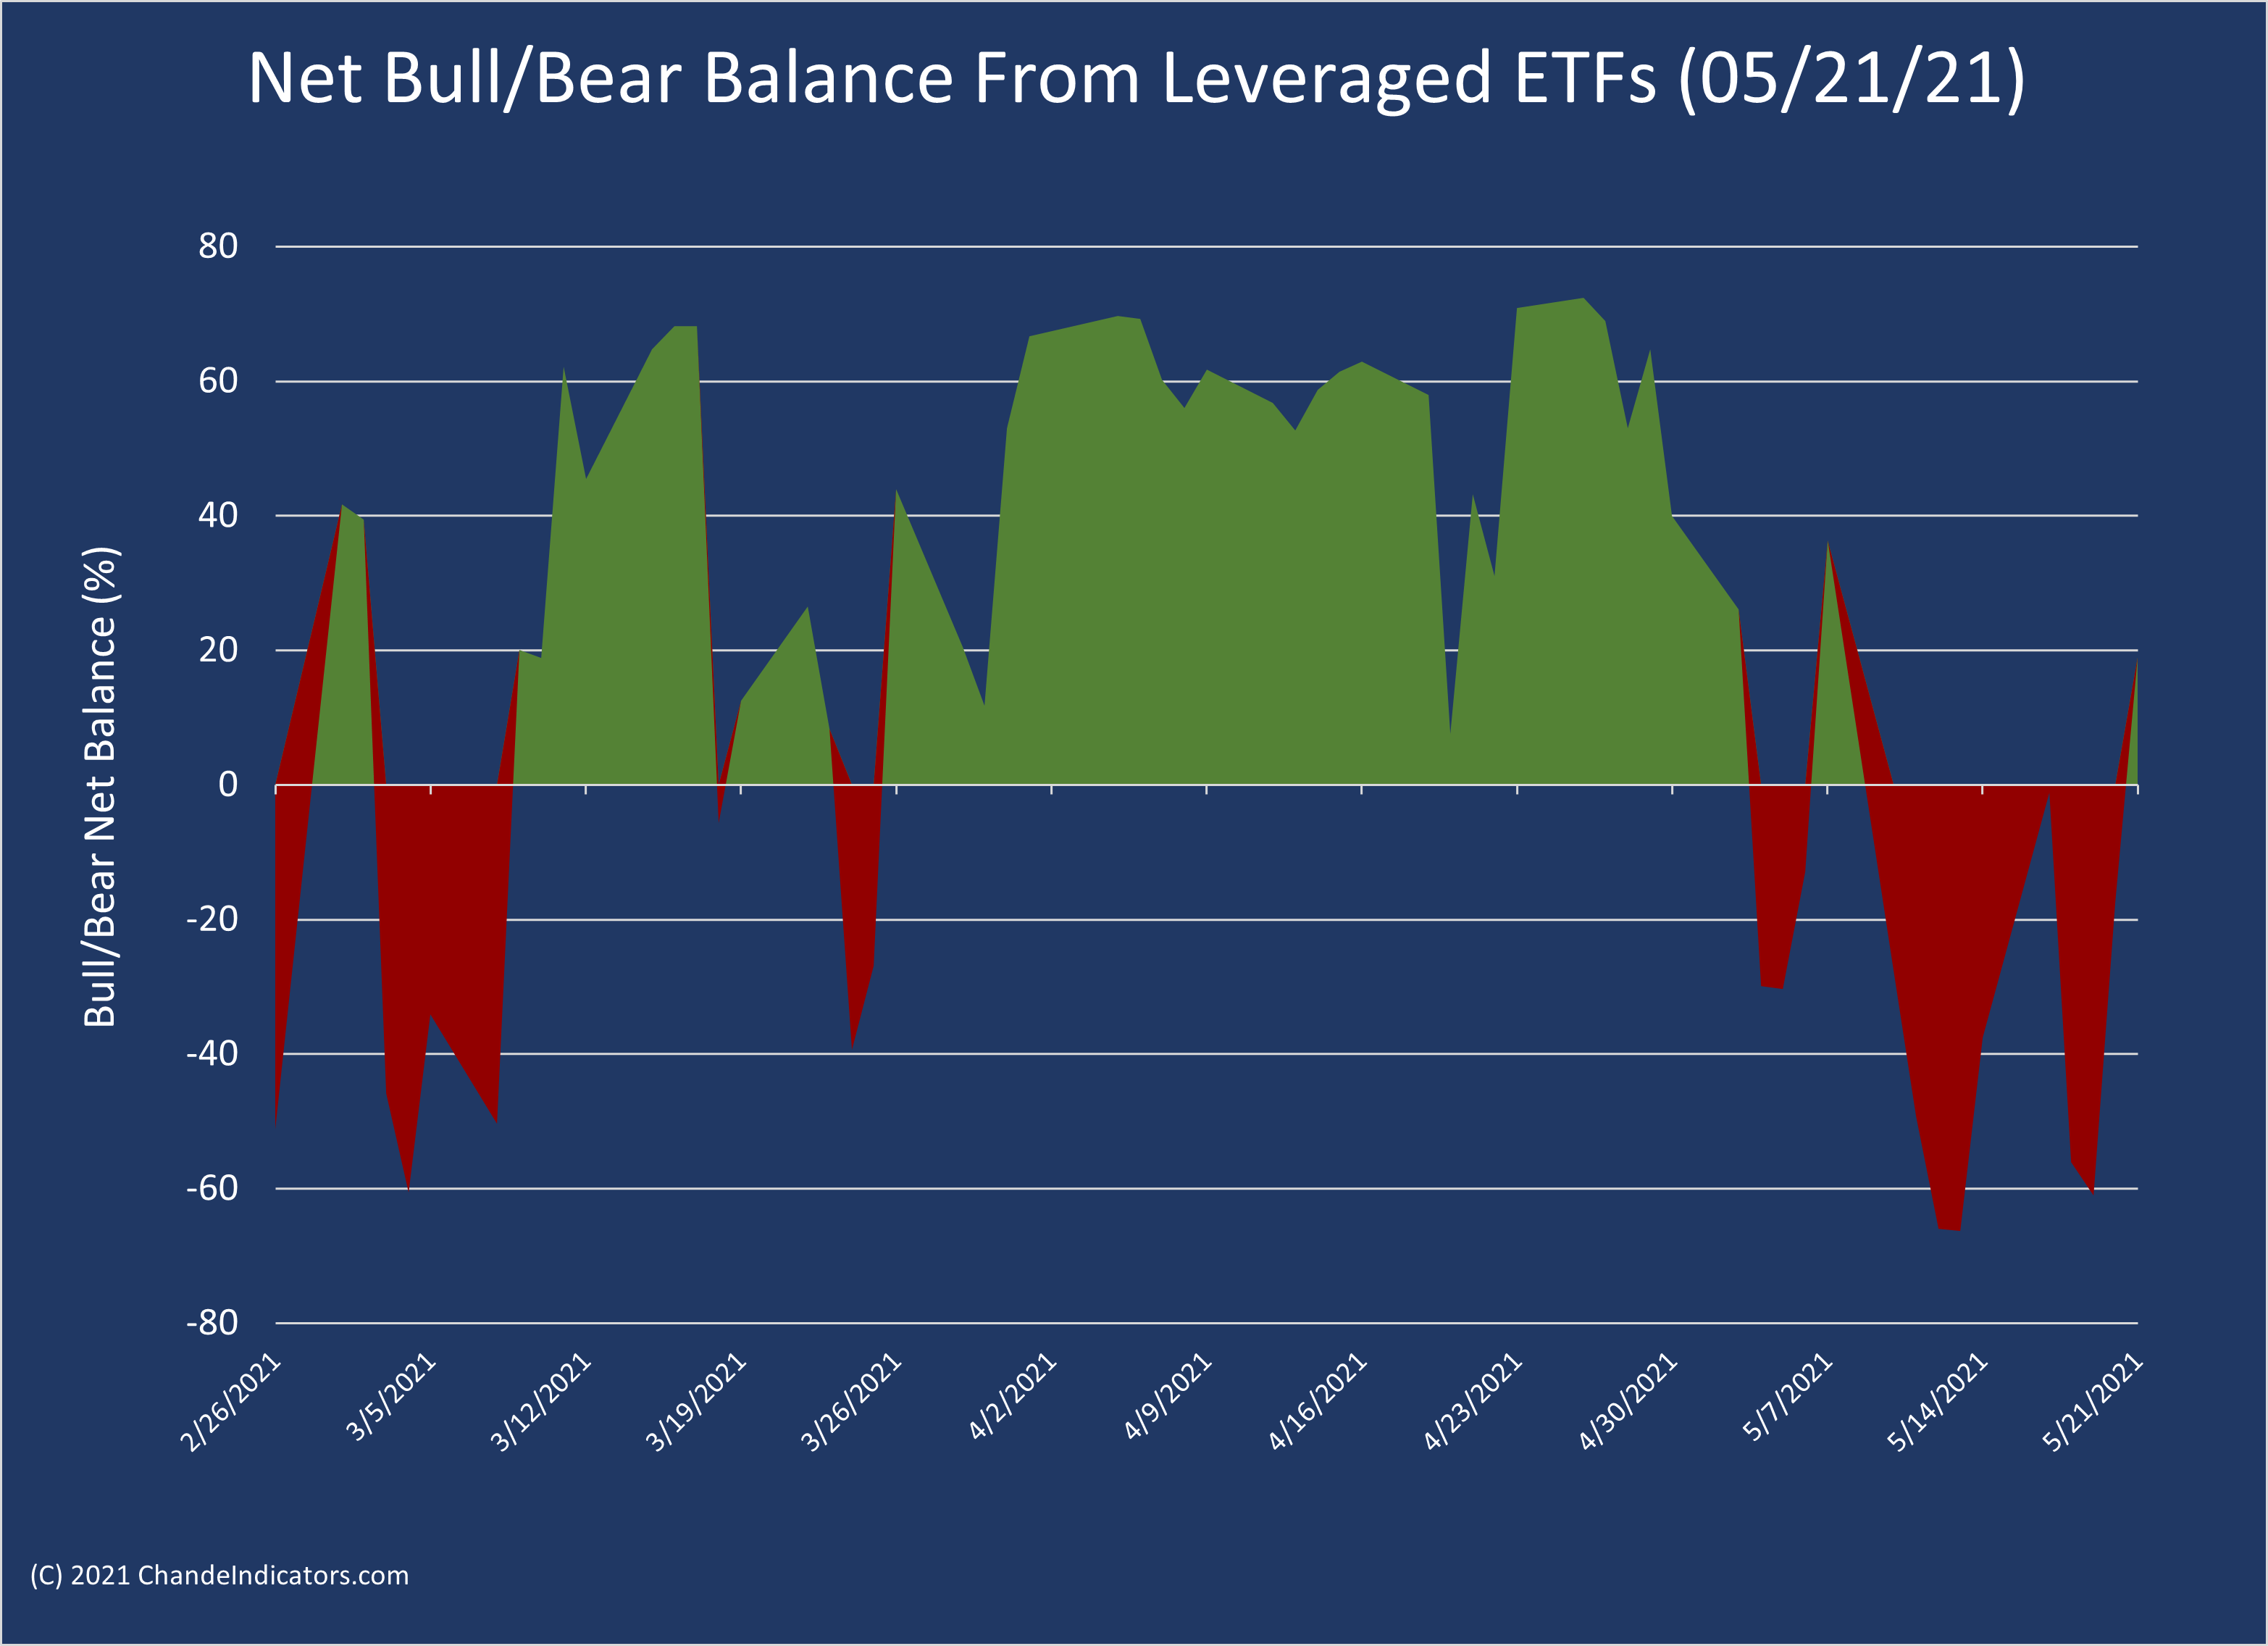
Trend Direction from Leveraged ETFs
Our sensitive bull-bear leverage ETF indicators was red coming into the week, and the early selling justified the positioning. By Friday, this indicator had just nudged into the positive region. This is encouraging, but bulls have not showed any great momentum, so the backing and filling may continue.
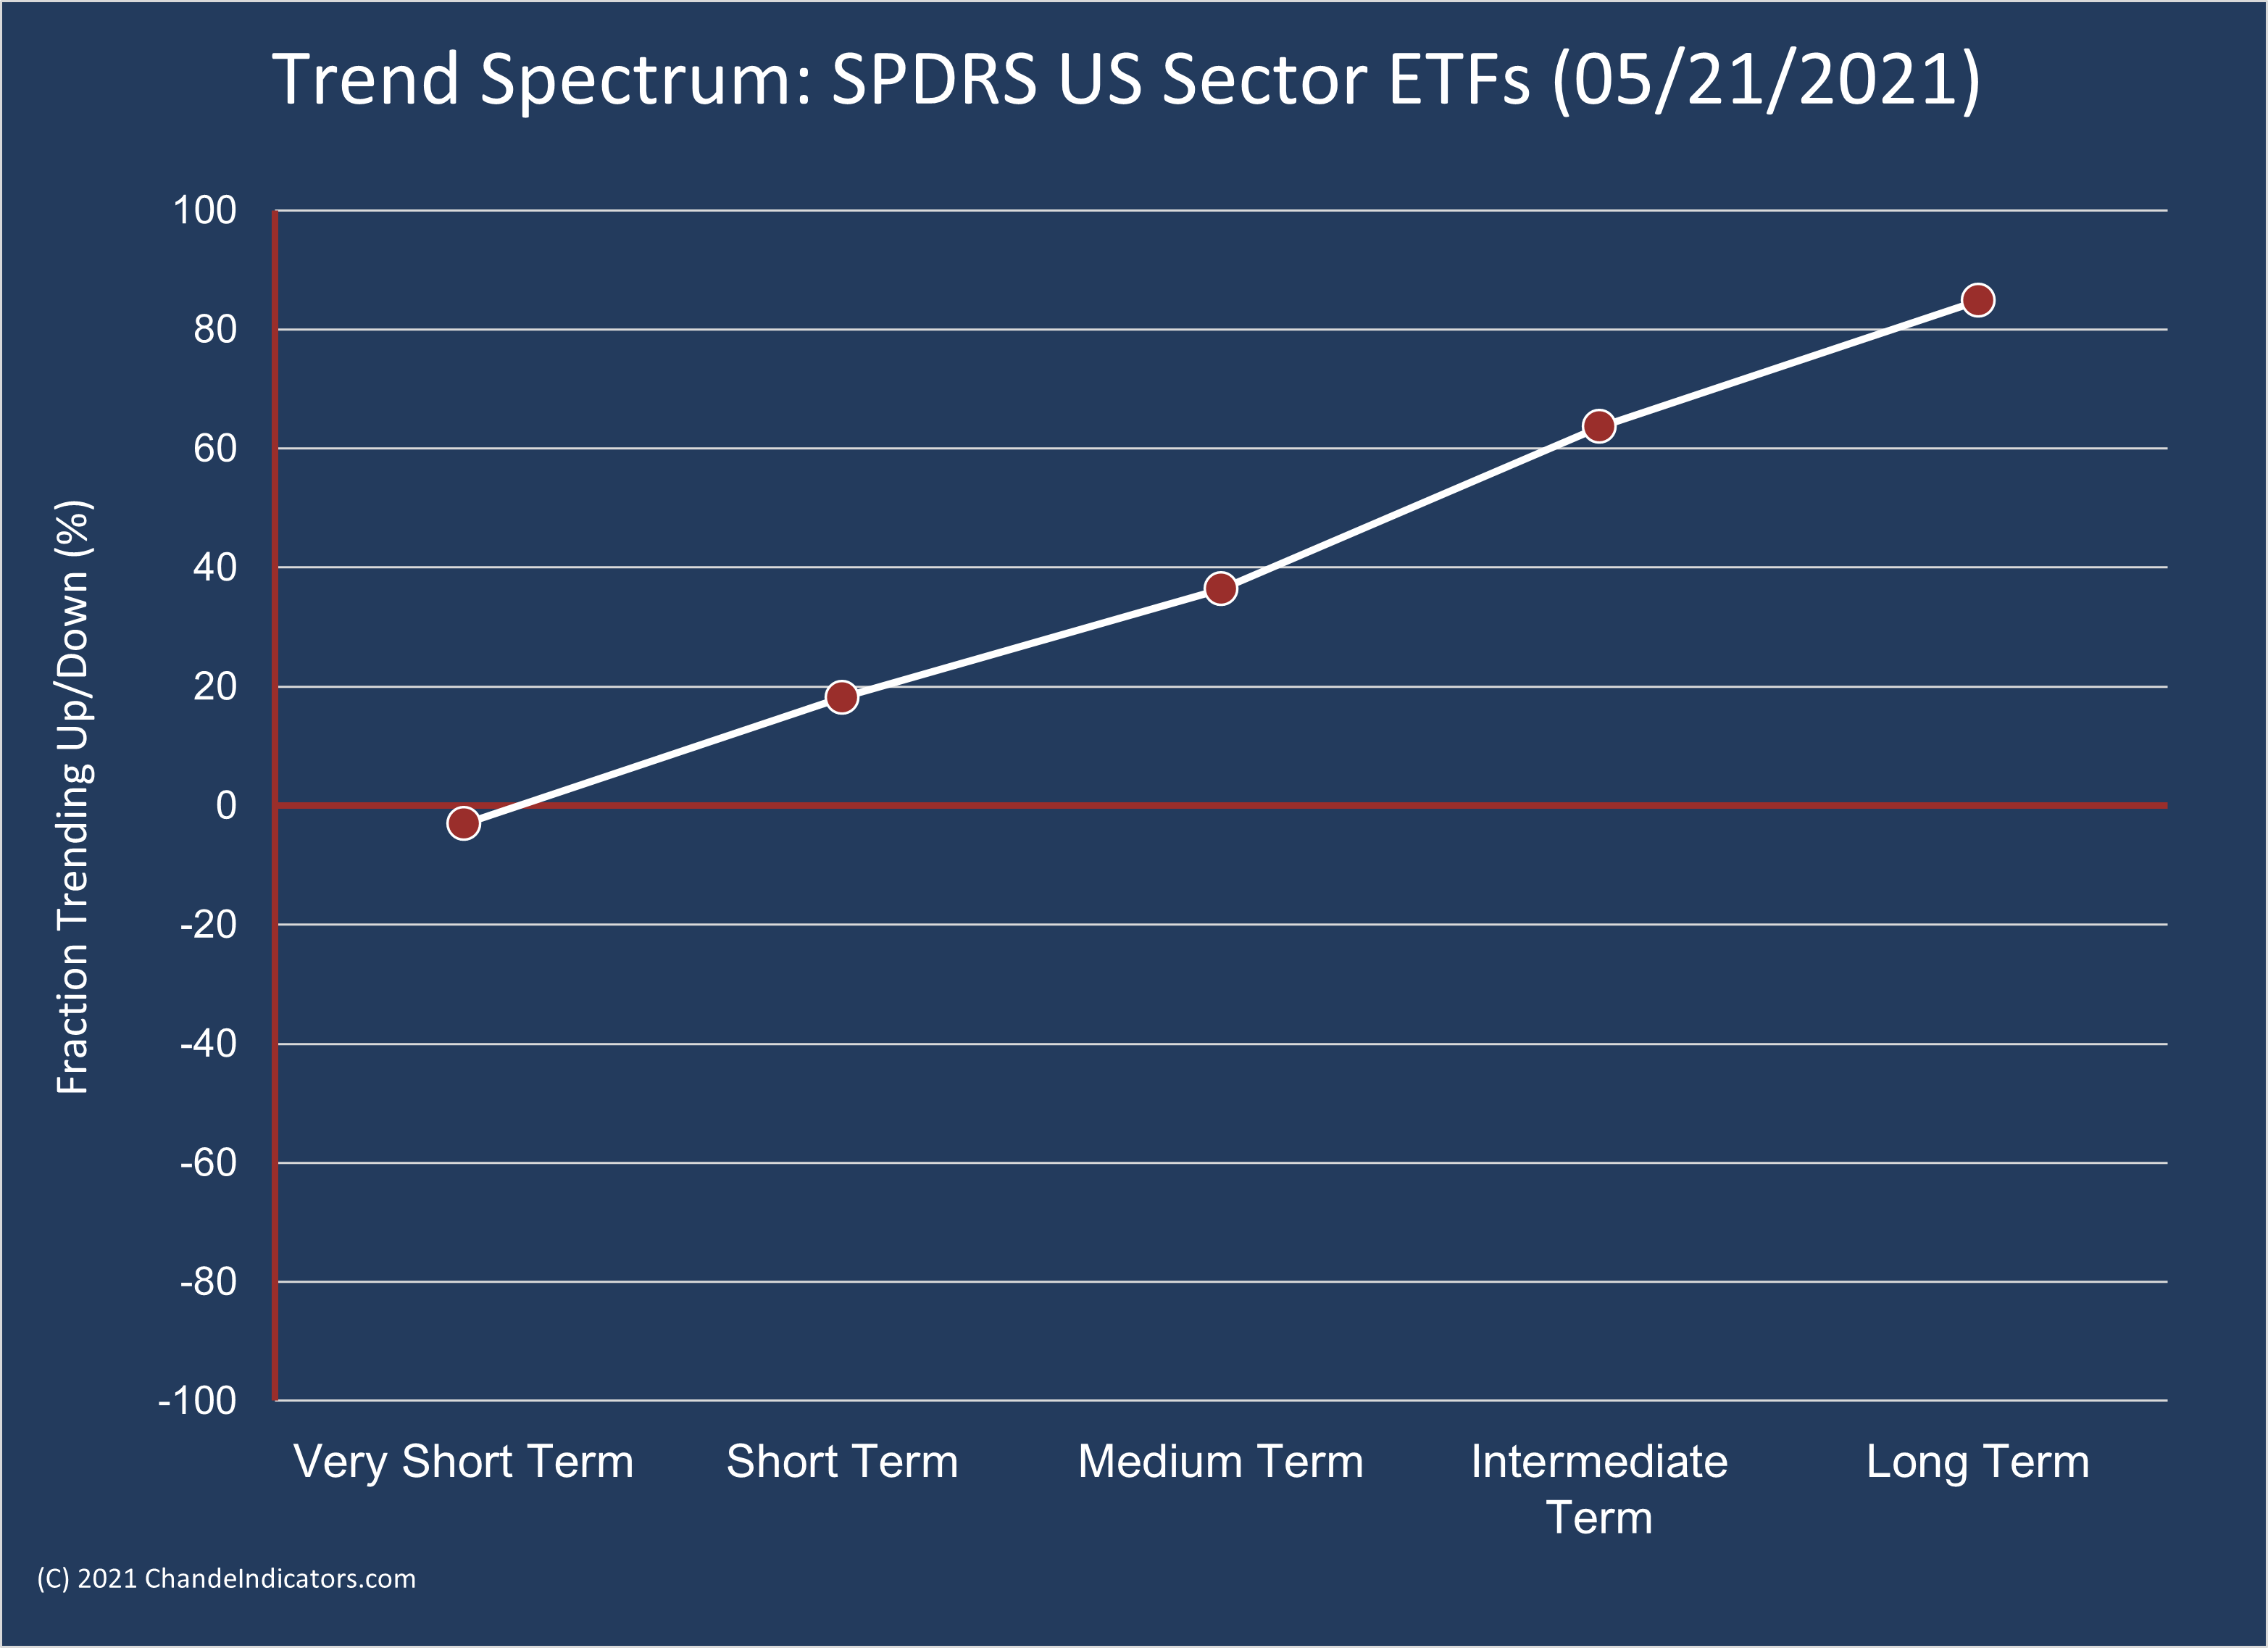
The market breadth of trend spectrum distribution firmed up a bit by Friday, with the percent trending rising from last week’s -40 reading in the very-short to short-term time frames. Also, the long-term trend has weakened as part of the continuing consolidation. This view is confirmed by the trend spectrum across the entire universe of iShares and Vanguard ETFs, which include bond ETFs and international ETFs.
Sector Vector
We focus on the short-term trend strength (COST1+COST2) versus long-term trend strength (COLT1+COLT3) for the major US sectors. These data are on our website in the “Find ETFs” table. They give us a sense for the intensity of short-term selling. The weakest sectors are in the lower-left quadrant and the strongest sectors are in the upper-right quadrant. The weakest sectors were in the technology area, particularly semiconductors, internet, health care equipment and software and services. Long-term investors can look at these as a value trade or counter trend buying opportunity. Trend followers will look at the upper right quadrant. Regular observers will notice that the semiconductor sector bounced this week, and its ST trend strength has improved from near -100.


CVS is our Stock of Week
CVS has broken out of a multi-year consolidation (see all the yellow bars in the chart below). You can also find it on our Stock Finder table on chandeindicators.com by sorting by the sum of all four oscillators in descending order. CVS reported strong earnings on May 4th, so the follow through over the last two weeks has been encouraging.


EWO is our ETF of the Week
the iShares Austria ETF has been steadily trending higher. The table row shows that all of the oscillators are strong. You would have found this ETF by searching the iShares universe by sorting on the “Sum of Scores” column.

Cryptocurrency Traders Discover Gravity

The sell-off on Tuesday-Wednesday was fierce, and the rebound was wild, enough to induce vertigo. In my April 23 post, I thought a pullback to the 41,000 area was a likely downside target. Well, BTCUSD overshot all the way down to 30,000, the January 2021 support zone. As the chart aboveshows, that once the parabolic rise was broken, Bitcoin retested the point at which it broke below the last trend line, and then broke lower. Support now is at the 30,000 level, with resistance near the 50,000 region and 60,000 level. A break below 30,000 would lead to the next downside target around 19,000-20,000. If you imagine an iron plate struck with a hammer, you can imagine that the resulting the sound impulse dies down slowly. Bitcoin has hammered the 30,000 level, and a period of consolidation and retest of that level is probably necessary to absorb that impact before we can be sure of what it does next. The GME chart below shows what happens when there is a period of extreme volatility: the market needs a rest to dissipate all that energy. So, a period of consolidation leading to quieter trading is the most likely scenario over the next few months.

Link to my live event with NinjaTrader Ecosystem
I would like to thank the NinjaTrader Ecosystem folks for hosting a discussion on my new technical indicators for NinjaTrader and to everyone who tuned it. A link to the presentation is below should you wish to catch up.
https://ninjatraderecosystem.com/webinar/trade-breakouts-like-a-pro-new-tools-for-day-traders/
New Tools on ChandeIndicators.com
We have put up new tools on the website. We rank hundreds of stocks and ETFs using some of the indicators discussed in the NinjaTrader platform presentation. You can look through the Stock Finder and ETF Finder tables for trading and investing opportunities.
The new Robo-Advisor allows you to estimate allocation to stocks based on your age and sex using two different algorithms. You can play with the allocations to see how a 4-ETF or 10-ETF portfolio might look like. This is a very useful tool, especially for women and those approaching retirement.
Wrap-up
If you like to do your own research, my posts should give you a good starting point, with context and suggestions. You can visit my website, chandeindicators.com, for more information and ideas. I hope you will stay tuned, and help, by subscribing, and recommending it to your friends and colleagues.
Thank you for spending some time with me.
Disclaimer
And now for some housekeeping. This publication is for “edutainment”, education, information, and entertainment purposes only. It is not to be construed as investment advice. Past performance is not necessarily indicative of future results. Our disclaimer at chandeindicators.com is included herein by reference.