

Commodities Calling
Commodities Calling
We delve into the booming commodity ETFs

Overview
US jobs report for April came in well below expectations, with some downward revisions in prior months.
The weaker than expected jobs report led to a knee-jerk sell-off in the bond market, and consequently, a sharp reversal in tech stocks.
Stocks were mixed: Dow and S&P-500 rallied to new highs out of a narrow trading range, but tech stocks were hit again, until Friday.
Commodities in general were making new highs, whether it was grains (corn, soybeans), or base metals (copper) or industrial metals (steel) or energy (gasoline).
Key Question
With commodities booming, can we call upon some ETFs to participate in the improving demand across the entire commodities complex? We do a deep dive into commodity related ETFs.
Performance Snapshot
A whipsaw week which began with a sell-off in technology and ended with the markets at new highs after the weak unemployment report. Both QQQ and ONEQ ETFs ended down for the week despite a Friday rally. The narrowly based Dow 30 with its exposure to financials and industrials made new highs this week and was the strongest. The broader market was stronger than the mega cap stocks because the equal weight RSP ETF was much stronger than the capital-weighted SPY ETF.

Trend Direction from Leveraged ETFs
Our sensitive bull-bear leverage ETF indicators tipped into the bearish region briefly this week before turning bullish again. As we observed last week, the S&P 500 was trading in a very narrow range, which resolved to the downside, particularly for technology stocks. For example, the SOXX index of semiconductor stocks dipped into its mid-March consolidation zone.

Trend Spectrum
The market breadth of trend spectrum distribution showed the effects of the recent selling, with the percent trending pulling back in the very-short to short-term time frames. Here we are only using the major US equity sectors, and you can see than the left-end of the line has dipped towards zero, showing the selling. Also, the long-term trend has weakened as part of the continuing consolidation. This view is confirmed by the trend spectrum across the entire universe of iShares and Vanguard ETFs, which include bond ETFs and international ETFs.


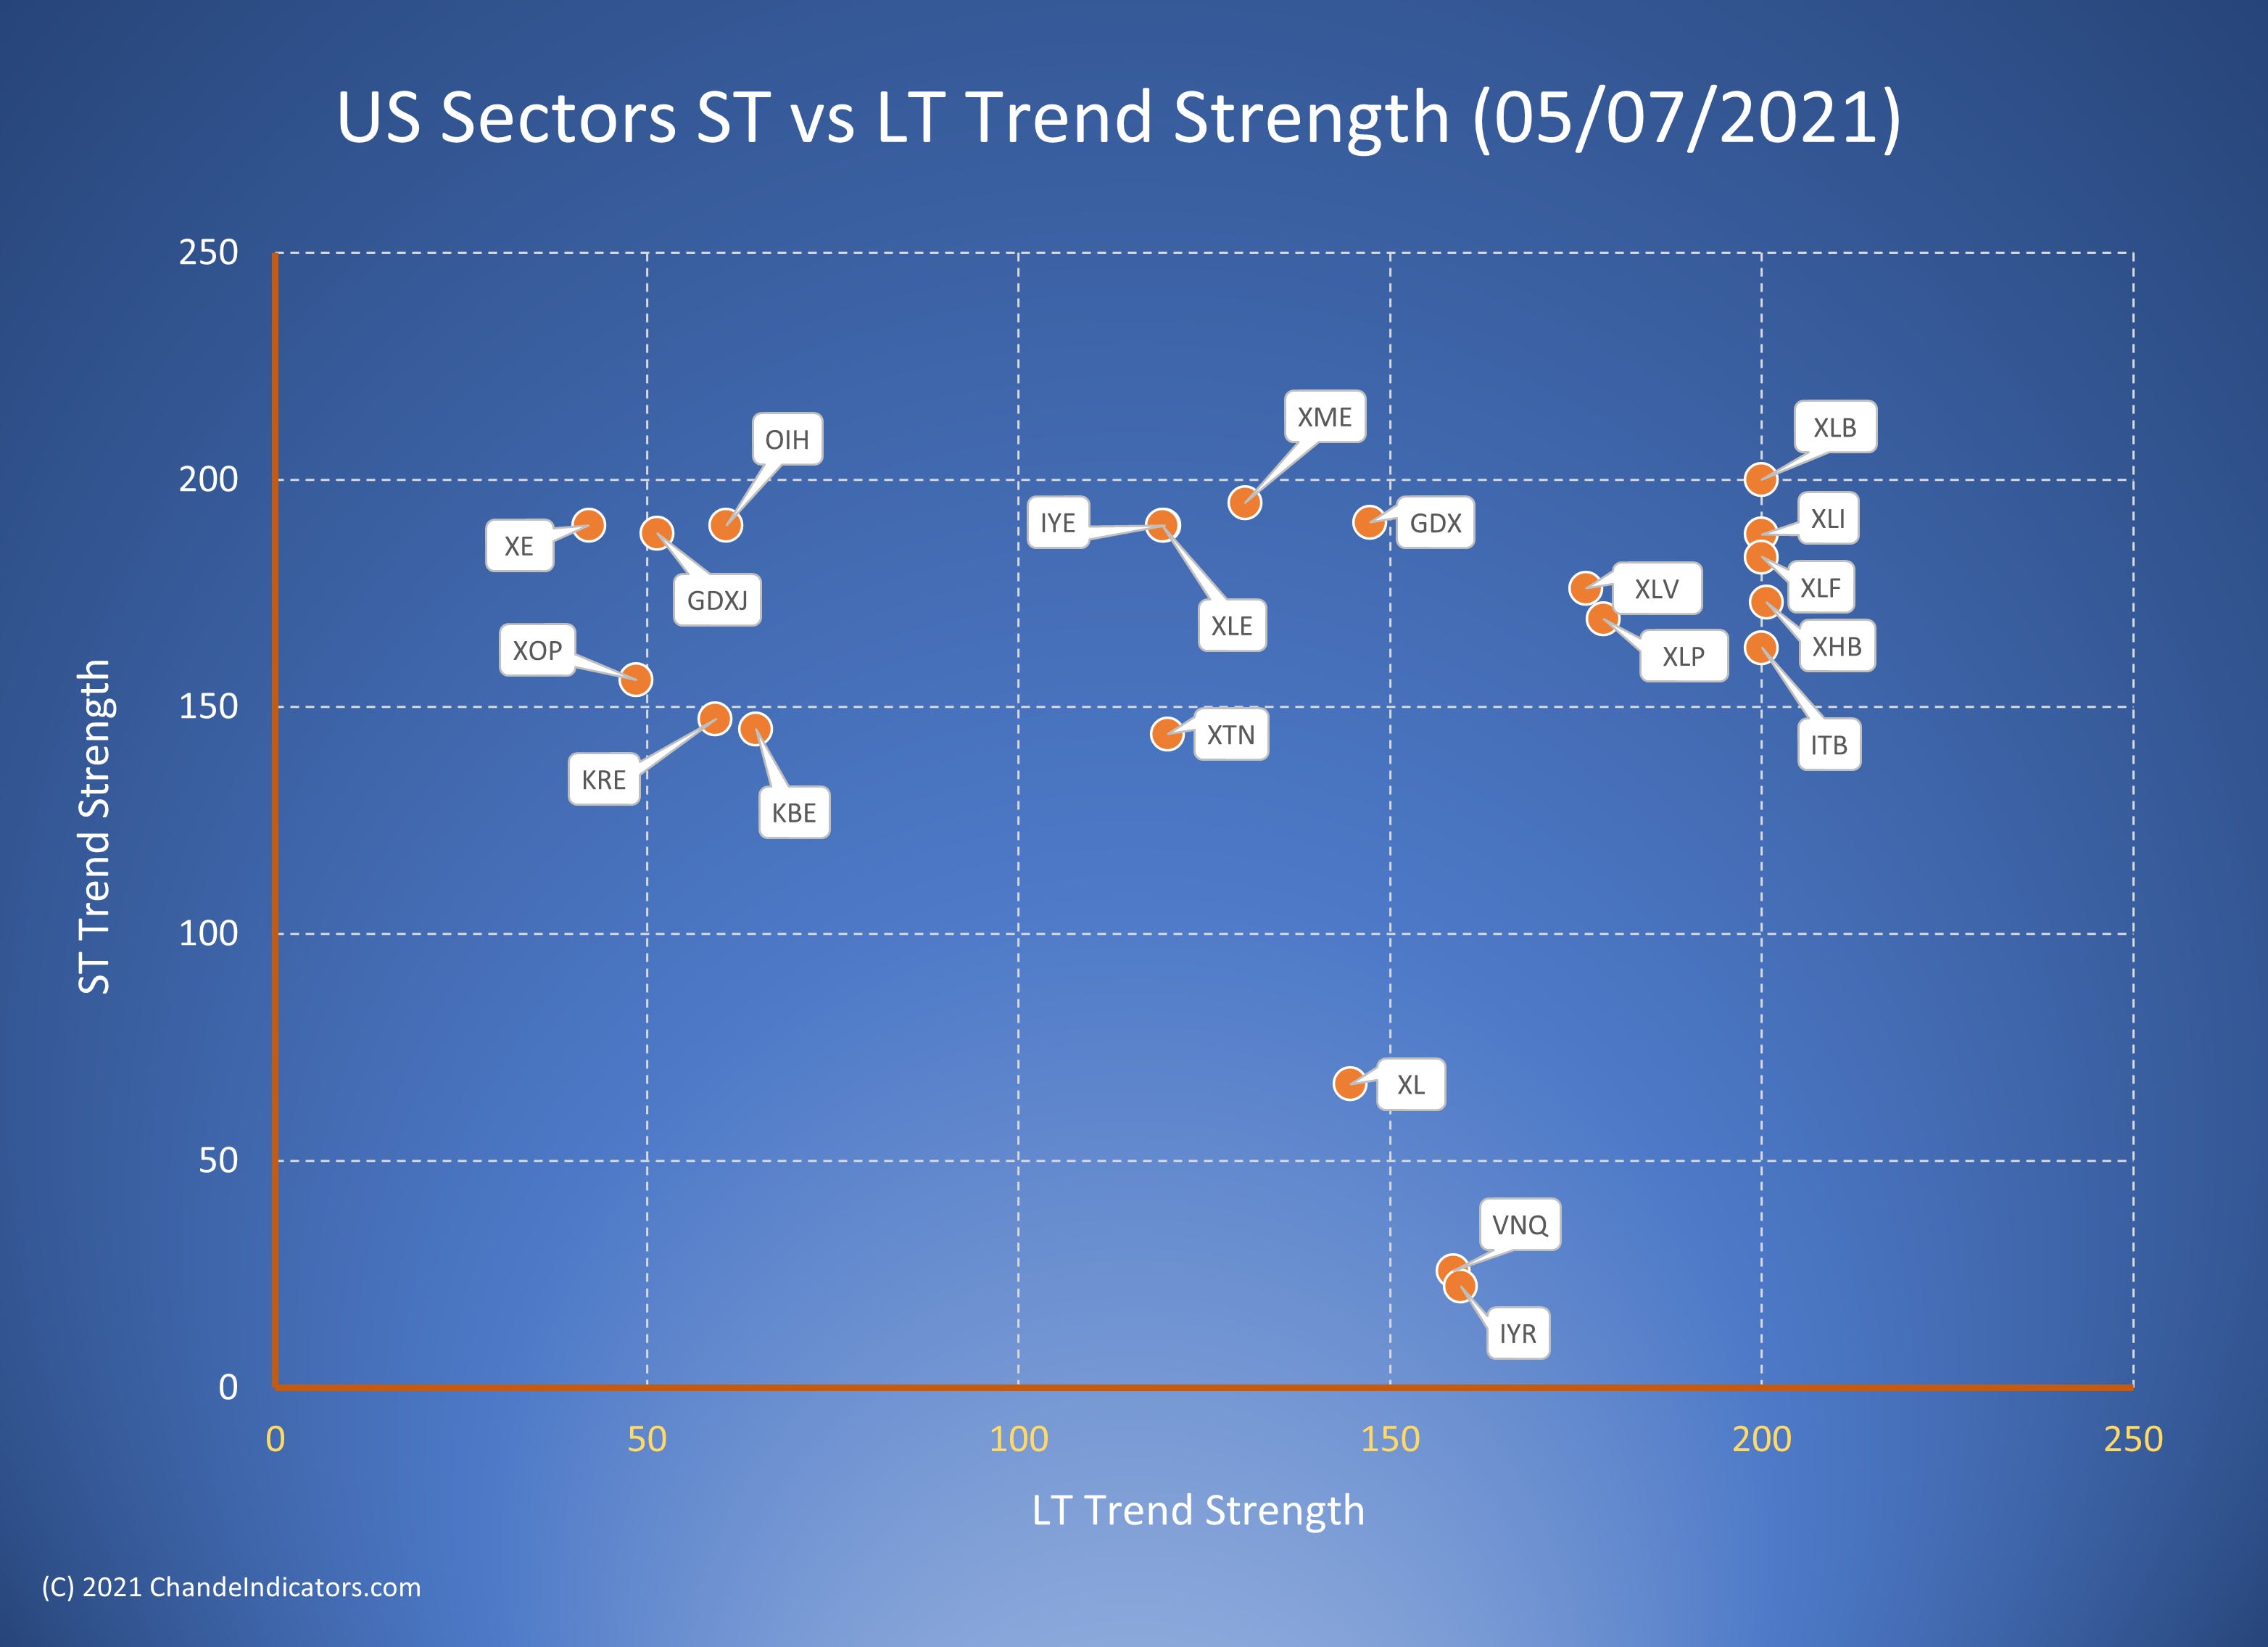
Sector Vector
The trend-strength in the financials (XLF), industrials (XLI), materials (XLB), and home builders (XHB, ITB) is clear in the sector short-term versus long-term trend strength comparison below. Healthcare (XLV) and consumer discretionary (XLP) are also showing strength.
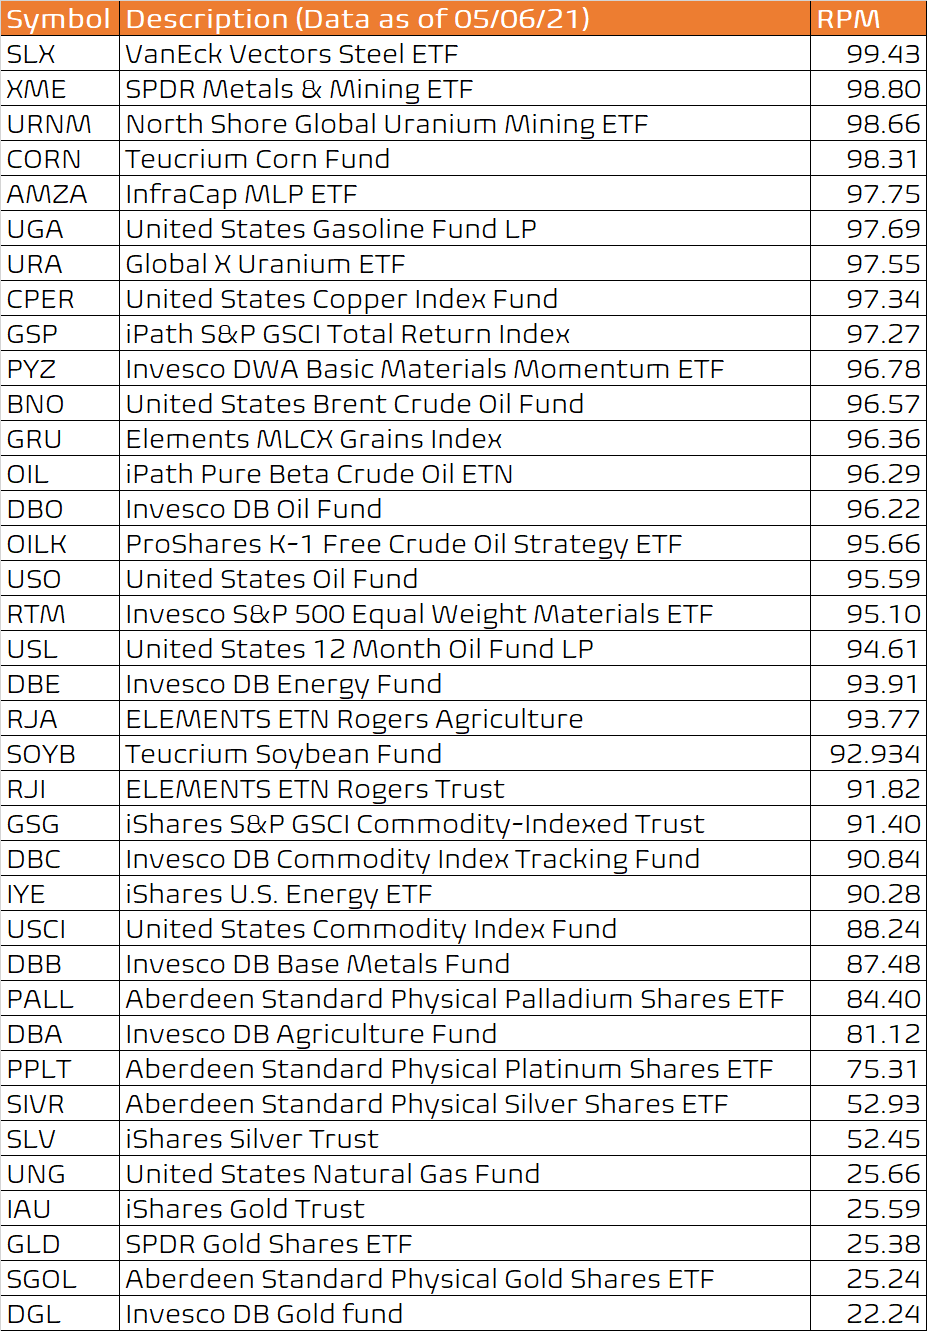
A Deep Dive into Commodity ETFs
Here I use the word “commodity” in the broad sense, including agricultural commodities, base and precious metals, and industrial materials. The commodity markets sold-off in 2020 along with stocks during the COVID-19 lockdown. They have been gradually gaining strength and have accelerated as the pace of vaccinations has accelerated. We will look at this boom in several different ways, and we begin by comparing their relative performance over the past year to more than 1500 other ETFs using our proprietary relative performance meter (RPM). The table below shows that most of them have RPM values greater than 90, i.e., they have outperformed more than 90% of other ETFs over the past year. Gold and silver ETFs are near the bottom, and steel, metals and mining stocks and CORN are near the top.
We next chart the RPM versus the Sum4 technical measure of composite trend strength, which adds two short term oscillators (COST1 and COST2) and two long term oscillators (COLT1 and COLT3) that were discussed in detail here. The RPM and Composite Trend Strength are tools for long-term investors with the assumption that the underlying trend will continue for some time.

Another way to look at these markets is to compare the short-term (COST1+COST2) strength versus their longer-term trend strength (COLT1+COLT3). This gives us insight into the short-term patterns. The chart below shows that most of them have ST sum of around 200, which means they have been breaking out to higher prices. Some of these short-term surges are occurring within strong long-term trends, which means that the LT values are also near 200. So, for traders, this chart is a clear picture to formulate their trading strategies.

Mark Your Calendar: May 13, NinjaTrader Ecosystem Event 04:15 PM EST
I will be doing a live event with the NinjaTrader Ecosystem Events covering my indicator package for the NinjaTrader 8 trading platform. You can use the following link to register:
Wrap-up
If you like to do your own research, my posts should give you a good starting point, with context and suggestions. You can visit my website, chandeindicators.com, for more information and ideas. I hope you will stay tuned, and help, by subscribing, and recommending it to your friends and colleagues.