

A Deep Dive into the iShares ETFs Universe
A Deep Dive into the iShares ETFs Universe
Introducing our Deep Dive Table using 348 iShares ETFs

Overview
The S&P-500 index had a strong month, but ended on a weak note.
Blowout earnings from big tech were punished with strong selling this week.
The market is looking past earnings, which could lead to weakness.
However, underlying trend-following technical indicators remain firm.
Key Question:
The US vaccination drive has succeeded well beyond its expectations. That means the economy can open-up over the summer. With traders ignoring earnings, they are looking ahead, but to what? We will analyze the huge swath of iShares ETFs for clues.
Performance Snapshot
A mostly losing week, in which even strong results by the technology mega caps were punished by traders. But we had strong monthly performance across the board, especially by the S&P500 Index. In a rotation towards large caps, small caps (VTWO) lagged all month long.

Trend Direction from Leveraged ETFs
Our sensitive bull-bear leveraged ETFs indicator still favors the bulls but seemed to weaken in a bit towards month end. The market trend is higher, but the S&P-500 index traded in a very narrow range this week, a sign of increasing indecision, which could resolve to the down-side.

Sector Vector
I used the COST/COLT oscillators to plot the short-term and long-term trend strength of the major US sectors using the iShares ETFs. The three strongest sectors were Financials, Gas and Oil exploration, and Real Estate. The three weakest sectors were technology, gold and semiconductors (see table below the chart for a full map of the sectors and their trend strength).


The COST oscillators are short-term and show swings in market moves. The COLT oscillators are longer-term in nature and show sustained intermediate-term trend strength (going out several months). ETFs in the upper-right quadrant have the best combination of short-term and long-term bullish swings. ETFs in the lower-left quadrant are trending lower over the short and long-term. Naturally, markets drift or swing from quadrant to quadrant based on their trend patterns. Trend-followers will expect ETFs to stay in their current quadrant; counter-trend traders are looking for reversals.
Introducing our Deep Dive Table
Here is my new Deep Dive Table that will soon be available on my website. You have already seen small bits above. The table slices and dices ETF data to measure momentum in different ways, and then lets your directly compare any two ETFs or stocks on an apples-to-apples basis. The table combines relative measures of momentum with absolute measures of momentum computed on different time frames. When sorted in descending order, the strongest ETFs with the most momentum should be near the top. The table uses the following proprietary technical indicators that you can use to rank and sort for your convenience:
RPM: Relative Performance Meter a complex evaluation of composite multi-period performance going out to a year. The scale is 0 – 100. The best performers of the past year will be near the top and vice versa.
COST1, COST2: Chande Oscillators Short Term, hence COST, computed two different ways to measure changes in momentum (COST1) and breakout patterns (COST2). These measure strength over the past two weeks. The scale is + 100 (Strong Up) to -100 (Strong Down).
COLT1, COLT2: Chande Oscillators Long Term, hence COLT, computed two different ways to measure changes in momentum (COLT1) and breakout patterns (COLT3). These measure technical parameters from a few weeks to a few months. The scale is + 100 (Strong Up) to -100 (Strong Down).
COST1+COST2: A simple sum of the two COST oscillators to rank short-term trend strength and direction, for short-term traders, or counter-trend entries. The scale is +200 (Strong Up) to -200 (Strong Down).
COLT1 + COLT2: A simple sum of the two COLT oscillators, to rank long-term trend strength and direction, for counter-trend entries or exits. The scale is +200 (Strong Up) to -200 (Strong Down).
Sum4: A simple sum of all COST and COLT oscillators, for a composite measure of trend strength. We seek to identify those with strong swing moves up or down within a longer-term upward or downward trend. The scale is +400 to -400.
Taken together, the RPM gives an overview and direct apples-to-apples comparison of the relative price performance of one stock or ETF compared to all others in the basket. The oscillators are chart-based, and do not directly compare one chart to another, but are an absolute measure of each individual stock or ETFs performance. They answer the question: “How does the chart look?”. The table is mostly designed for trend-following strategies, but counter-trend entries and exits are certainly possible based on your perspective. When you sort any column in descending order, the strongest stocks or ETFs will always be at the top of the table, and weakest at the bottom. The Deep Dive Table is very flexible and powerful, and you can use it in many ways. The simplest way to think about it is that the ETFs with best momentum should be near the top when ranked in descending order. Trend-followers will focus on items at the top of the table; counter-trend or “value” traders will focus on symbols at the bottom of the table. These data are not available anywhere else. The table shows symbols without regard to volume, so some may have volume restrictions for large traders. The website will have tables for ETFs, and large, medium, and small cap stocks. However, these tables will be behind a pay wall, since I must purchase the underlying data needed to maintain the tables. A table with Dow 30 Industrials stocks will in the public domain for your convenience. Naturally, you bear all the risk of your trading decisions: the table is meant as a starting point for your own analysis.

You can analyze this table in many different ways. For example, you can study factor ETFs to see which market factors are performing best. Currently, Bond factor ETFs are at the bottom of this table, and Value Factor, and Small Cap and Mid Cap Blend ETFs are near the top. The strongest Factor ETFs are STLV, MIDF, STMB and SIZE based on the sum of all oscillators. Which confirms that cheaper, smaller stocks have done well in the market.

You can analyze performance by country or global region to search for opportunities outside the USA. The metrics for comparisons are the same, so you can compare relative performance (via RPM) or absolute trend strength in the short- or long-term.

iShares has designed “Core” ETFs for constructing retirement portfolios. If you are a portfolio manager, you can concentrate on those ETFs as you manage client portfolios.

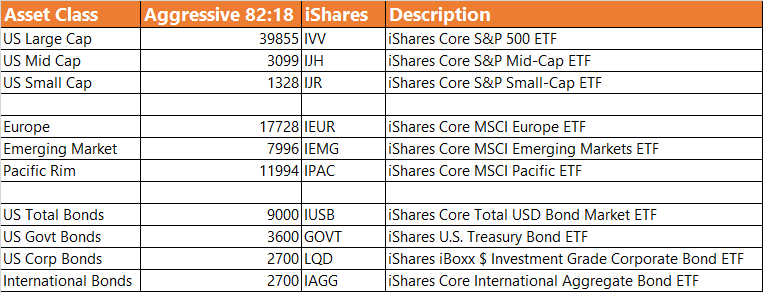
For example, a well diversified 10-ETF portfolio might look like the one below. This one has an “aggressive” 82% allocation to stocks (and 18% to bonds). In the table above, IHJ and IJR have performed better than IVV, so a portfolio manager might try to reduce the allocation to IVV and reallocate them to IJH or IJR in the prototypical retirement allocation shown below.
We have briefly illustrated different applications of the Deep Dive Table, which is a powerful tool. It will be available on my website next month.
What are Trader Favoring Now
We rank the iShares Deep Dive Table using the Sum4 column in descending order. The top ETFs are shown in the table below. Small and mid cap ETFs, Financials ETFs, home construction ETFs and European country ETFs have clearly attracted support from traders at the moment.

Mark Your Calendar: May 13, NinjaTrader Ecosystem Event 04:15 PM EST
I will be doing a live event with the NinjaTrader Ecosystem Events covering my indicator package for the NinjaTrader 8 trading platform. You can use the following link to register:
Wrap-up
If you like to do your own research, my posts should give you a good starting point, with context and suggestions. You can visit my website, chandeindicators.com, for more information and ideas. I hope you will stay tuned, and help, by subscribing, and recommending it to your friends and colleagues.
Thank you for spending some time with me.
Disclaimer
And now for some housekeeping. This publication is for “edutainment”, education, information, and entertainment purposes only. It is not to be construed as investment advice. Past performance is not necessarily indicative of future results. Our disclaimer at chandeindicators.com is included herein by reference.