


A Tutorial: What is the Trend?
A delayed 12-month simple moving average (SMA) is a robust tool for identifying the trend.

Overview
The CPI and PPI data suggested that inflation may have peaked, propelling the markets higher. However, the CPI remains above its 12-month simple moving average, so the FOMC has no reason to change its plans.

The S&P-500 moved past the 4250 level I pegged as the dividing line between bull and bear markets. The recovery from the June lows has been impressive, but even the double-digit recovery is insufficient for some bears (and hence our key question below).


Key Question
What is the “best way” to determine if we are in a bull or bear market? The correct answer is that there is no such thing. Instead, the answer depends on the time interval used in our analysis, among other considerations. So instead of relying on the opinion of others, I will walk you through a robust tool: the delayed 12-month SMA.
Performance Summary
The S&P-500 closed above the 4227 retracement midpoint and above the 4250 level I thought was a good reference for affirming the bull market. This is a significant accomplishment for bulls, and even if there is a pullback in September, it is hard to argue we will go below the June lows.

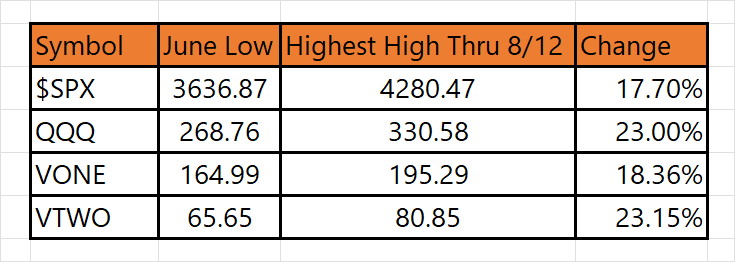
Small-cap stocks continued their outperformance relative to large-cap stocks: as we showed above in the overview table, they have bounced back smartly.

The week ended on a powerful note, with the net bull/bear balance over +75. However, the market may be getting a bit overbought as it approaches the highs of the late April bounce (shown by the dashed red line on the $SPX chart above.)

Delayed 12-month SMA Model
Stock market technicians rely on many tools such as chart patterns, the action of the “tape,” i.e., the advance-decline line, volume, sentiment, and market history to determine whether the market has bottomed. However, a consensus takes a long time to develop and is often unreliable. Hence, I will suggest a straightforward and robust tool that makes no market assumptions, and though it is not perfect, it uses evidence, not opinions. Furthermore, to simplify the analysis, it uses the S&P-500 index and only its monthly closes. These data are easy to find in the financial press and online, so you can even maintain the model by hand if you choose.
The Model
I suggest using a 12-month simple moving average of the close (SMAC), delayed by one month. Then the trend is up if the current month closes above the SMAC or down if it closes below. The interpretation is automatic and requires no judgment.

Here is the historical data (since 1950). I first calculated the delayed SMAC, next computed the delayed standard deviation, then calculated the deviation of the close from the SMAC, and lastly divided the deviation of the close from the SMAC by the delayed standard deviation to produce consistent scaling across time.

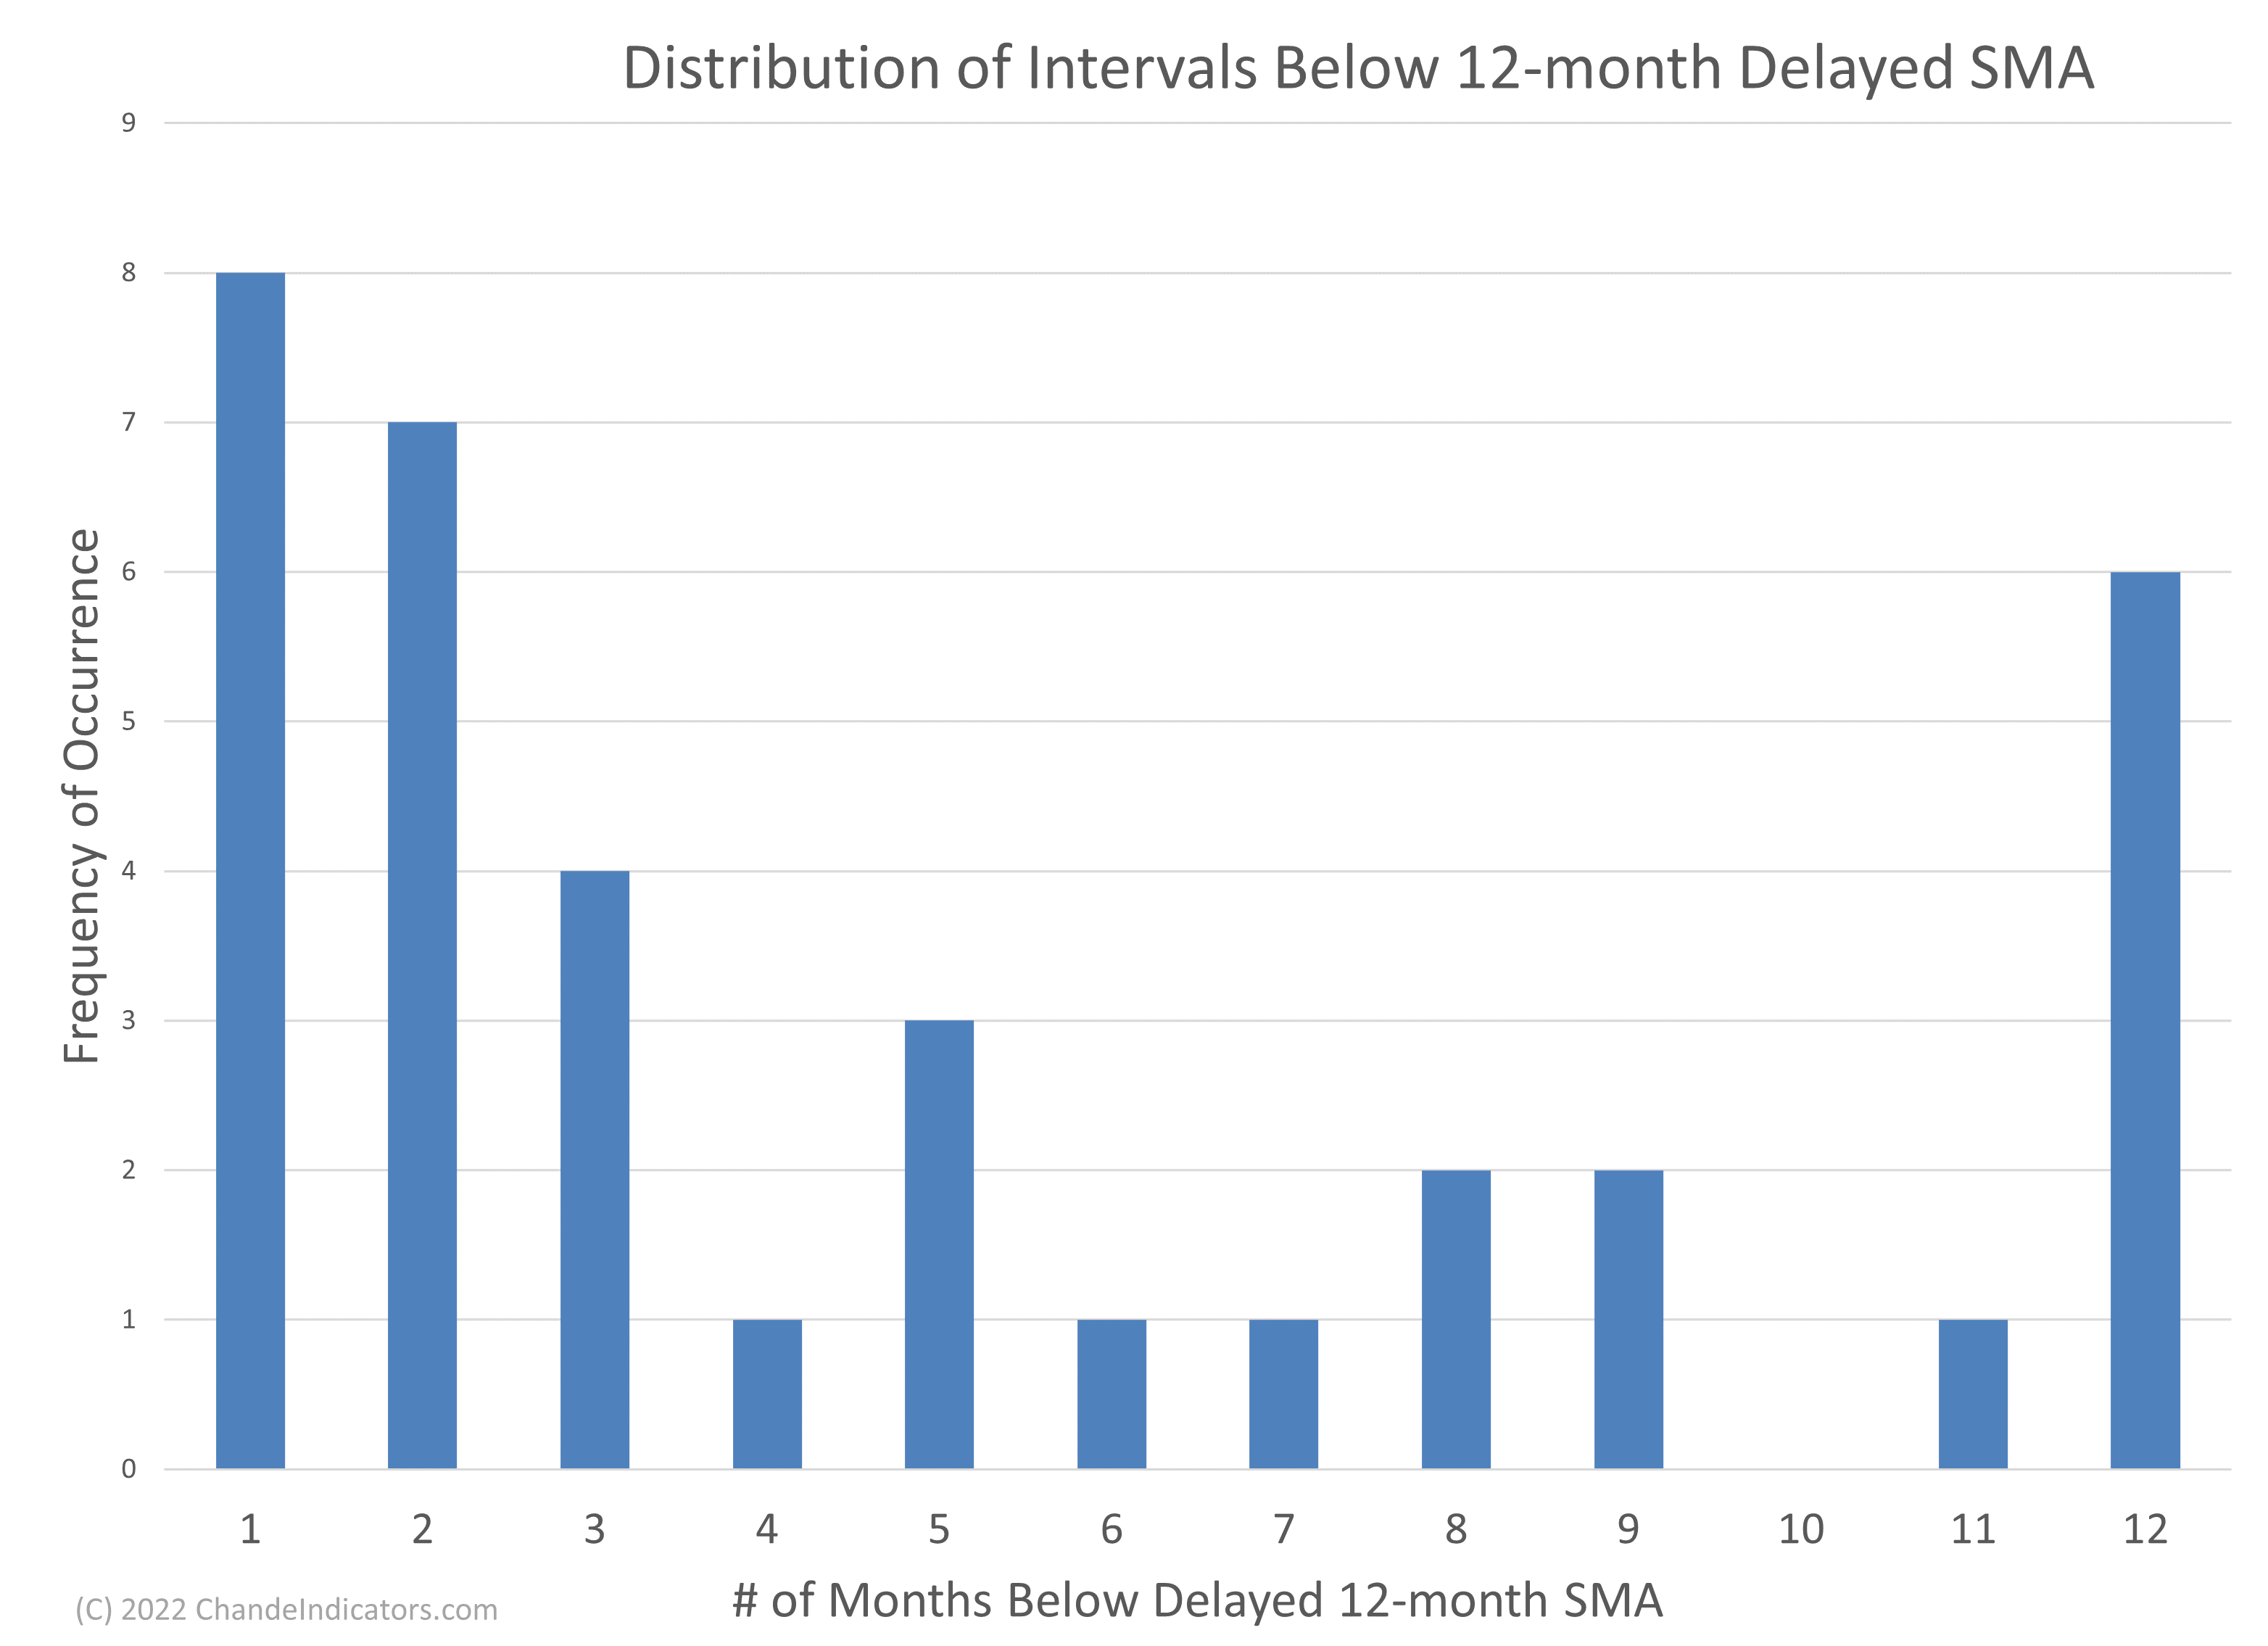
There are a total of 36 “strings” or sequences of market closes below the SMAC. The average length of a decline was 6.3 months, with the longest lasting 31 months. As the frequency distribution shows, seven episodes were longer than ten months.
Why use monthly closing data?
We smooth out volatility in the data by using the “monthly closes” format. It keeps us out of persistent downtrends. It also reduces the number of trend changes detected by the model. Besides, the model is easy to maintain manually or using charting packages. One also needs to check the model only once a month, which is not an insignificant benefit.
Why use a 12-month SMA?
First, a simple moving average is easy to calculate, and the 12-month period is typical of econometric and other analyses. Second, unlike exponential moving averages, the SMA has no memory since the oldest data drops out of the calculation when the new one arrives. One could use a more extended look-back length, say 24 or 36 months, but because recent market action has compressed moves of enormous amplitude into weeks (instead of years), I would favor using the 12-month time horizon.
Why use a delayed SMA?
Since we know the previous monthly close at the start of a new month, the 1-month delayed 12-month SMA value used to determine a trend change remains constant throughout the new month. Making a case for delays longer than one month is problematic because it would increase the lags with which signals occur. We have already slowed the signaling process by using monthly instead of daily data, and there is little incentive to slow the model’s responsiveness further.
What are the strengths of the model?
First, the model will keep you out of long downtrends, say those lasting longer than six months. Second, it will keep you on the right side of long-lasting uptrends. Third, the model is simple to calculate and maintain. Fourth, the interpretation of the trend is automatic and unambiguous.

What are the weaknesses of the model?
First, the model is slow to respond (by design). As moves get compressed in today’s markets, this could be frustrating.
Second, if the market consolidates near the average, you can be whipsawed, i.e., the market can reverse this month’s change in direction the following month. Finally, observe that the 1-month “trend” frequency is the highest in the frequency distribution, implying that during a down-trend, the market could rise briefly above the SMAC only to reverse lower again (or vice versa during uptrends).
The third major weakness of the model is that it will never “catch” the high (or low) of a move since it is following a heavily smoothed trend. Hence, entries and exits may seem very slow compared to other models, or the price moves from highs (or lows).
Wrap-up
My posts should give you a good starting point, with context and suggestions if you like to research. Then, you can visit my website, chandeindicators.com, for more information and ideas. I hope you stay tuned and help by subscribing and recommending it to your friends and colleagues.
Thank you for spending some time with me.
Disclaimer
And now for some housekeeping. This publication is for “edutainment,” education, and entertainment, not for investment advice. Past performance is not necessarily indicative of future results. Our disclaimer at chandeindicators.com is included herein by reference.