
Where 35%=100%
Wall Street talks itself into a recession. We check the data.

Overview
Wall Street has talked itself into a recession, even though a typical estimate put the recession risk at only 35% sometime over the next year (or two). An excellent summary of this view appeared in the Washington Post.
Analysts are busy lowering their year-end forecasts for the S&P-500 index. Here is one such evolution over the past six months: 5100-4900-4700-3600. Here’s another: 5250-4750. Yes, that’s why they get paid their millions.
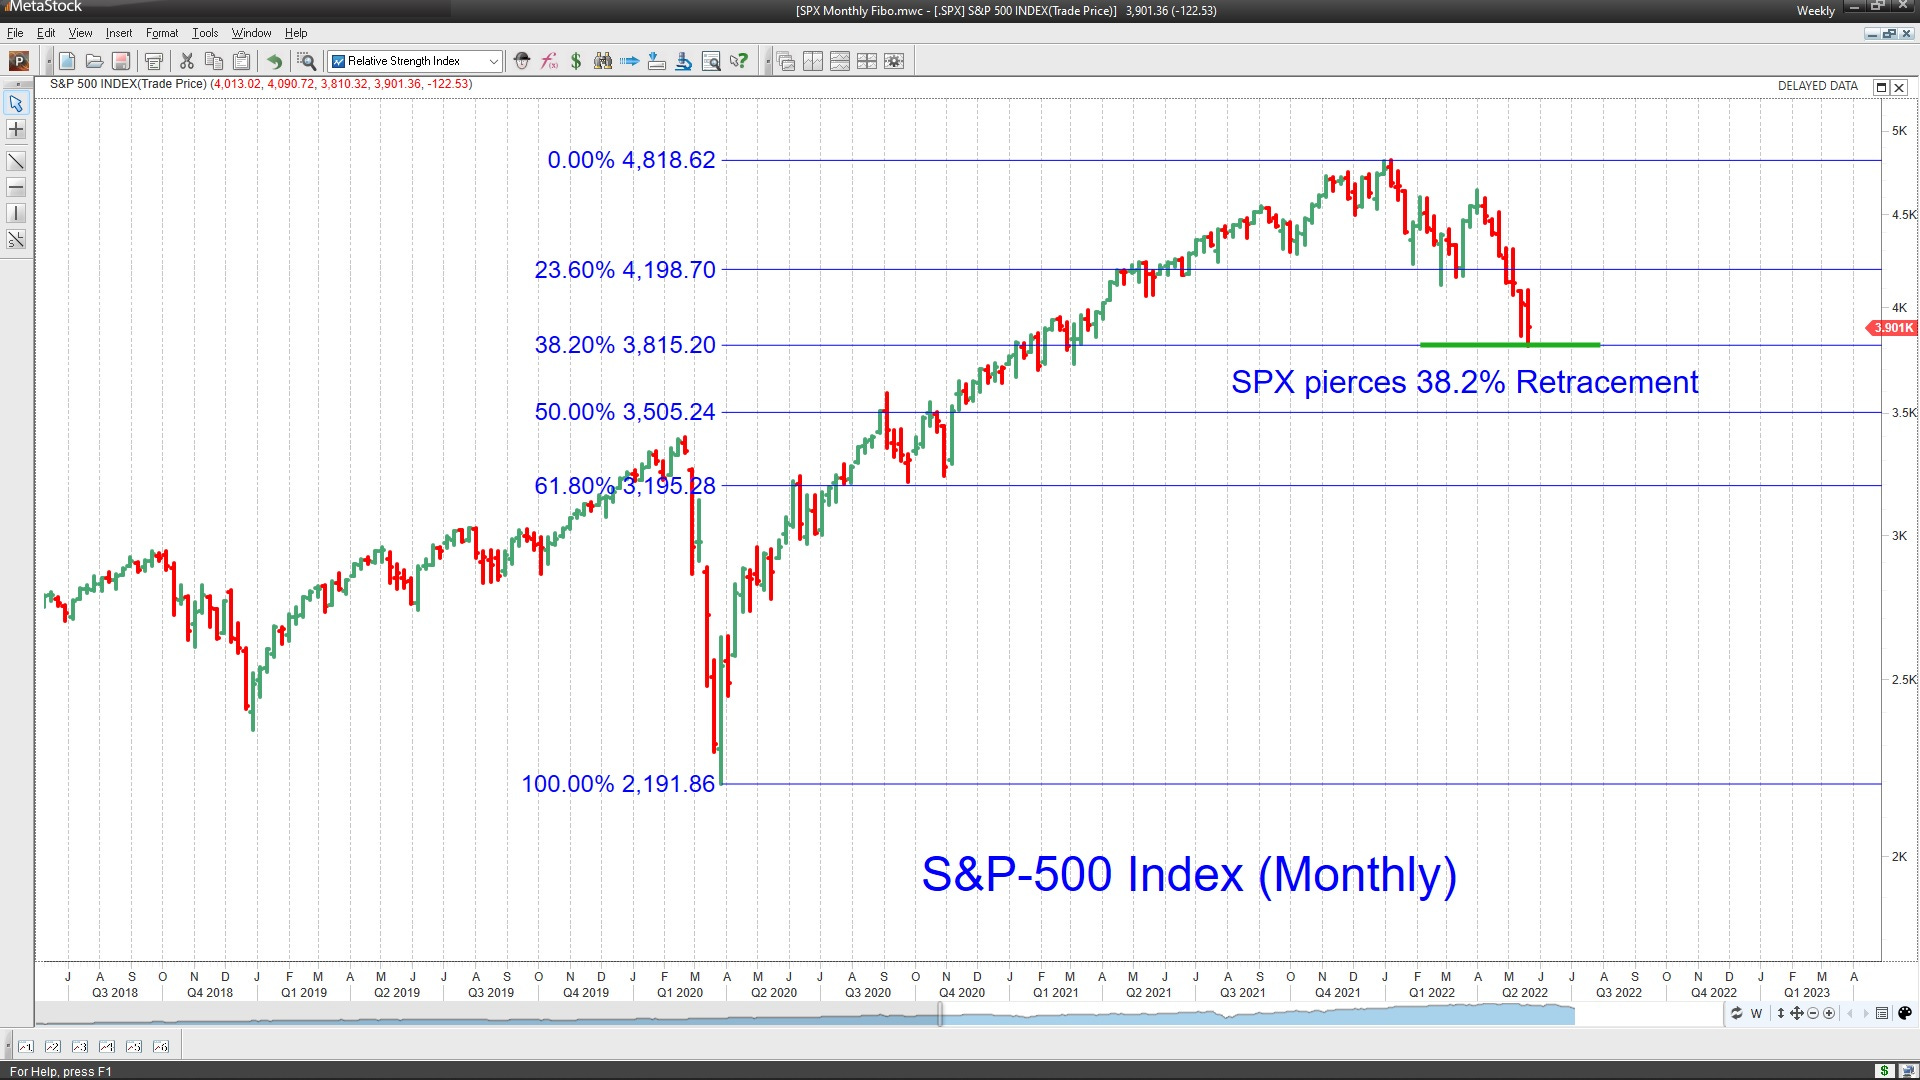
A weak earnings report from Target was the latest crack-in-the-consumer scare to launch another 4% decline. Perma-bears growled with dire predictions of 3000, and as a result, the SPX pierced the 38.2% retracement of its previous rally.

Ordinarily, we should see support at these levels of retracement. (Chart courtesy MetaStock.) Meanwhile, back in the real world, interest rates have stabilized (as expected, below 3.18%, see here and here), Shanghai started to reopen gradually (as expected), and Russia’s entire campaign in Ukraine may be close to culminating. Altogether, these should alleviate some of the market’s anxiety.
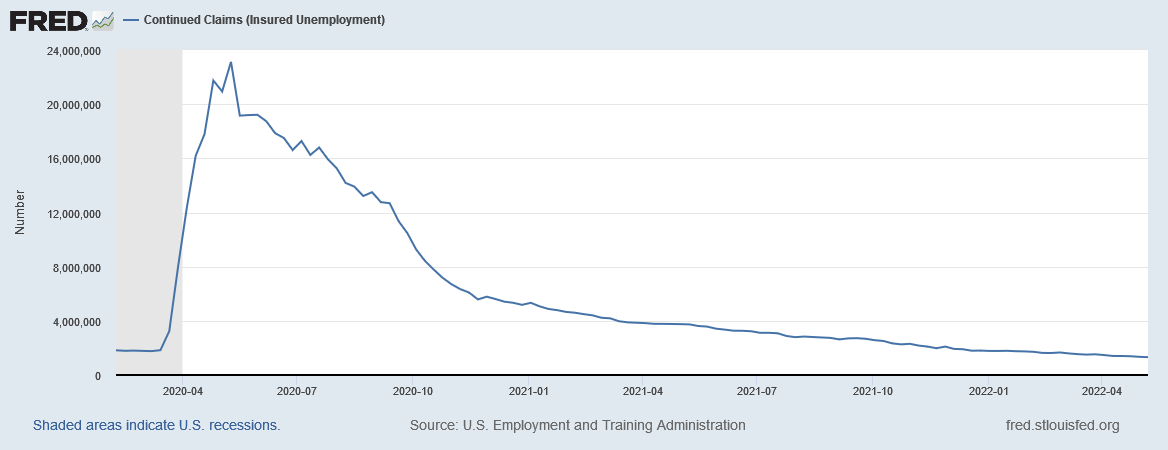
Economic data show that the Atlanta Fed US GDPNow estimate hovers around 2.4% for the second quarter, and the Continued Claims (Insured Unemployed) series (CCSA from FRED) is still declining.
Also, in the real world, oil prices have not made new highs since March, unleaded gasoline futures retreated a bit, and natural gas futures seem to have made a lower high. Further, corn and soybean prices have moved sideways for the past two months, and wheat futures may have made a double top. Thus, the inflationary pressure from food and energy prices seems to have stabilized.
In the bond market, the 2/10 spread is positive (2-year T-Note Yield at 2.587% is less than 10-year T-Note at 2.788%), not implying significant recession risk.
For the past four weeks, the VIX index has traded between 25-37, suggesting that the market’s volatility, though significant, has not risen uncontrollably. However, the VIX index futures term structure still shows some stress during declines.
Key Question
Is this the start of another multi-year drawdown, like 2000-2003? We answer this question by reviewing economic data.
Performance Review
We endured another week of heavy selling after a brief three-day respite. However, the SPX is oversold on the monthly chart, and a decent rebound could be near.

After bouncing just a bit on the brief rally, the net bull/bear balance is firmly below -60. So the bears have good momentum, and all the bulls have is an oversold condition.

The SPX tested its 38.2% retracement, and ordinarily, it should offer support. However, the selling has been unrelenting, and we need better news on inflation to turn the ship around.
Wall Street is Talking Itself into a Recession
We begin with a long-term, monthly chart of the S&P-500 index, with the 2000-2003 decline visible at its left edge. Next, I applied the 2000-2003 trendline to the current downtrend to judge a successful reversal. Hence, I feel three consecutive monthly closes above the trendline should be sufficient.

The upper panel has the 5-period RSI, and this indicator is just nudging into oversold territory. So, at a minimum, we should expect a bounce. Note that in 2000-2003 it bounced around the 30 RSI value for two years, so a bounce here does not mean the downtrend is over.
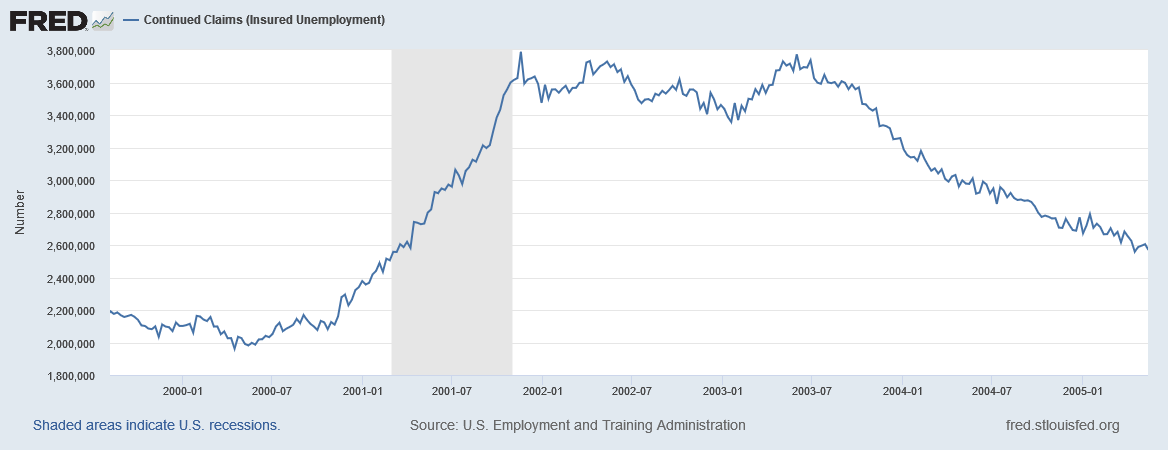
Next, we look at unemployment insurance claims using St. Louis Federal Reserve data. Note how these claims began to rise steadily in late 2000, and then even though they went sideways till 2003, the market did not bottom until it was clear that unemployment had started declining.
You can see the current insurance claims trend below. The emergency economic hard stop due to COVID-19 led to a rapid surge in 2020. Since then, claims have fallen steadily and are still declining. At the very least, they are far from rising aggressively (as before 2001), to even though Wall Street has factored in a recession, it is not yet showing in this dataset. We need not worry about an imminent recession until this series rises to a new 12-month high.
We use the big brains at the US Federal Reserve for their recession risk models. For example, the NY Fed Yield Curve model for predicting year-ahead recession risk was at 3.7% in April, the latest monthly reading. Similarly, the St. Louis Fed’s smoothed recession probability stands at 0.18%.
I recognize that the Fed’s economic data are published with a delay, and they may lag actual changes in the economy, but it does seem too soon to price in a 100% probability of a recession.
The S&P-500 typically declines 40% during recessions. We have fallen over 20% on somewhat weaker earnings but stable economic data. That seems a bit pessimistic, and a bounce in the SPX is warranted as we await more data.
Inflation readings are clearly at the heart of this fear. However, though many feel inflation has peaked, we won’t get a clear understanding of an effective change in inflationary trends until September 13, 2022. Therefore, the following inflation report is on June 10.
A good discussion of how the numerous price shocks during the economy’s rebound from the COVID-19 pandemic fed into CPI can be found here (via NTRS’s Carl Tannenbaum).
Link to MetaStock Presentation
Here is the link to the Chande Trend Meter discussion to find trading opportunities (my talk starts at about 3H:17M).
Wrap-up
My posts should give you a good starting point, with context and suggestions if you like to research. Then, you can visit my website, chandeindicators.com, for more information and ideas. I hope you stay tuned and help by subscribing and recommending it to your friends and colleagues.
Thank you for spending some time with me.
Disclaimer
And now for some housekeeping. This publication is for “edutainment,” education, and entertainment, not for investment advice. Past performance is not necessarily indicative of future results. Our disclaimer at chandeindicators.com is included herein by reference.