

Weighting Games
Weighting Games
We explore portfolio games with SPDR ETFs

Overview
The August unemployment report came in well below expectations (235,000 reported vs. 720,000 expected) and caused a reassessment of Fed taper tactics.
This week, small-cap stocks broke out to new highs as we expected, confirming a generally bullish market scenario. (But more upside follow-through is needed for confirmation.)
Key market indexes (S&P-500 and Nasdaq composite) made new highs this week.
Key Question
The Schwab Self-Directed Brokerage Account Indicator survey from Charles Schwab for the quarter ending June/21 provides interesting insights into actual investor portfolios. Their sample of approximately 174,000 accounts showed that the most common stock holdings were Apple, Tesla, Amazon, Microsoft, Nvidia, Berkshire Hathaway, Facebook, Alphabet, and Nio. The entire report is worth reading. How can we use this insight? We explore how we can use ETFs to overweight the top stocks in the S&P-500 index.
Performance Summary
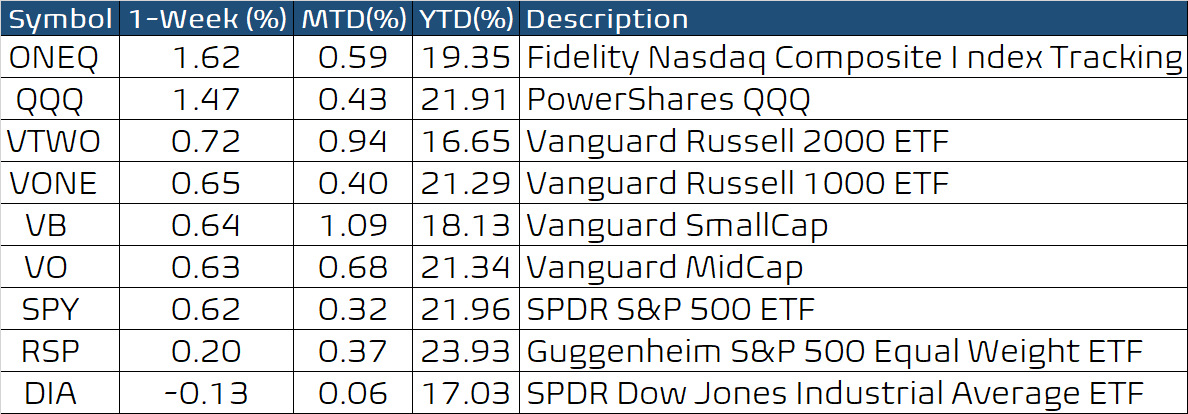
This week, the market held up well despite the weak August unemployment data and the long weekend ahead. Small-cap stocks broke out to new highs, as did the large-cap stocks. Tech stocks rallied, but the breadth was a bit weak, as we can see by the relative underperformance by the RSP equal weight S&P-500 index.
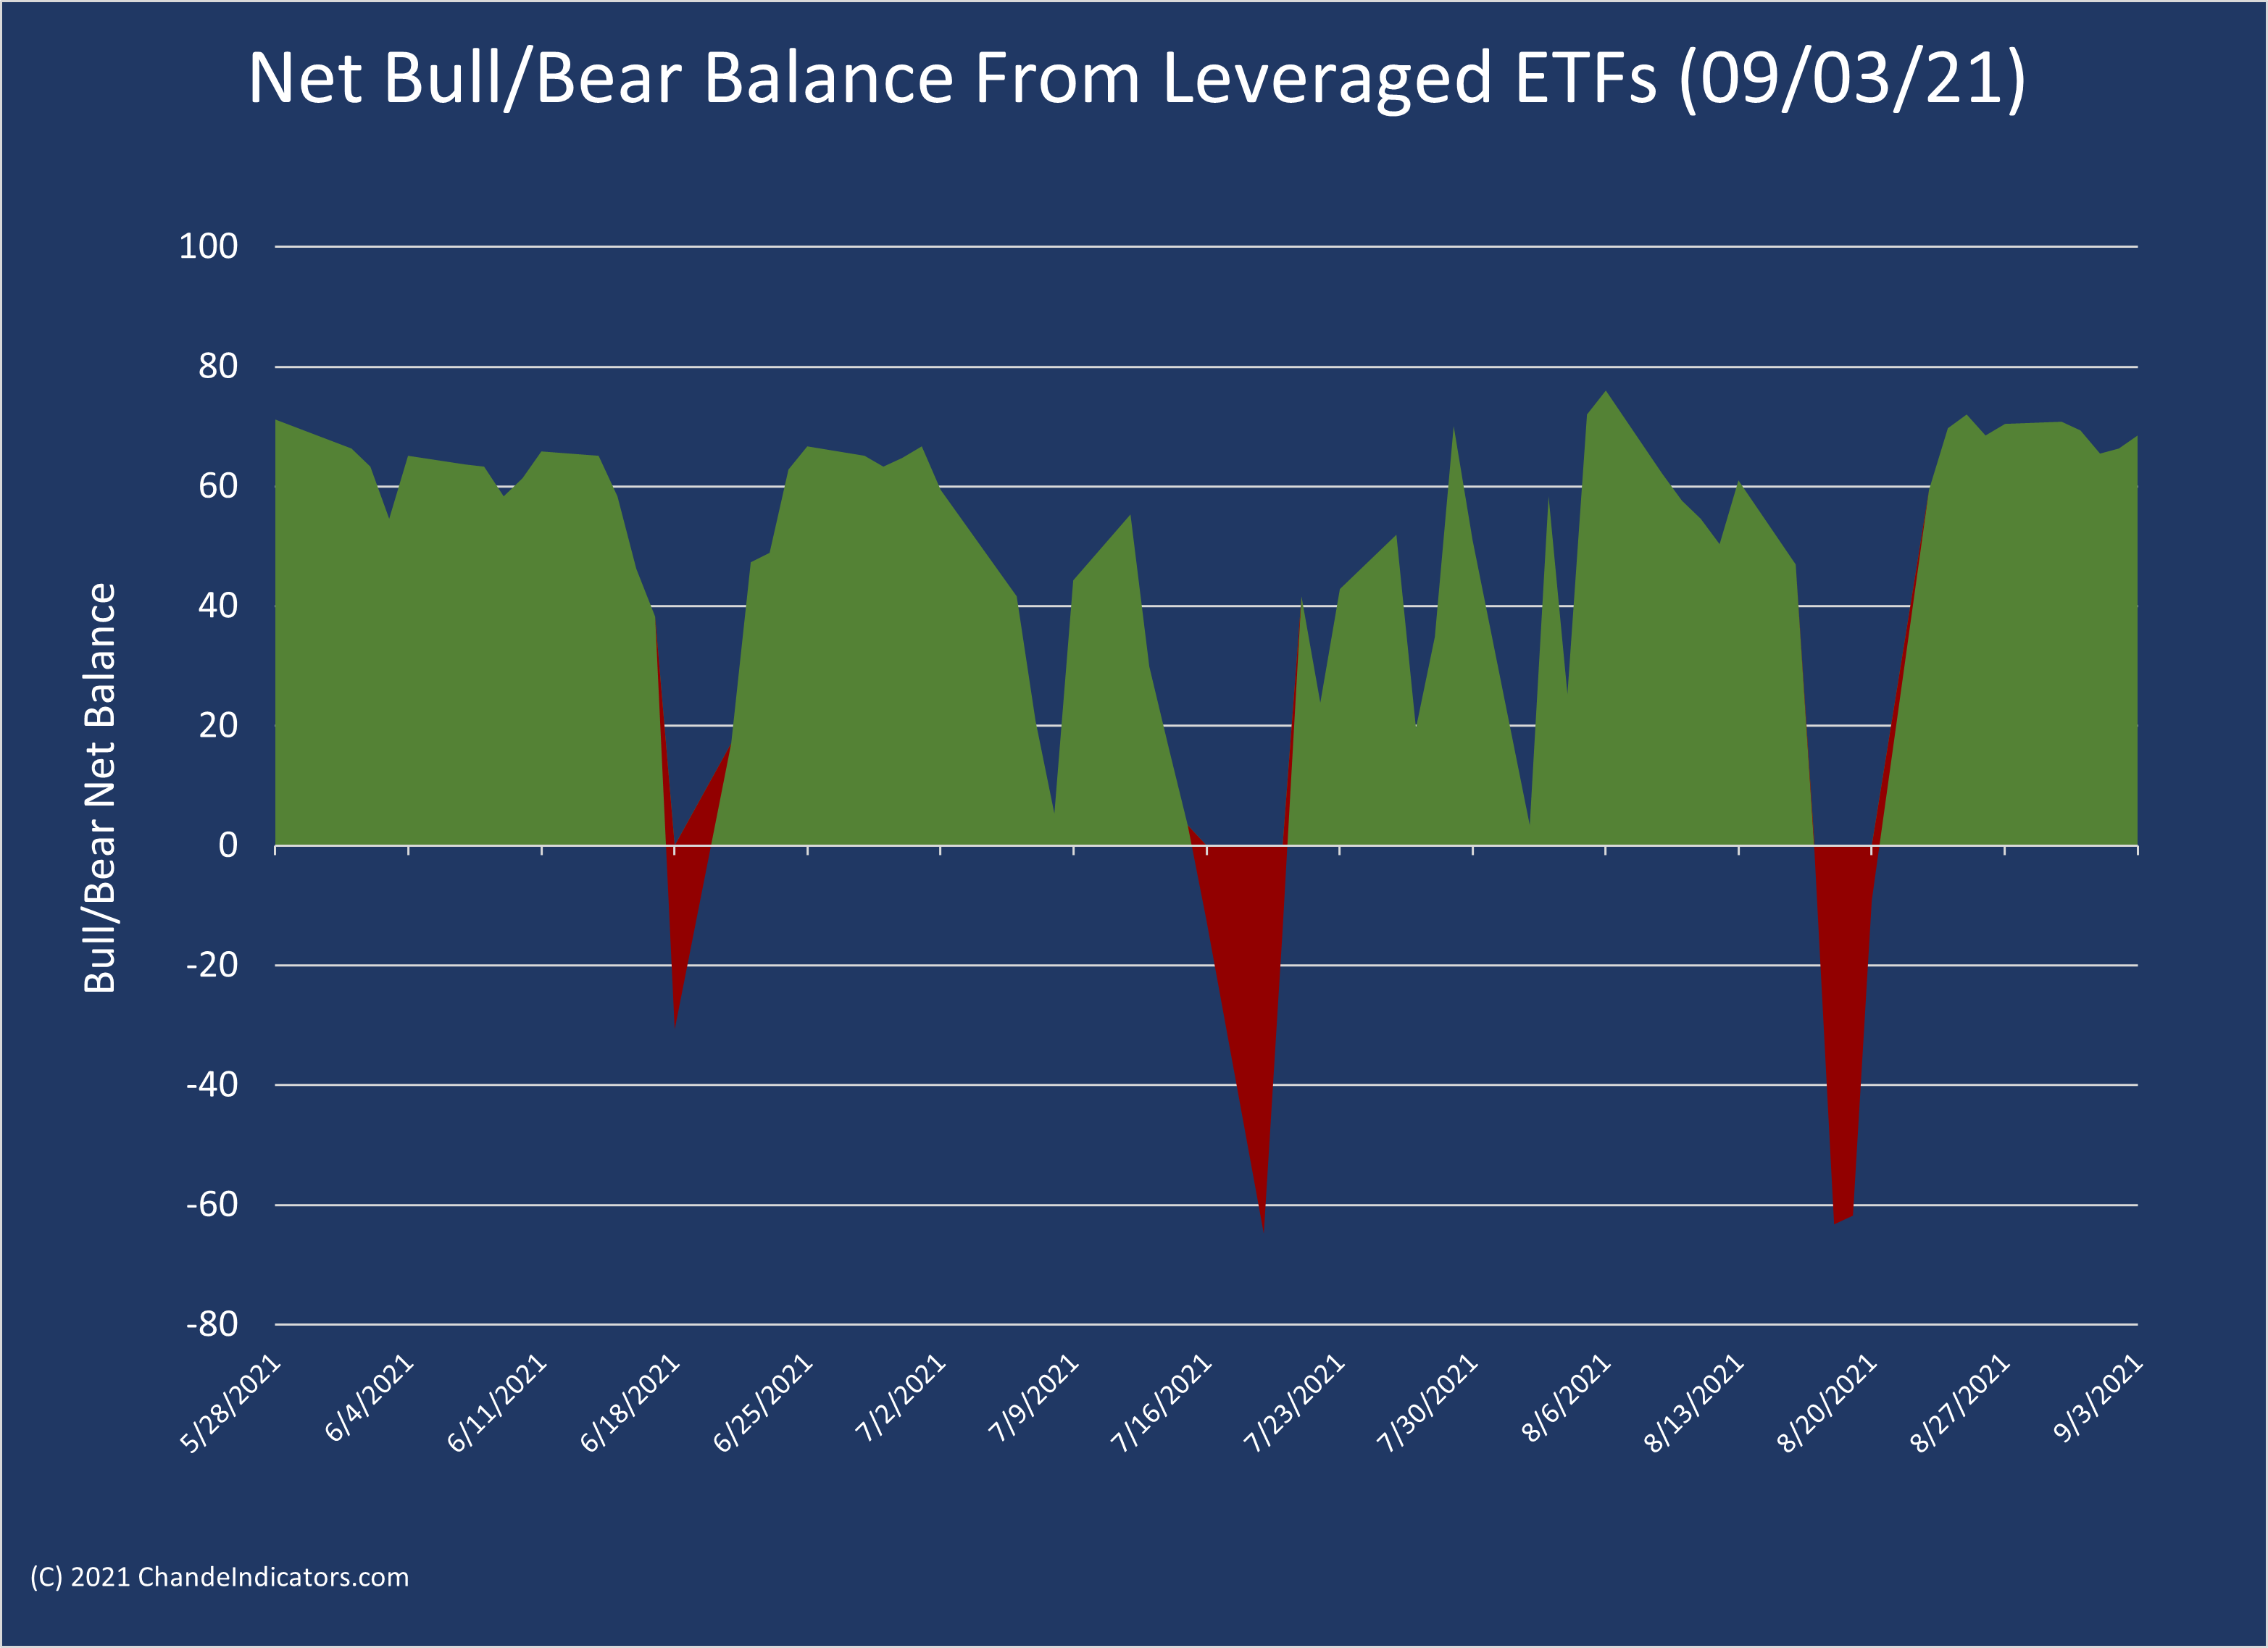
The Bull/Bear net balance from leveraged and inverse ETFs is bullish, but observe that this sensitive indicator has been quite choppy for several weeks. I am hoping that risk appetite has returned with the small-cap stocks at or near new highs.
The unemployment data, which are a bit stale, were affected by the rise in infections due to the delta COVID-19 variant. But portions of the market are signaling that the virus may be behind us. Zoom Video Communications was surely at the very center of the COVID-19 experience, but lately, their stock gapped down this week into major support around 280-283. Other 2020 breakout stars like ARKK, AMZN, and cryptocurrencies are well below their 2020 highs. A breakdown in ZM would perhaps signal the beginning of the end of the COVID-19 phase.

Weighting Games
It is important to recognize that because the S&P-500 index is based on market capitalization weights, the top 10 stocks account for about 28% of the portfolio weight in the index. The top 20 stocks account for about 37.5% of the portfolio weight, and the top 50 stocks account for about 54% of the portfolio weight. Clearly, only a handful of stocks has a major effect on our returns. Hence, a strategy in which you overweight the top-weighted stocks makes sense.
The Schwab survey shows that the most common equity positions in self-directed retirement portfolios were as follows at the end of June 2021:

So, the essential insight is that many actual investor portfolios are built around large-cap stocks. Therefore, it is not surprising that these stocks were among the stocks with the most equity allocations across investor portfolios since they are also among the top holdings in the S&P-500 index. We illustrate this point by showing the allocations in the SPY ETF (data from finance.yahoo.com) and that in the Schwab individual allocations. Note the good agreement between the top stocks in the SPY and those in individual investor accounts.

If we want to follow the lead of the individual allocations but overweight the major S&P-500 portfolio allocations by using ETFs for diversification, we could use the following approach based on SPDR ETFs that invest in subsets of the S&P-500 index itself.
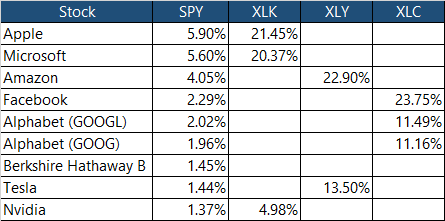
I used data from finance.yahoo.com to find the equity allocations in the SPDR ETFs that invest in subsets of stocks within the S&P-500 index. I used the following SPDR ETFs: technology (XLK), consumer discretionary (XLY), and communications (XLC). The table below shows us that we can play portfolio games to roughly match the top-10 SPY ETF holdings with just these three ETFs. (The table below shows the percentage allocation to a particular stock in the chosen ETF.)
Now imagine investing $30,000 in the SPY ETF or $10,000 each in XLK, XLY, and XLC. What would the resulting portfolio weights be?
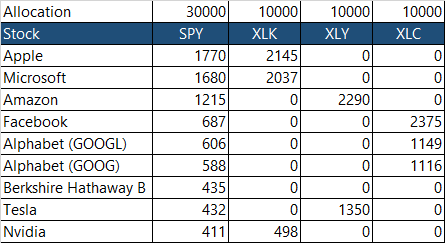
The above table shows that a $30,000 allocation to the SPY ETF yields an effective allocation of $1770 to Apple (5.9% * $30,000). At the same time, a $10,000 allocation to the XLK ETF yields an effective position in Apple of $2145 (21.45%*$10,000). Therefore, to get the following effective allocations, we can combine the positions in XLK + XLY + XLC and convert dollars into percentages.

You can see that we can get allocations ~7%-8% in Apple, Microsoft, Amazon, Facebook, and Alphabet with this strategy. Thus, we can overweight the top few holdings of the SPY ETF with this portfolio construction with greater diversification than owning these same stocks directly. In fact, the XLK+XLY+XLC together account for about 51% of the total portfolio weights in the S&P-500 Index. Thus, this combination is very well diversified versus directly owning the nine stocks in the table.
In the above iteration, we did not include Financials that are in the S&P-500 index, so we did not have any exposure to Berkshire Hathaway or JP Morgan Chase. Below we show another allocation iteration using the SPDR XLF to match the top-10 SPY holdings, but with greater combined exposure to the top-10 holdings than the SPY. We did the calculations with a $40,000 budget to accommodate the fourth ETF (XLF) used for the simulation.
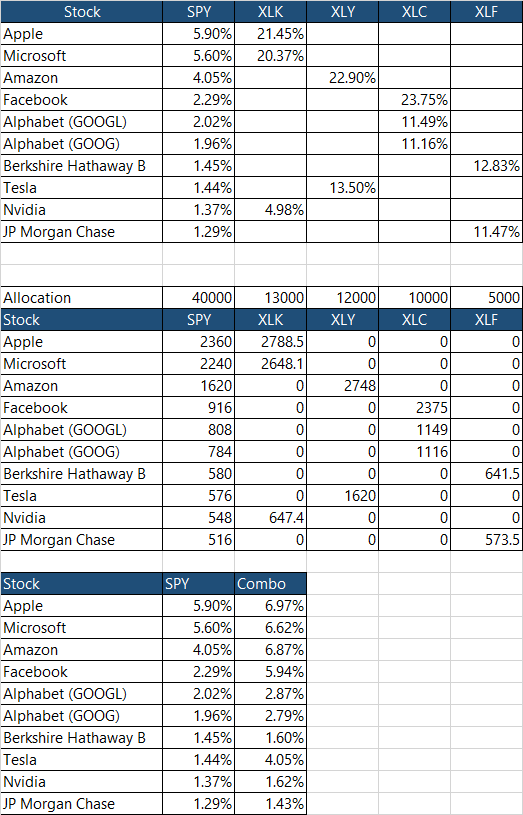
You get the idea. We get roughly equal allocation to the Big Five (Apple, Alphabet, Amazon, Facebook, and Microsoft) better even than in the SPY itself, with excellent diversification. You can experiment with other combinations to get the portfolio weights and exposures you want. Naturally, there are advantages to owning all the stocks in the index itself and so on, but these calculations give you some other ideas on how to adjust portfolio weights. Since the bulk of the index returns are influenced by a handful of stocks, a strategy outlined above that overweighs the top-weighted stocks makes sense. For reference, the combination with XLK, XLY, XLC, and XLF has 27 of the top 50 stocks by portfolio weight in the S&P-500 index, accounting for about 40% total portfolio weight within the index.
Wrap-up
If you like to do your own research, my posts should give you a good starting point, with context and suggestions. You can visit my website, chandeindicators.com, for more information and ideas. I hope you will stay tuned and help by subscribing and recommending it to your friends and colleagues.
Thank you for spending some time with me.
Disclaimer
And now for some housekeeping. This publication is for “edutainment,” education, information, and entertainment purposes only. It is not to be construed as investment advice. Past performance is not necessarily indicative of future results. Our disclaimer at chandeindicators.com is included herein by reference.