

Volatility Expansion Gives Early Warning Of Market Declines
Volatility Expansion Gives Early Warning Of Market Declines
We examine volatility expansion post-FOMC this week.

Overview
The Fed hinted on Wednesday that interest rates could start rising next year.
The fears of that rate lift-off led to strong selling in the market.
We had predicted a possible decline in the market last week, so it was not a surprise.
Rising volatility on Wednesday also gave an early warning of the selling to follow.
Key Question:
With rate fears back in the market, FOMC meetings will now again be a source of market volatility. Can changes in volatility give us clues about market direction?
Performance Snapshot
I said in my last post that I favored a minor pullback. Well, we got that and some more. Only the mega-cap tech stocks held up well. Small stocks took it on the chin, with more selling to come. Nevertheless, the mega-cap stocks buoyed the S&P-500, as we can see by comparing the decline in the SPY (-2.21%) to its unweighted cousin, RSP (-3.63%).

Understanding Volatility
In a post on SeekingAlpha on Wednesday, I suggested that the volatility had toggled into a bearish mode, and more selling was on the way. Here I will show a few more details behind those calculations.
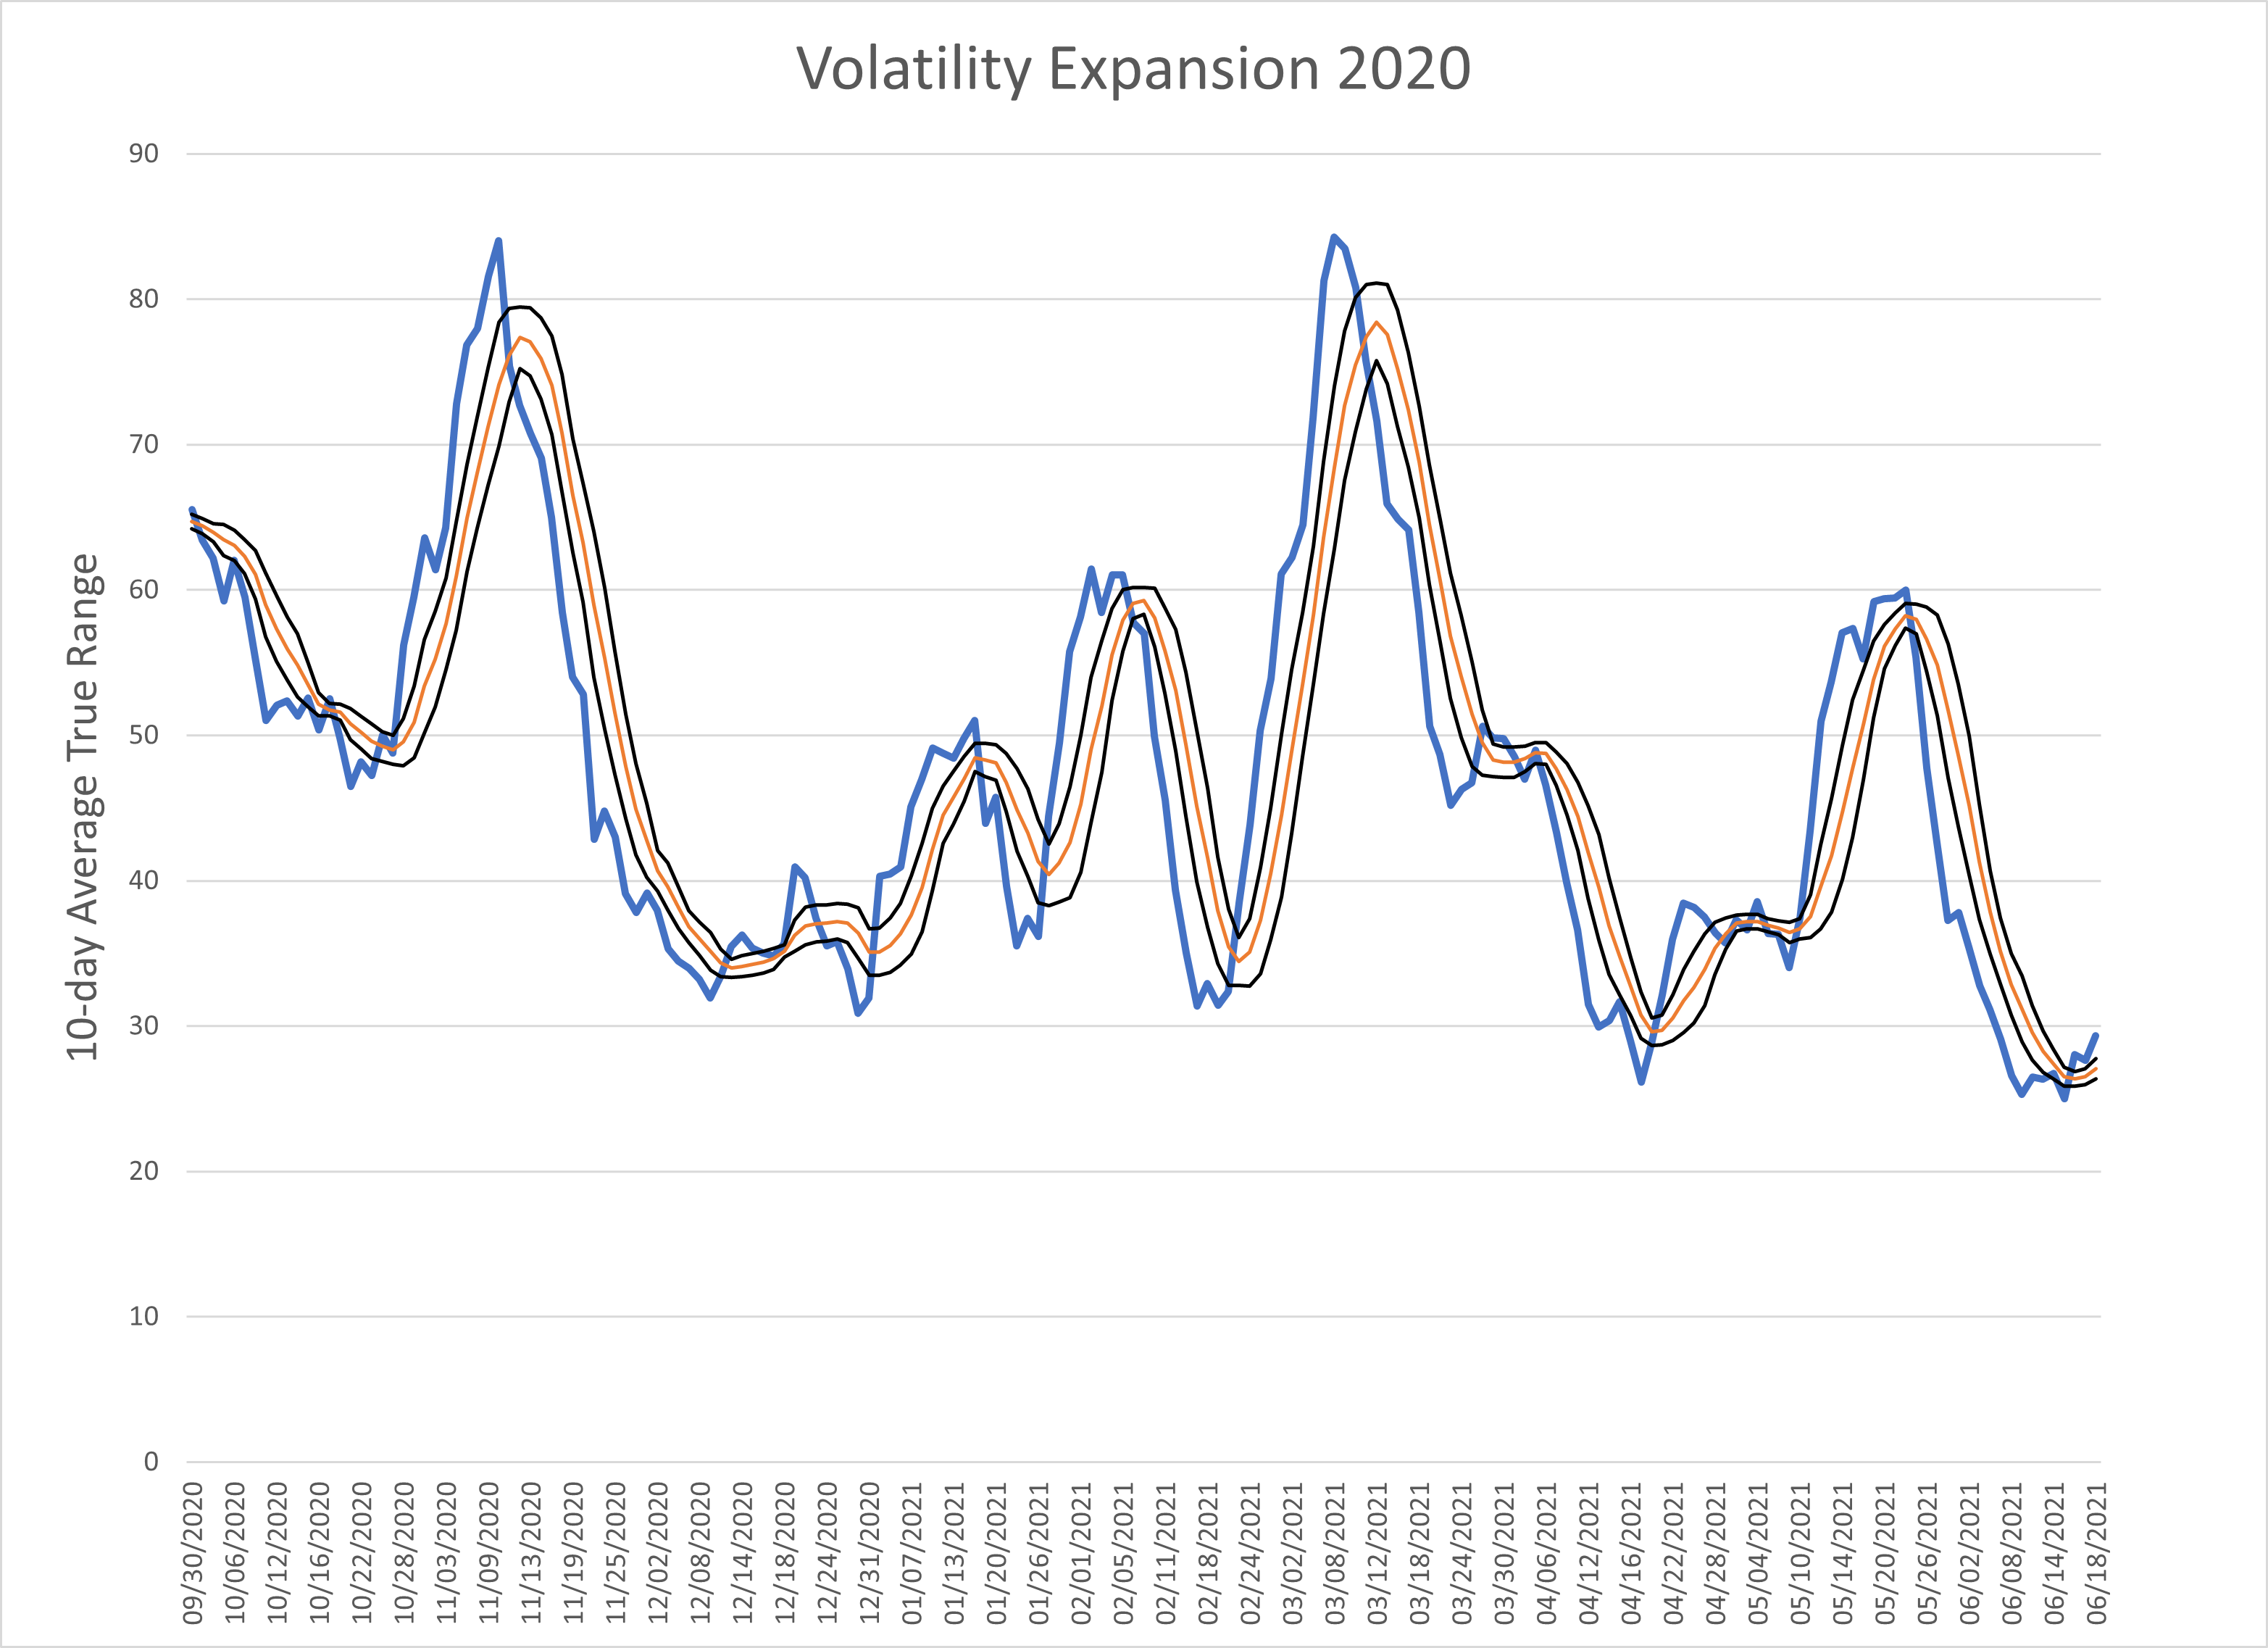
Welles Wilder introduced the concept of true range in the 1970s in the context of commodity trading. He suggested that the true range of prices was the maximum of today’s high minus low, the absolute value of today’s high minus yesterday’s close, or yesterday’s close minus today’s low. He was trying to estimate the amplitude of movement that was most significant to traders.
He then uses a non-standard smoothing mechanism since he calculated values by hand. I choose to calculate a 10-day simple moving average of the true range to describe volatility (denoted by ATR10).
Of course, you could measure volatility in other ways, such as standard deviation or the daily high-low range. For example, if you compare ATR10 to the 10-day standard deviation of the daily closing prices and the 10-day High-Low difference, you get very similar curves, with a correlation of 0.88~0.90. So, the ATR10 is a good measure of volatility.

The cleanest example of volatility expansion during sell-offs is in the March 2020 data, during the massive market drop due to a global panic stop in economic activity due to the onset of the COVID-19 pandemic. Observe the relentless and enormous increase in ATR10 during the February-March 2020 period, followed by an equally steady decline. Naturally, not every expansion is of this magnitude, as shown in Figure 3, but the idea that volatility expands during declines has solid support in market data.

Moving on to this year, you can see at the right of the graph that the ATR10 started to expand mid-week, after the FOMC statement on Wednesday. So, volatility expansion can give us a clue about an impending decline in markets. However, volatility expansions are not alike, and some of them will be premature or unsuccessful. Nevertheless, when volatility begins expanding, traders should pay attention.
Stocks that Stood Out
Two stocks that stood out this week were Nvidia (NVDA) and Adobe (ADBE), both making new highs on Friday despite the heavy selling across the market. As a result, both stocks are now in the top-10 or so on our Stock Finder table when ranked by the sum of scores column.

Wrap-up
If you like to do your own research, my posts should give you a good starting point, with context and suggestions. You can visit my website, chandeindicators.com, for more information and ideas. I hope you will stay tuned and help by subscribing and recommending it to your friends and colleagues.
Thank you for spending some time with me.
Disclaimer
And now for some housekeeping. This publication is for “edutainment,” education, information, and entertainment purposes only. It is not to be construed as investment advice. Past performance is not necessarily indicative of future results. Our disclaimer at chandeindicators.com is included herein by reference.