

Three Wars = Bear Market
Three Wars = Bear Market
The S&P 500 has declined ~20% from the January 2022 high.

Overview
As expected last week from the Vanguard Russell 2000 ETF (VTWO) breakdown, selling resumed at the beginning of the week.
Inflation was still hot, with the annual inflation rate at 8.3% in April.
The S&P-500 dropped approximately 20% from its January high, so we are practically in a bear market. The approach to the 20% decline itself spurred some buying at week’s end.
As we projected last week and the week before, interest rates steadied, helping the stock market catch its breath.
The broader Russell 2000-based Vanguard VTWO ETF touched its 50% retracement point of the March 2020-January 2022 rally. Likewise, the S&P-500 came within 1.1% of a 50% retracement of its 2-year rally. Elliott wave enthusiasts might recognize the 5-wave initial decline, a 3-wave rebound, and another 5-wave descent in the $SPX. So the charts were supportive, and a bounce was inevitable.
A one-day bounce does not a rally make: strong overhead resistance remains, in 100-point layers, notably at 4300 and 4400 on the S&P-500.
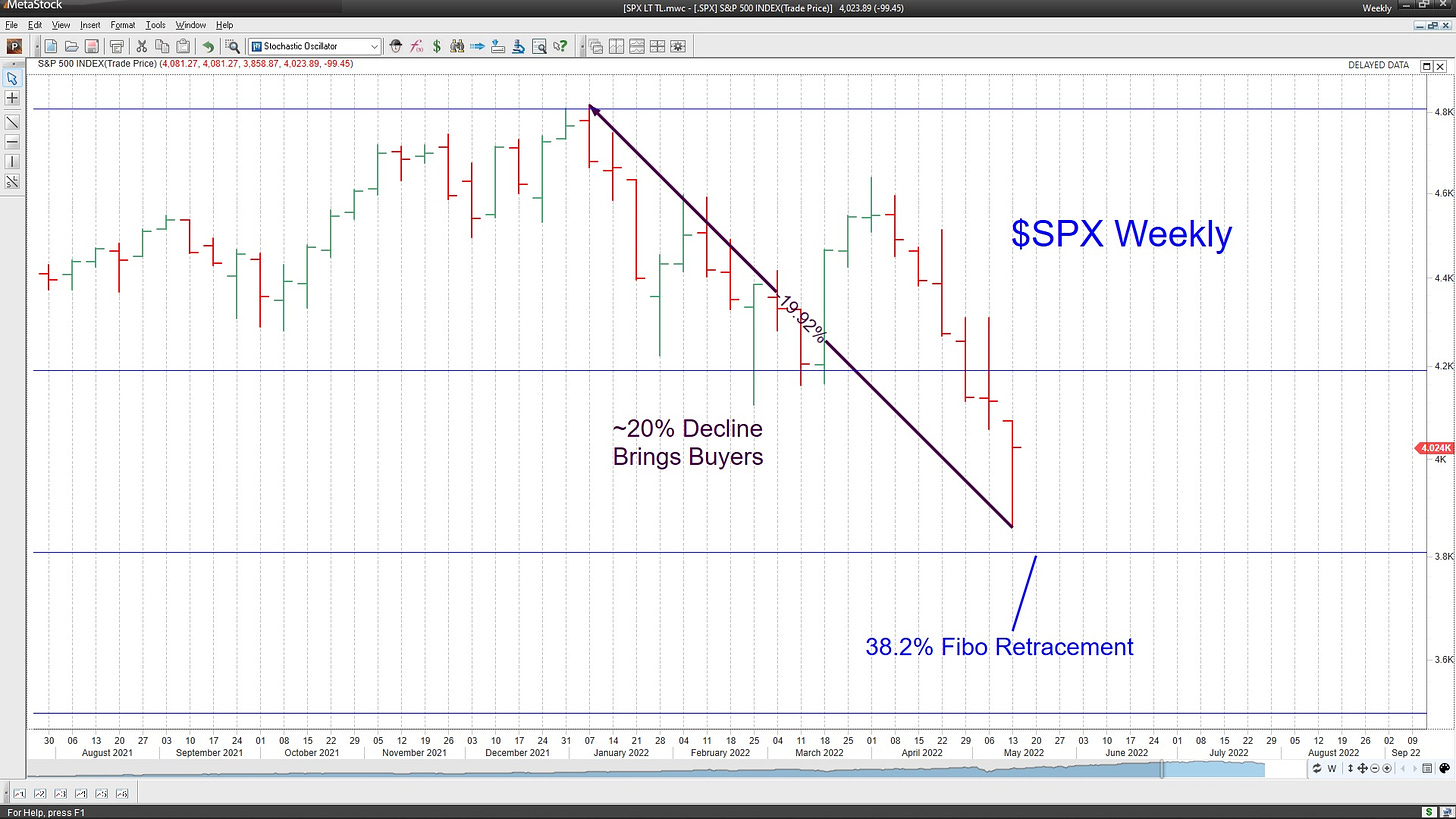
The S&P-500 index has declined nearly 20% from its January high and is ~1.1% above its 38.2% retracement of the previous 2020-22 rally. (Chart courtesy MetaStock.)

Key Question
The market is discounting three wars: in Ukraine (vs. Russia), in China (vs. COVID-19), and at home (vs. inflation). The first two wars stoke inflationary pressures, complicating our domestic inflation woes. For the rest of the year and beyond, inflation data will drive the actions of the US Federal Reserve and hence push market trends. Since the FOMC actions slow the economy after many months, the FOMC is queuing 2~3 half-point interest rate hikes this year to engineer a so-called soft landing, a decline in inflation without causing sufficient demand destruction to reduce GDP growth below zero. Can they succeed?
The war in Ukraine seems to be entering a more difficult phase. Since COVID-19 waves naturally peak and subside, eventually, China will reopen, whether by choice or public pressure, helping untangle its supply chains. Finally, rising rates will slow demand. Hence, inflation will probably peak and slowly decline over 12~24 months. Conversely, we cannot eliminate the risks of an outlier event until the Ukraine war ends and China reopens. So, stocks are looking out into an uncertain world, and the downtrend is probably not over, but their pessimism may be overdone because the US economy and the US consumer are still strong. As I noted earlier, we must wait a few months to let events play out a bit. A broad trading range would work just fine for now, given the mechanical selling of the past week.
Performance Review
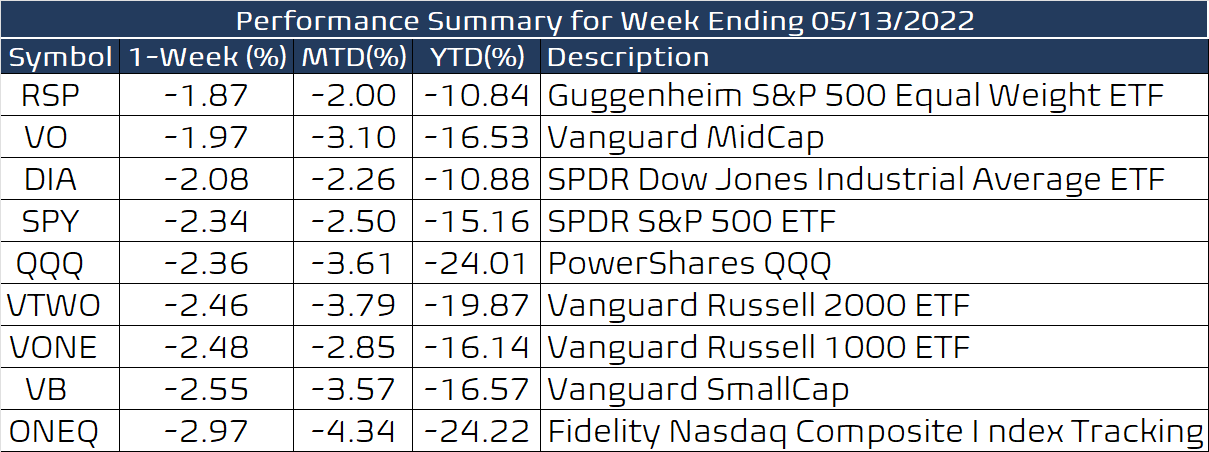
This week's selling took on a life of its own, even as 2-year and 10-year Treasury Note rates stabilized. Finally, we got a decent bounce on Friday, but not before the $SPX was down nearly 20% from its all-time highs. Due to the heavy selling in mega-cap tech stocks, the SPY declines are more significant than the equal weight RSP ETF.
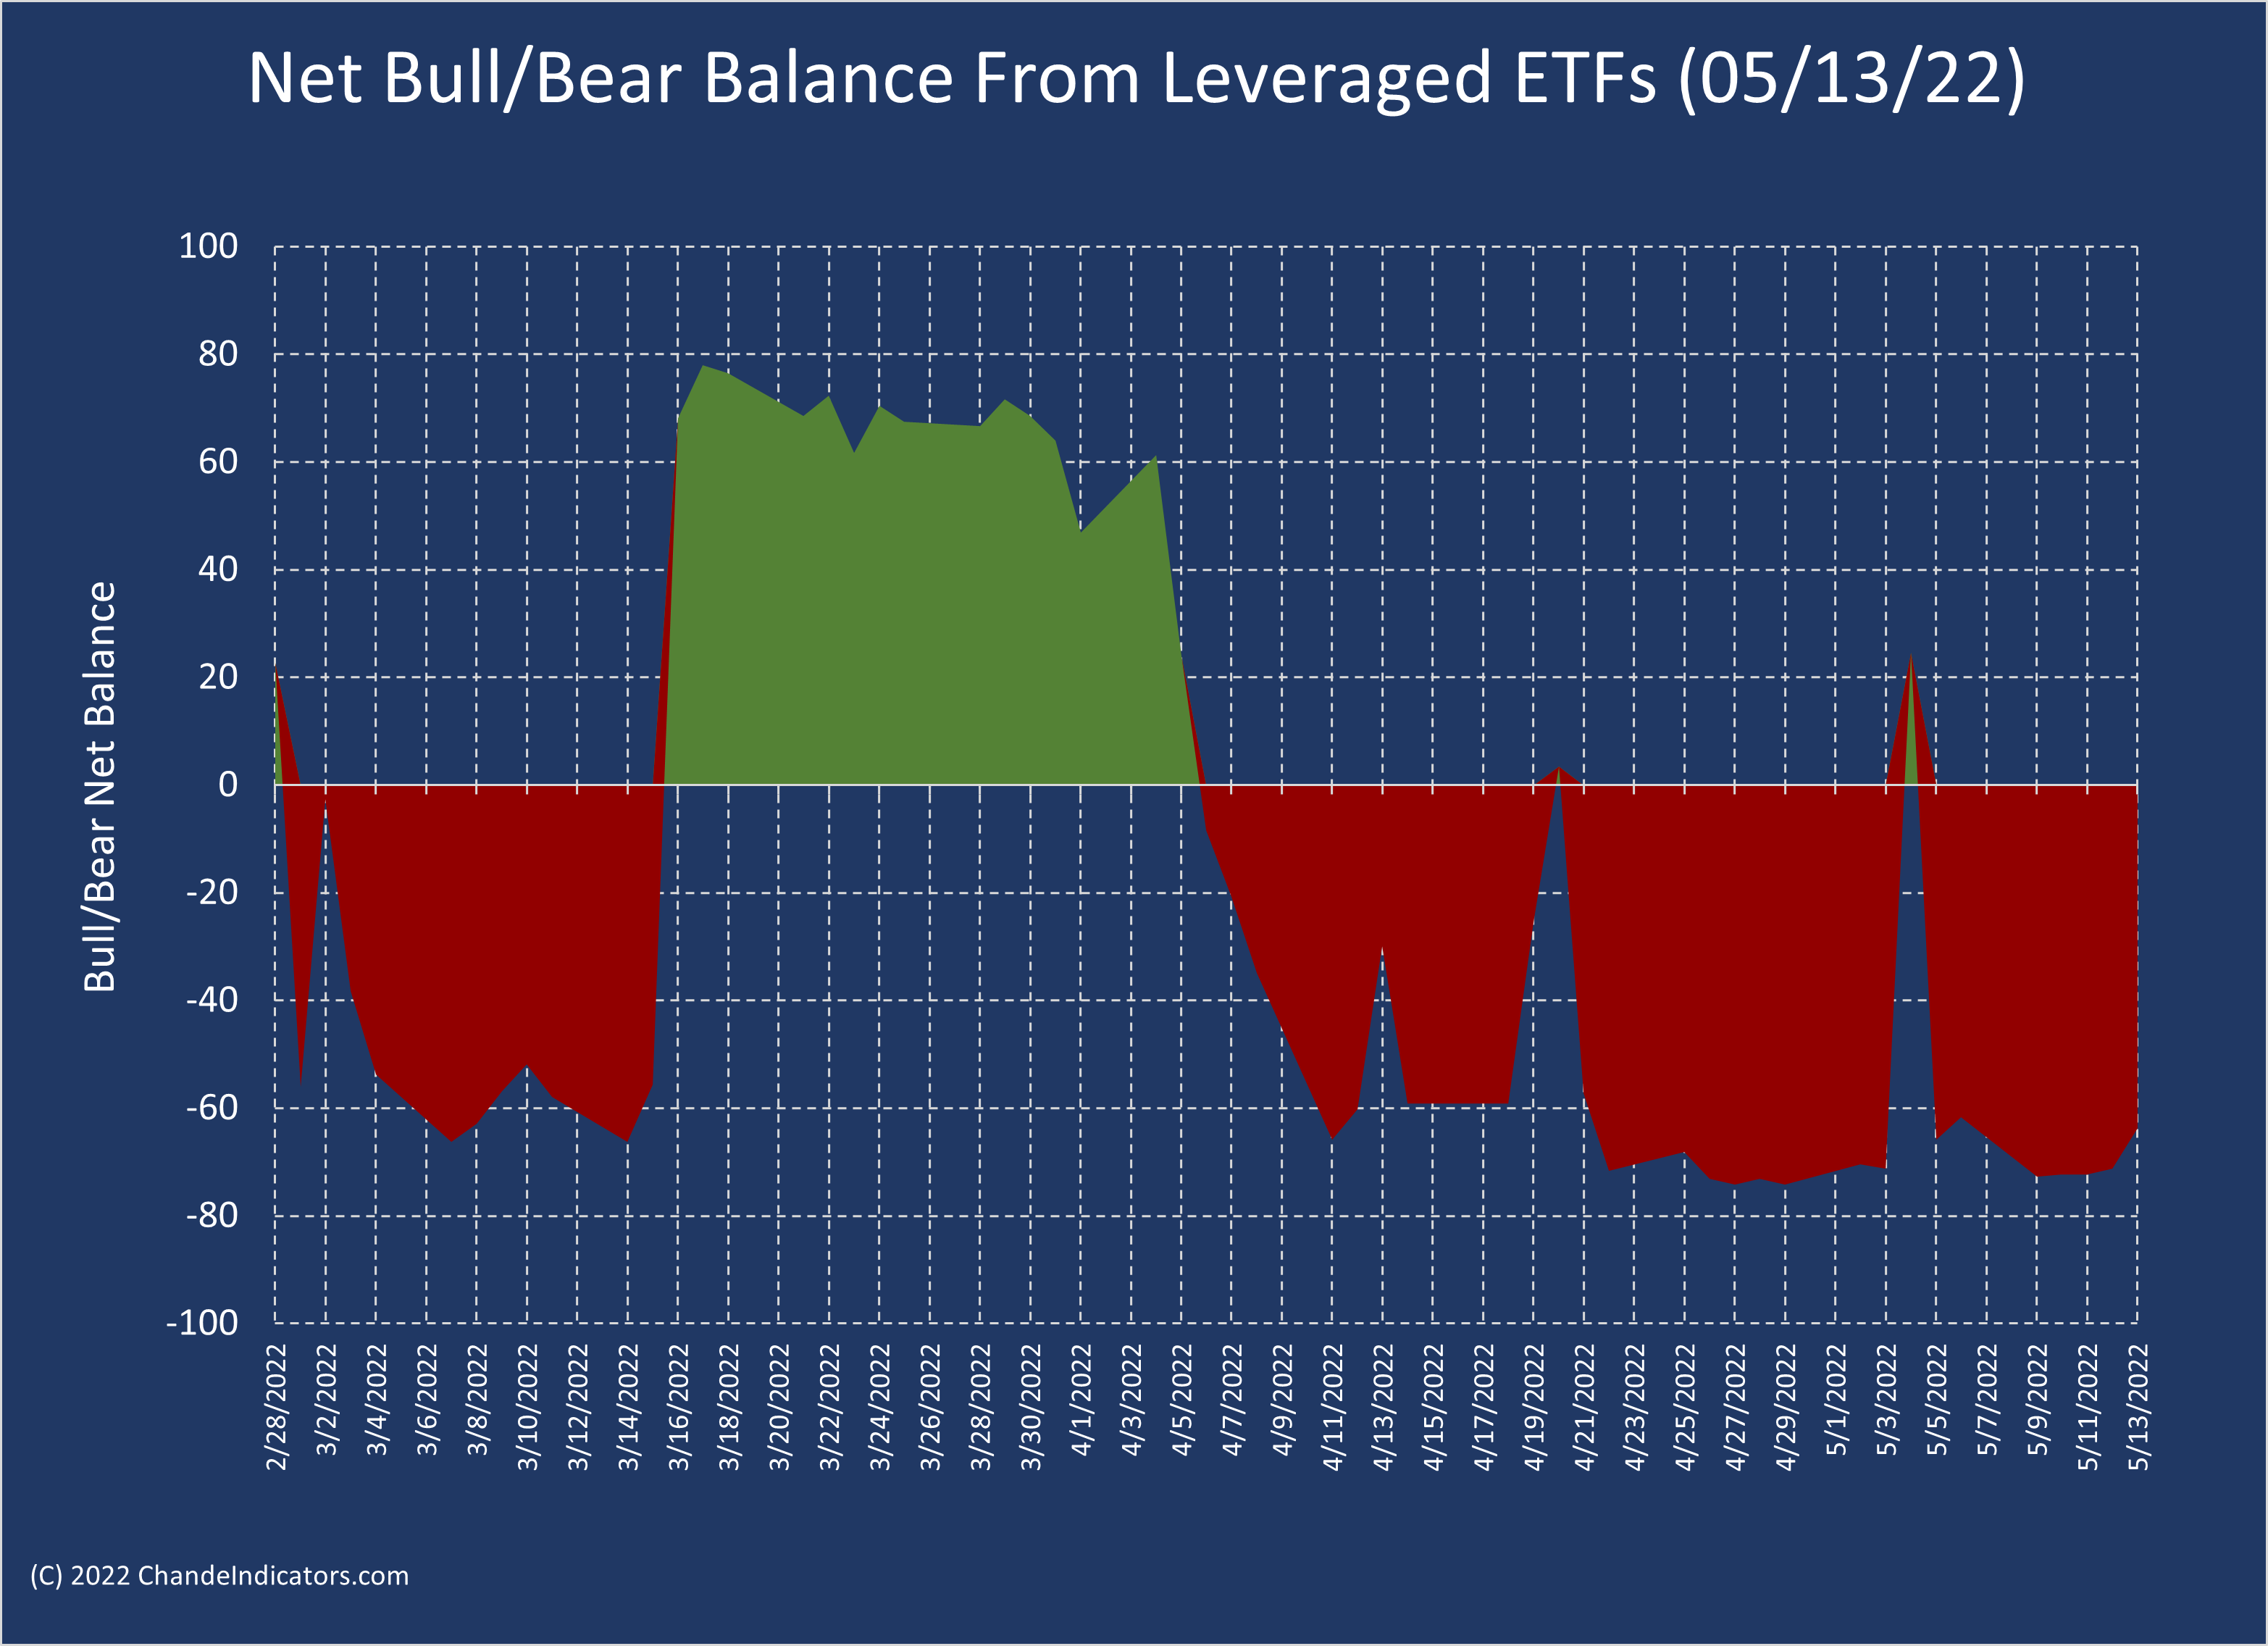
The Net Bull/Bear balance from leveraged and inverse index ETFs remained below -60, indicating a steady downtrend. The bulls have more work to do next week before this indicator eases towards them.
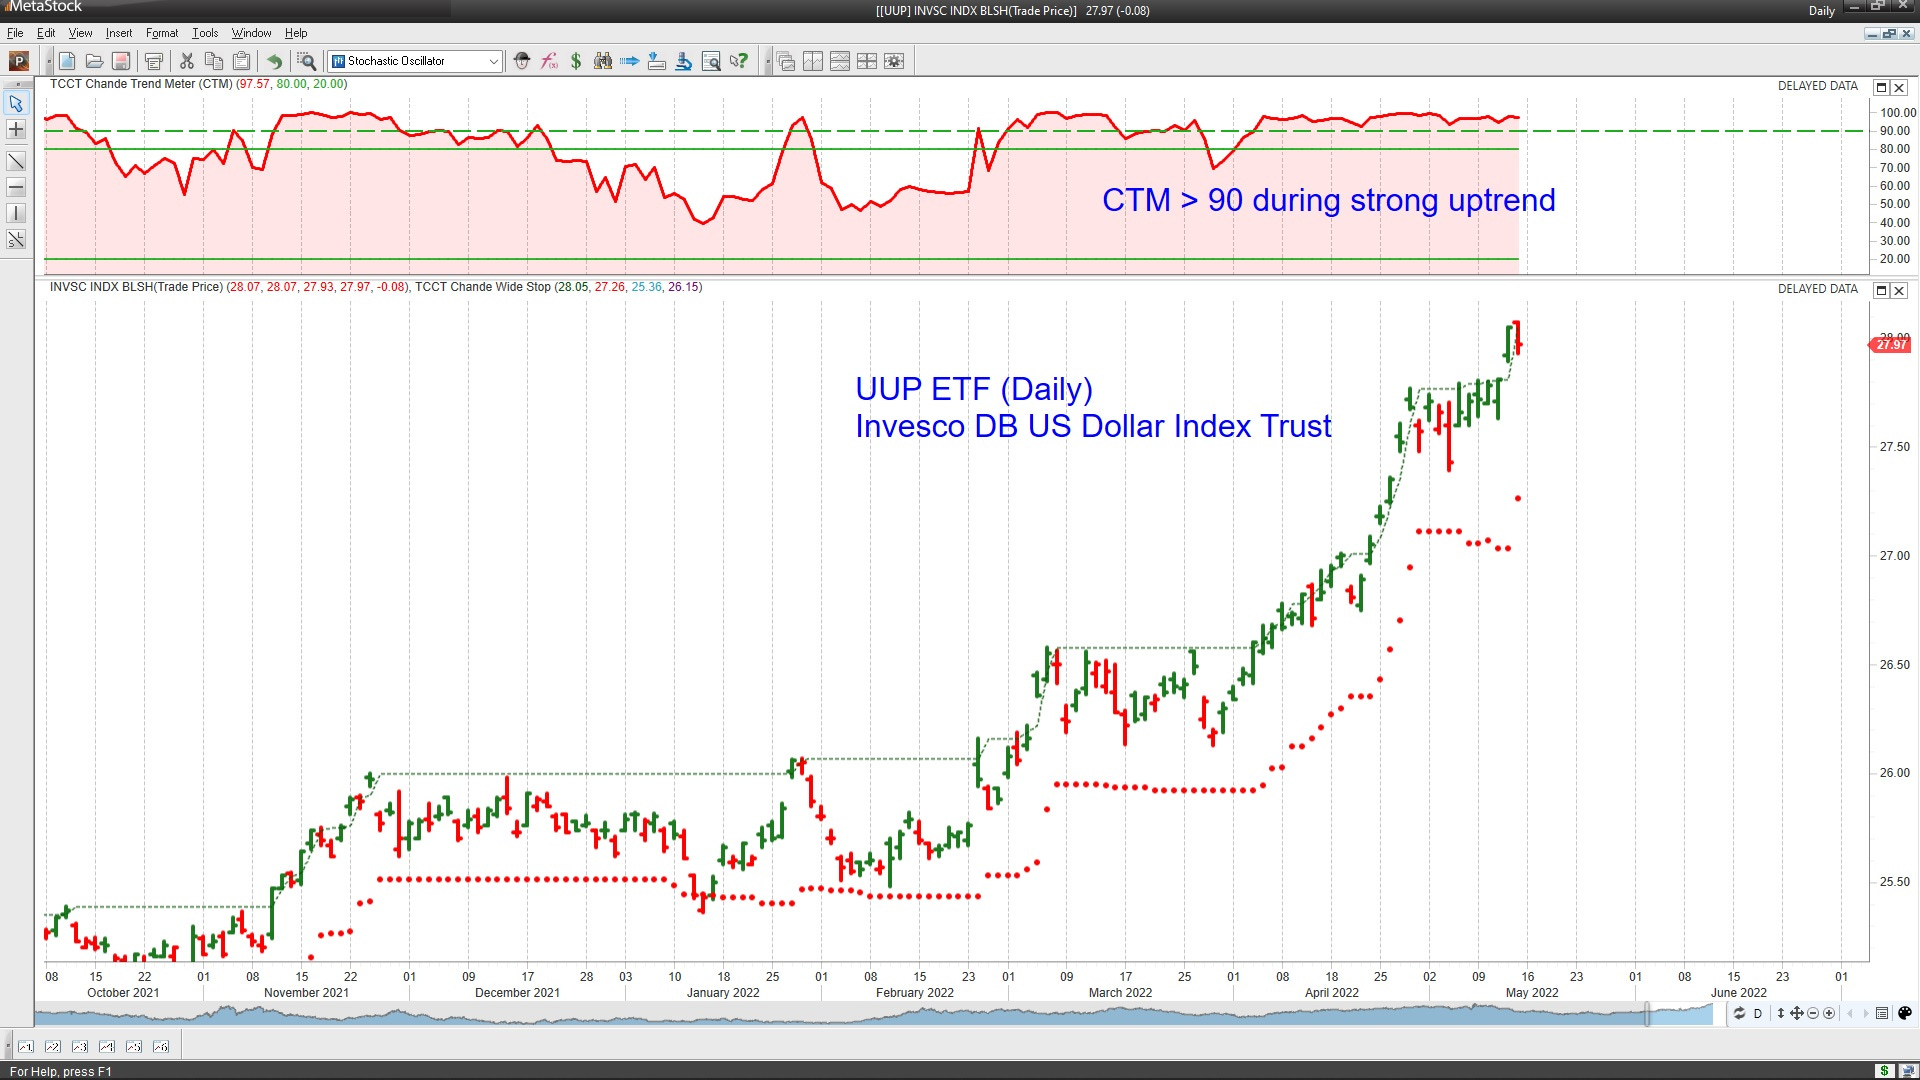
The rising rates have helped the US Dollar, as the chart for the UUP ETF shows. However, the major currency pairs, such as the Japanese Yen and Swiss Franc, are still pointing to dollar strength, so even though rates stabilized this week, the dollar’s strength has continued.
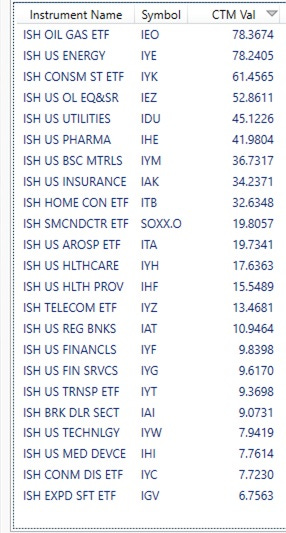
The major US Equity sectors are in strong to medium down-trends, except for the Energy-related sectors, which have pulled back from recent highs. The table below shows the iShares US Equity Sector ETFs ranked by the Chande Trend Meter via MetaStock.
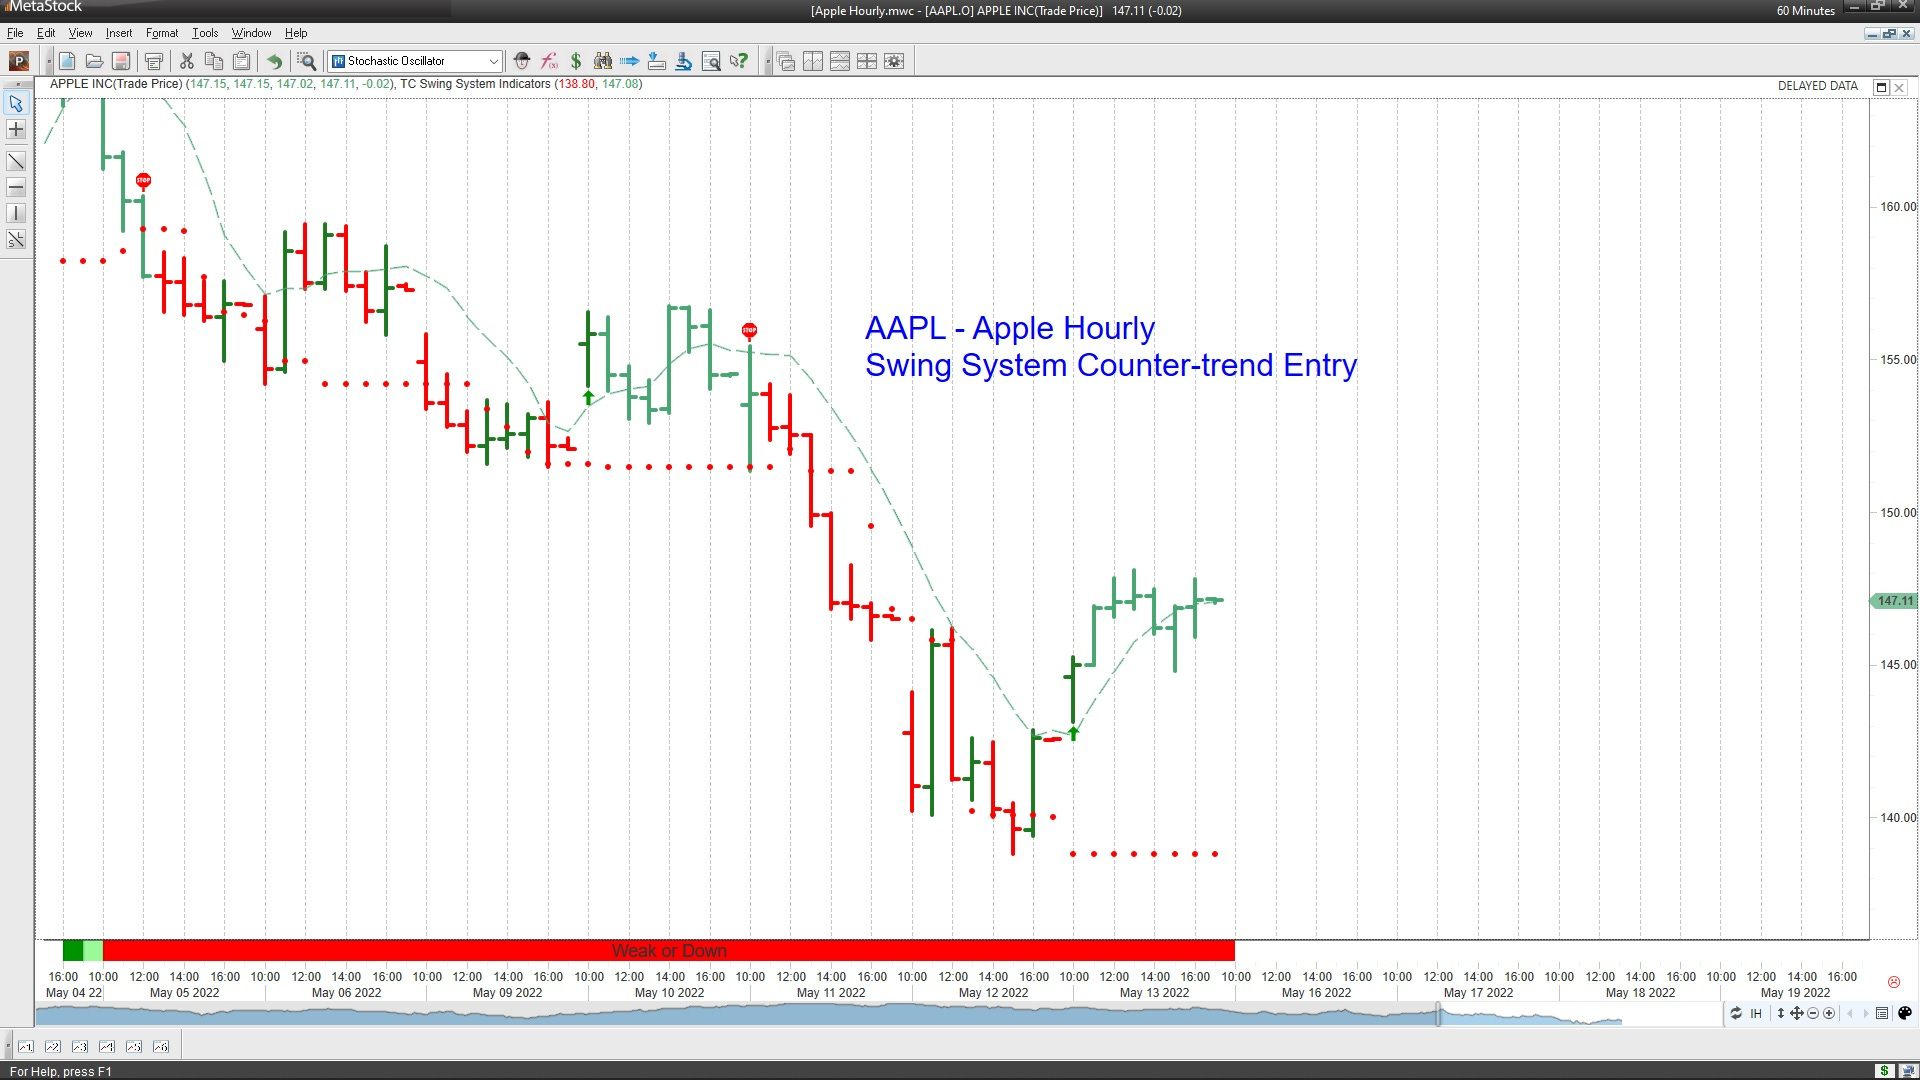
The rebound on Friday was sufficient to generate a long entry into Apple (AAPL) on the hourly chart. However, there is no entry signal yet into Apple on the daily chart, and hence necessarily on the weekly chart. So, we will look for Swing system entry signals to progress towards daily and weekly periods to confirm the rebound.
MetaStock Conference Week Of May 16-20
You're invited to join us at the Online Traders Conference on May 16-20, 2022, sponsored by MetaStock and Technical Analysis of Stocks and Commodities and the Chartered Market Technicians Association.
Thirty-six industry experts are going to show you what it takes to be a successful trader in ANY market with ANY account size. This event is for traders of all levels, and all presentations will be recorded and delivered to everyone that registers.
Register Here to Save Your Space. It's Free
Don't miss a moment: As a bonus for registering, you'll get access to all of the recordings at no charge for you to watch at your leisure. Learn more about the presenters and get more details about their presentations.
Bonus: Door Prizes! All registrants will be eligible to win random drawings for valuable prizes. We will have multiple drawings each day. Don't miss it.*
On Monday at 1:00 PM EST, I will be speaking on “Top Trading Opportunities with Chande Trend Meter.” Please stop by or review their Youtube channel later at your convenience.
Wrap-up
My posts should give you a good starting point, with context and suggestions if you like to research. Then, you can visit my website, chandeindicators.com, for more information and ideas. I hope you stay tuned and help by subscribing and recommending it to your friends and colleagues.
Thank you for spending some time with me.
Disclaimer
And now for some housekeeping. This publication is for “edutainment,” education, and entertainment, not for investment advice. Past performance is not necessarily indicative of future results. Our disclaimer at chandeindicators.com is included herein by reference.