

The MetaBands System
The MetaBands System
Or, how I missed a branding opportunity for my long-term system.

Overview
Key indexes (Dow, S&P-500, Nasdaq Composite, QQQ) closed at all-time highs, as earnings drove the market higher.
The action in QQQ is notable since Apple and Amazon were lower on weaker earnings.
The president announced a framework for his Build Back Better bill but could not break the legislative logjam. However, indications are that the bills may be voted on next week (something to track that might affect the market tone).
Energy stocks backed off their highs after several weeks, ahead of a major climate summit in Glasgow.
Many stocks are breaking out to new highs, so the underlying market momentum is strong.
Key Question:
Facebook rebranded itself into Meta this week. But what does Meta mean beyond “we want to escape our horrid headlines”? Grammarly has a nice post about it. They say the Greeks used it to mean “beyond,” amongst other things. This gives me a chance to discuss one of my favorite long-term unoptimized systems since you only use it when prices are beyond the bands, i.e., a MetaBands entry! (This system is in my MetaStock tool kit, so I really missed out on the branding opportunity by calling it simply the long-term system.)
Performance Summary
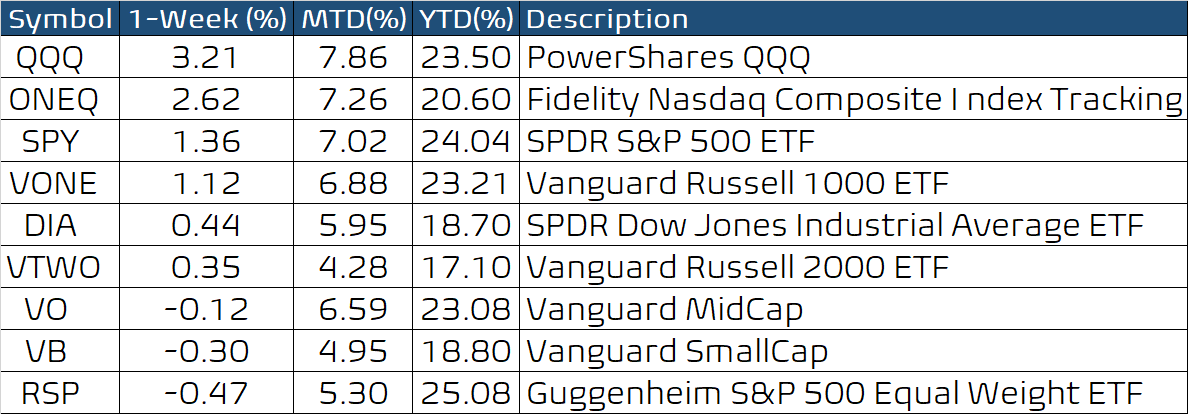
Technology stocks stole the show, despite weak earnings from tech behemoths Apple and Amazon. The market as a whole had a solid month, with the S&P-500 up over 7%. Unfortunately, MidCap and Small Cap stocks lagged a bit this month, so I hope they will play catchup in November.
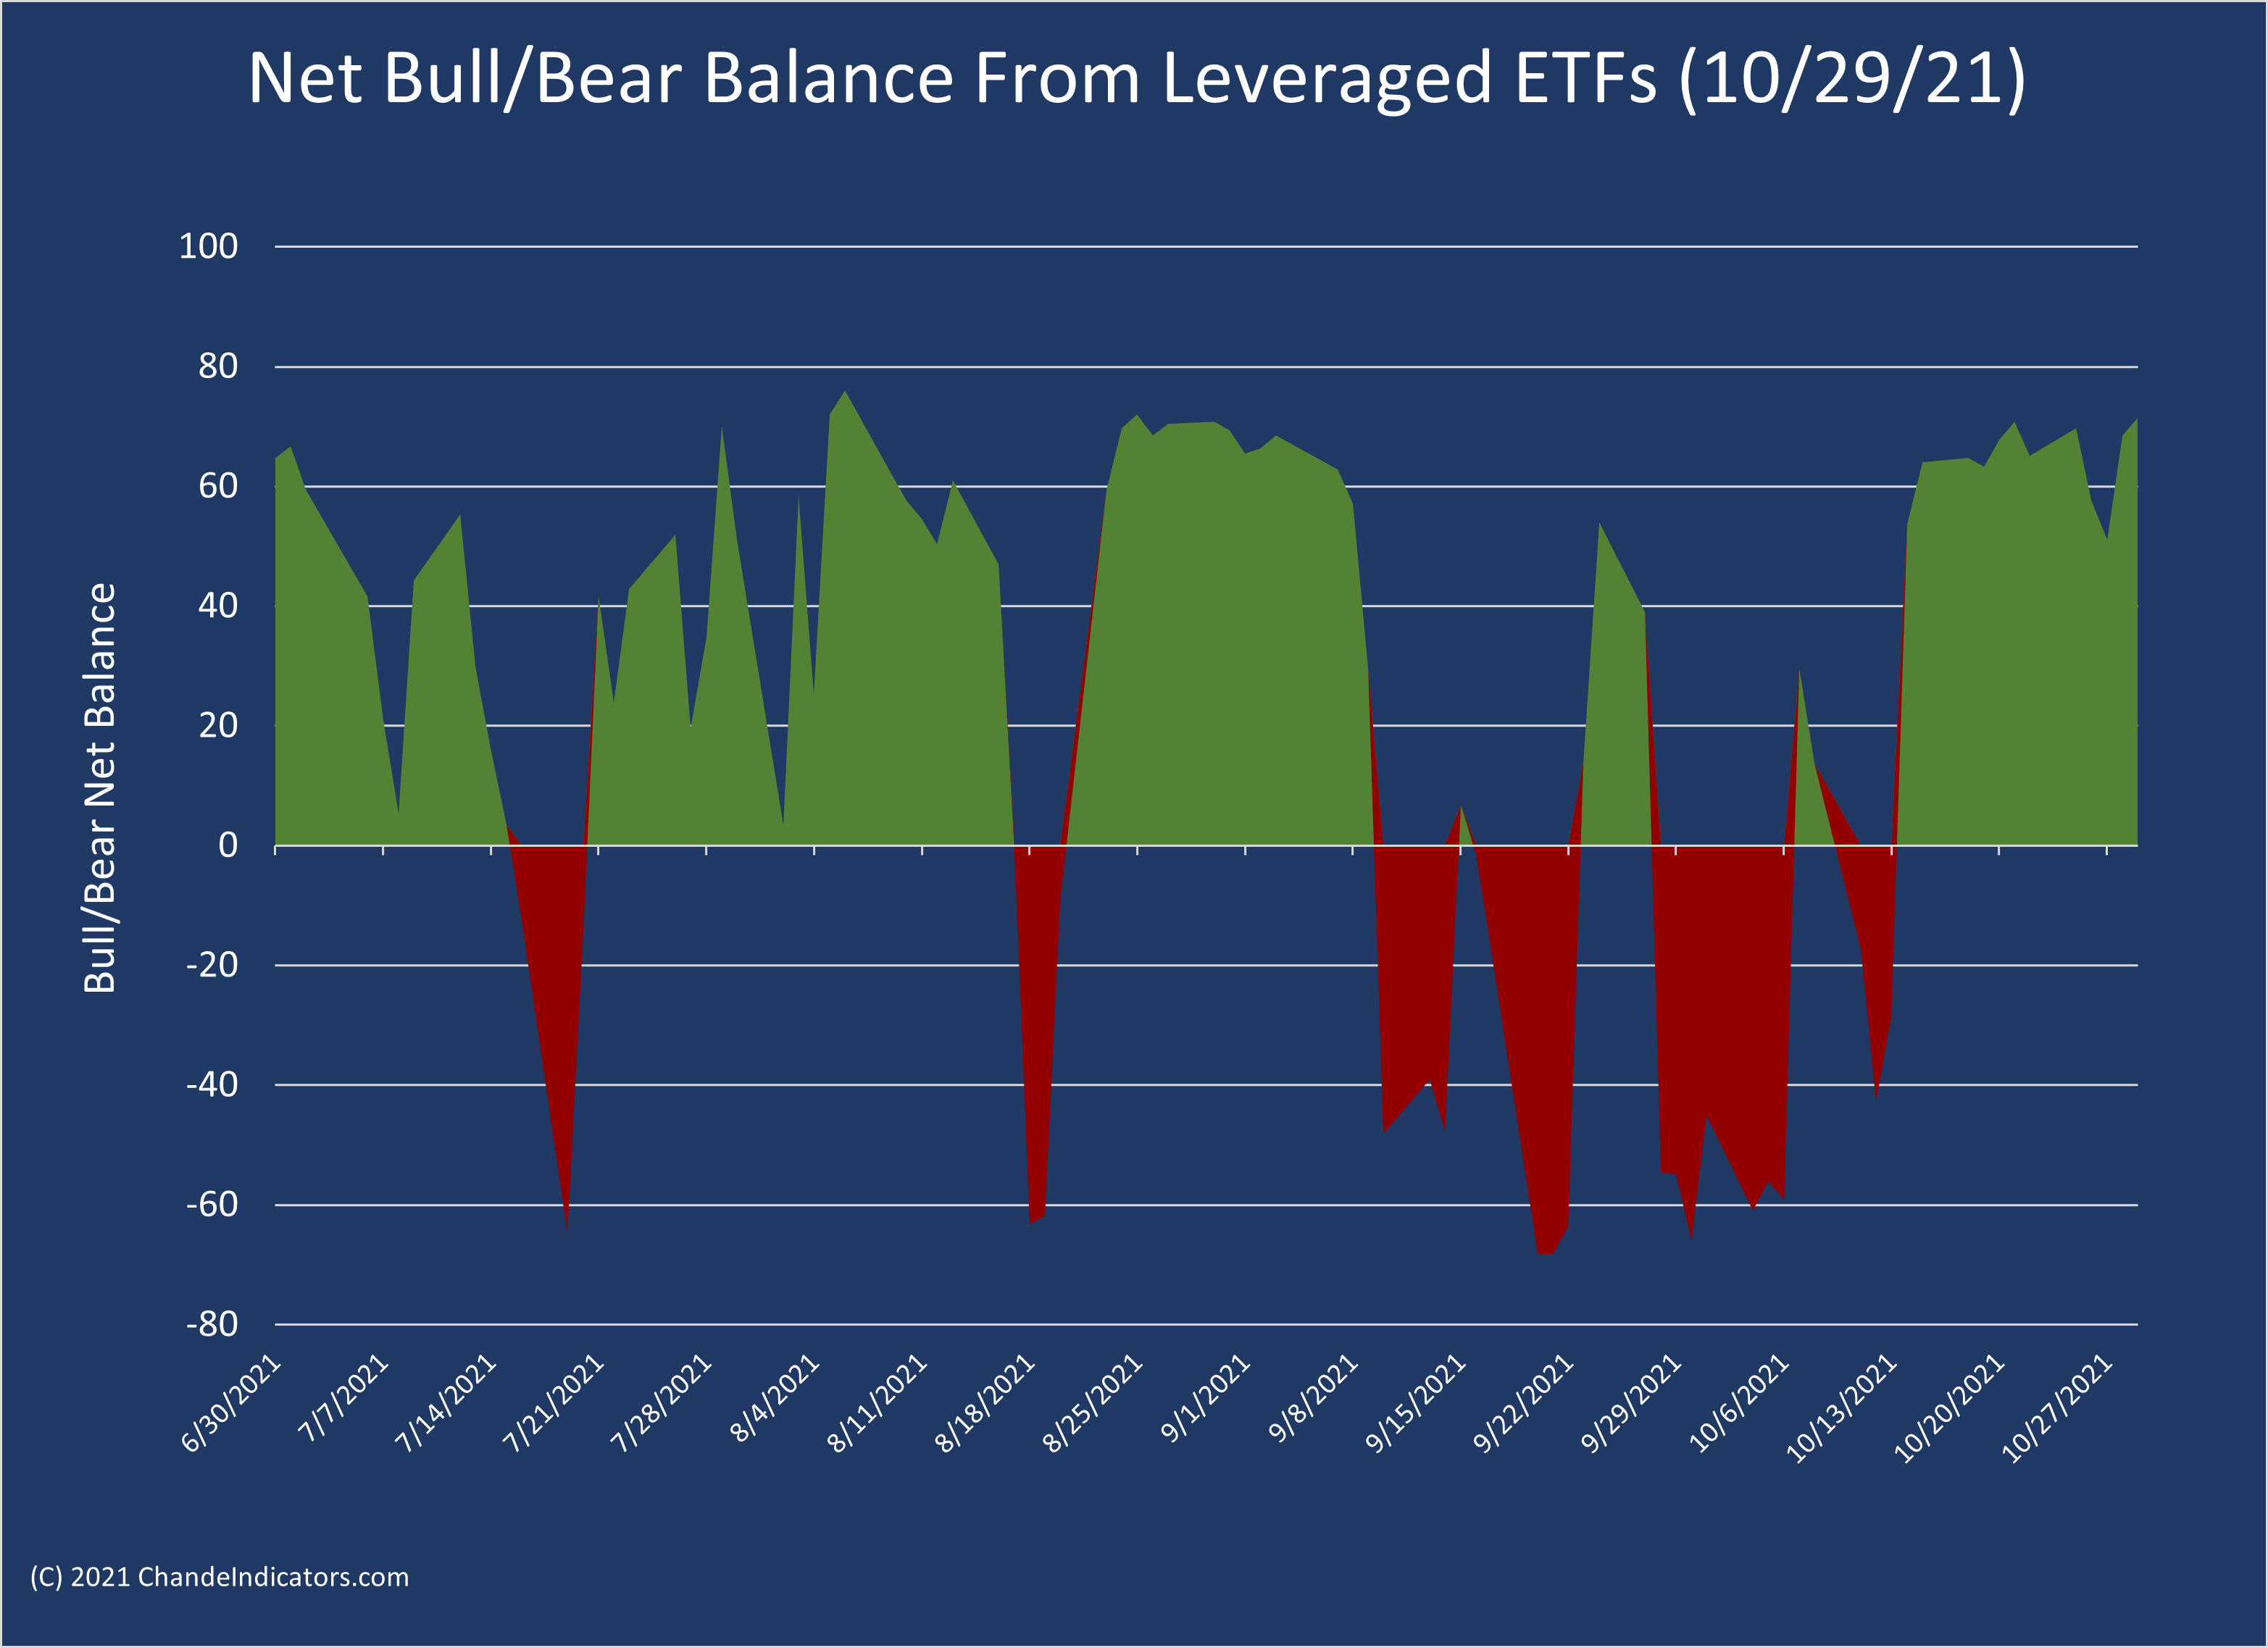
The sensitive Bull/Bear net balance from leveraged and inverse ETFs ended the week at a bullish reading over +60. This is the third week in a row, and as we had said last week, this could continue to be in the green through Thanksgiving.
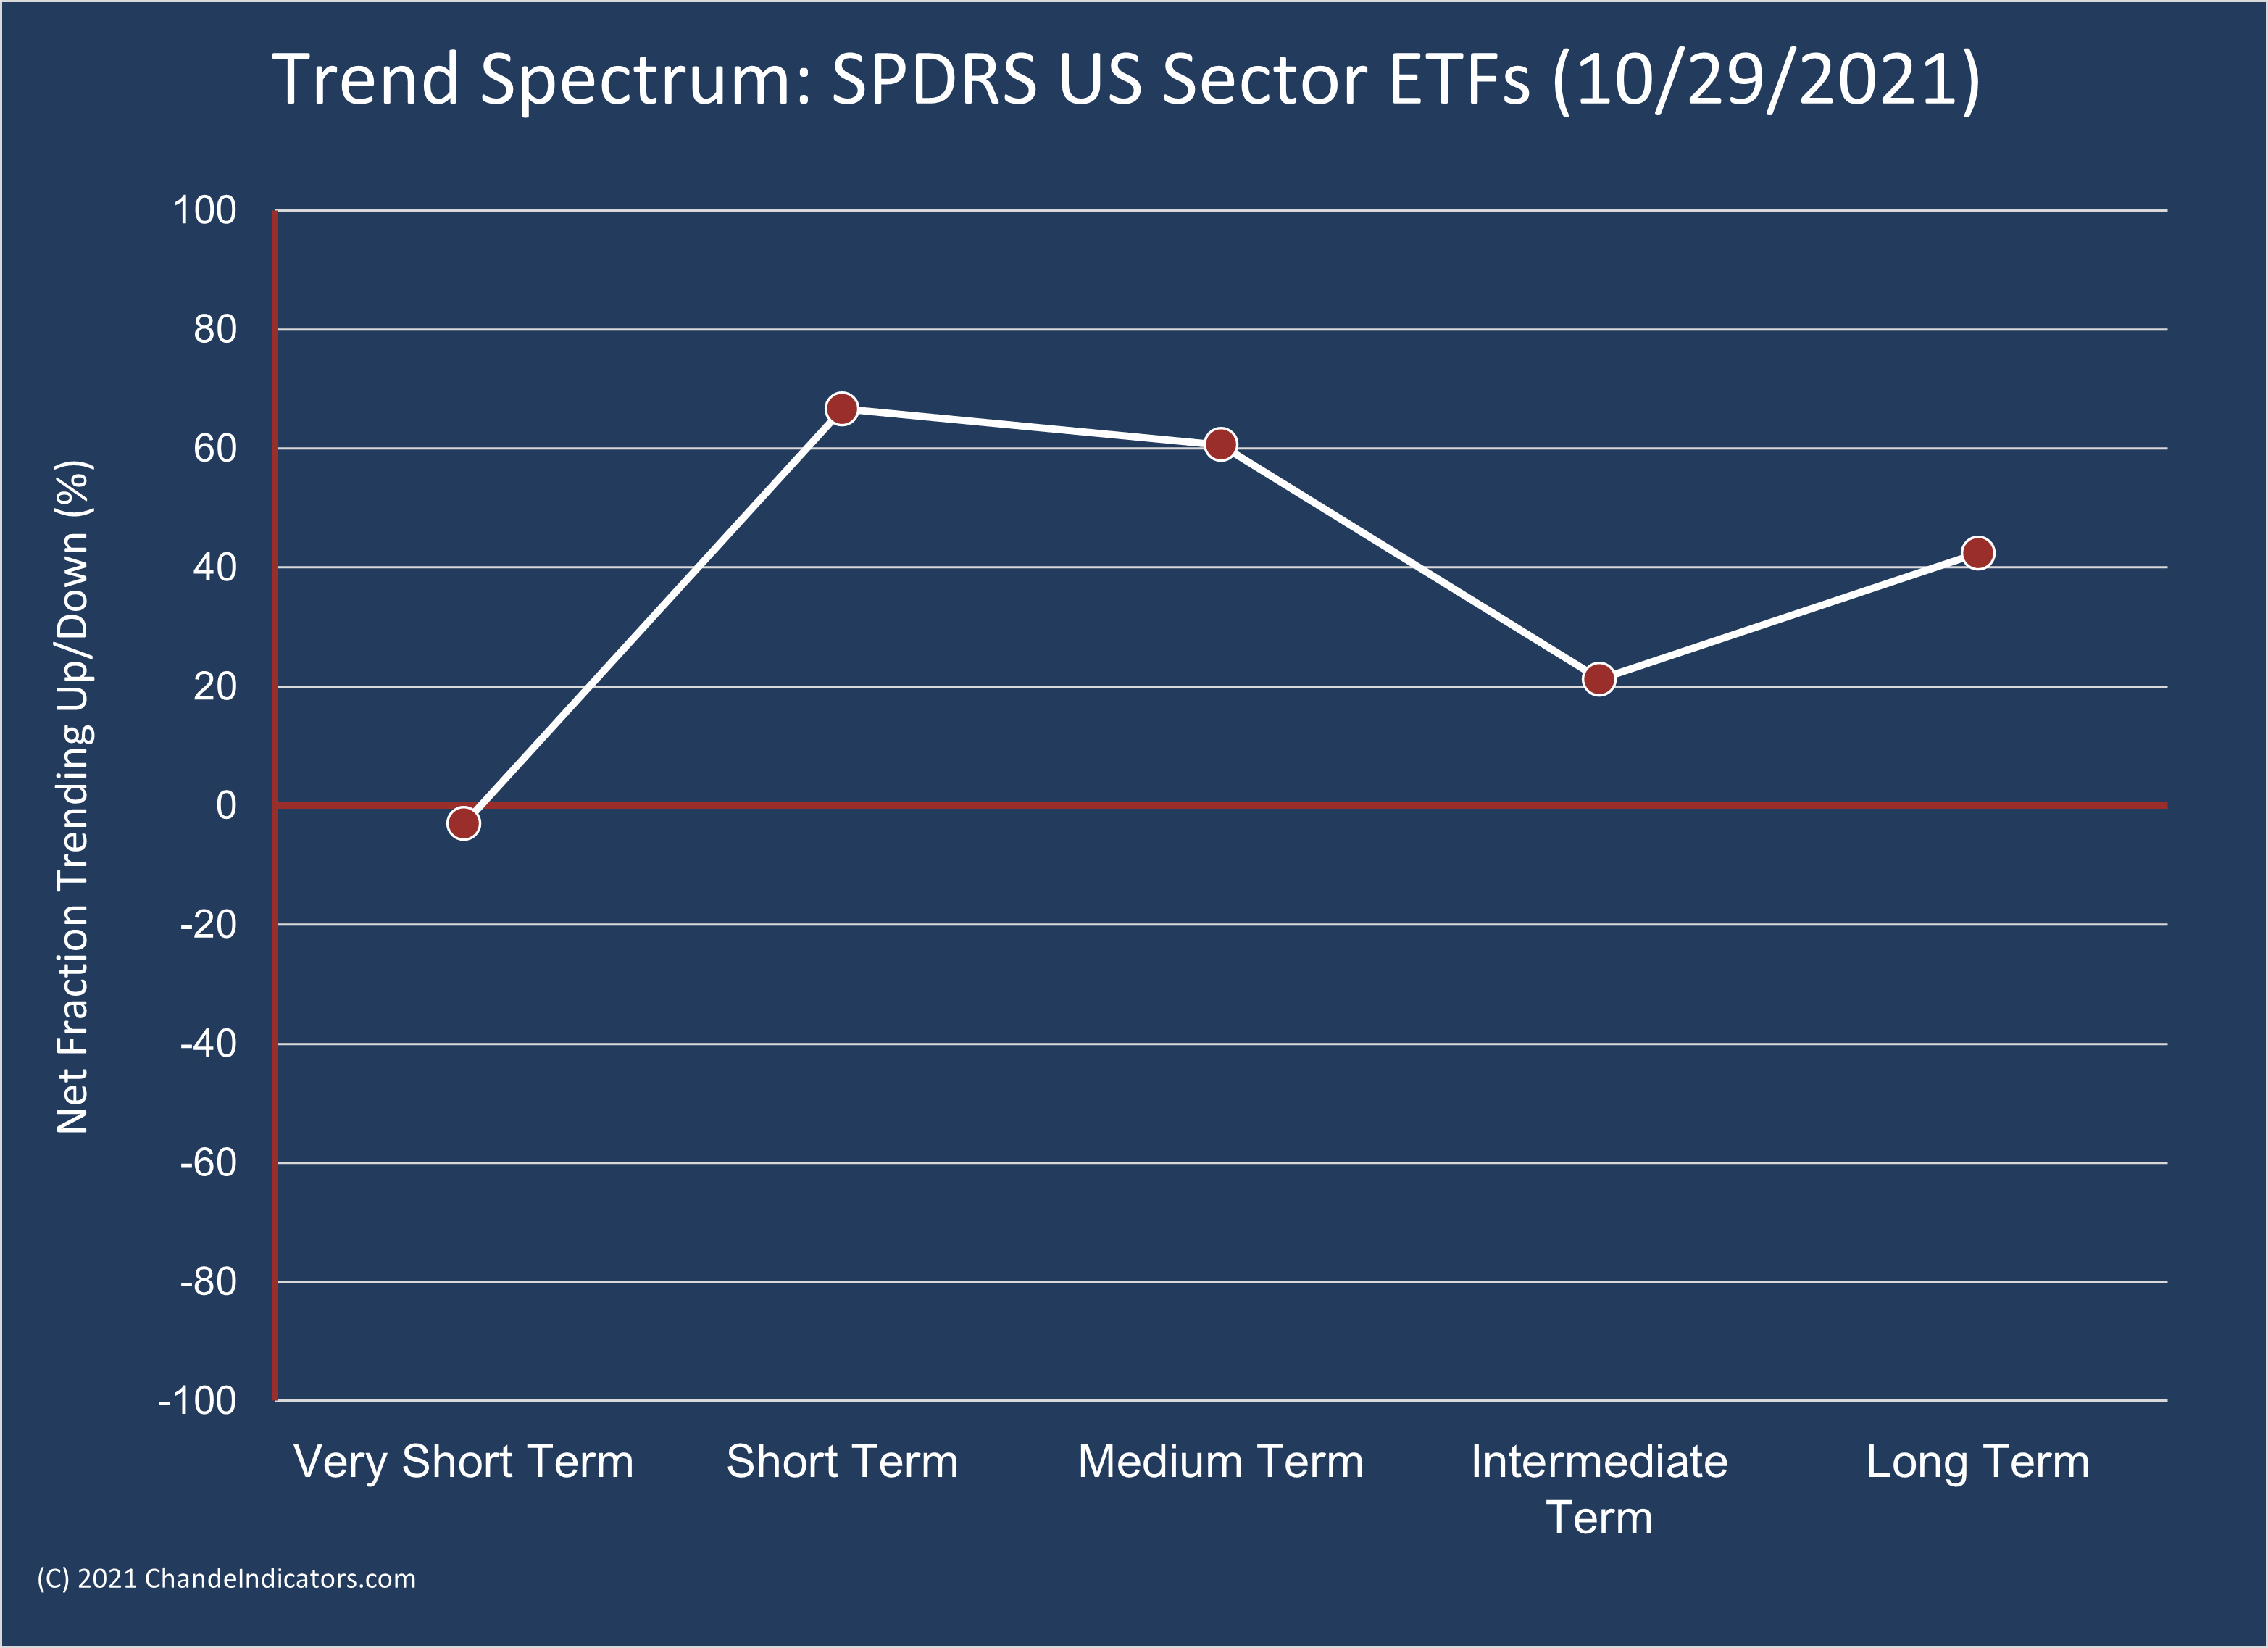
Market breadth has “inverted” its “smile.” Now the rally has boosted breadth from the short-term through the long-term, a welcome development. In the very short term, the trend is neutral, but this could be normal backing and filling by the market.
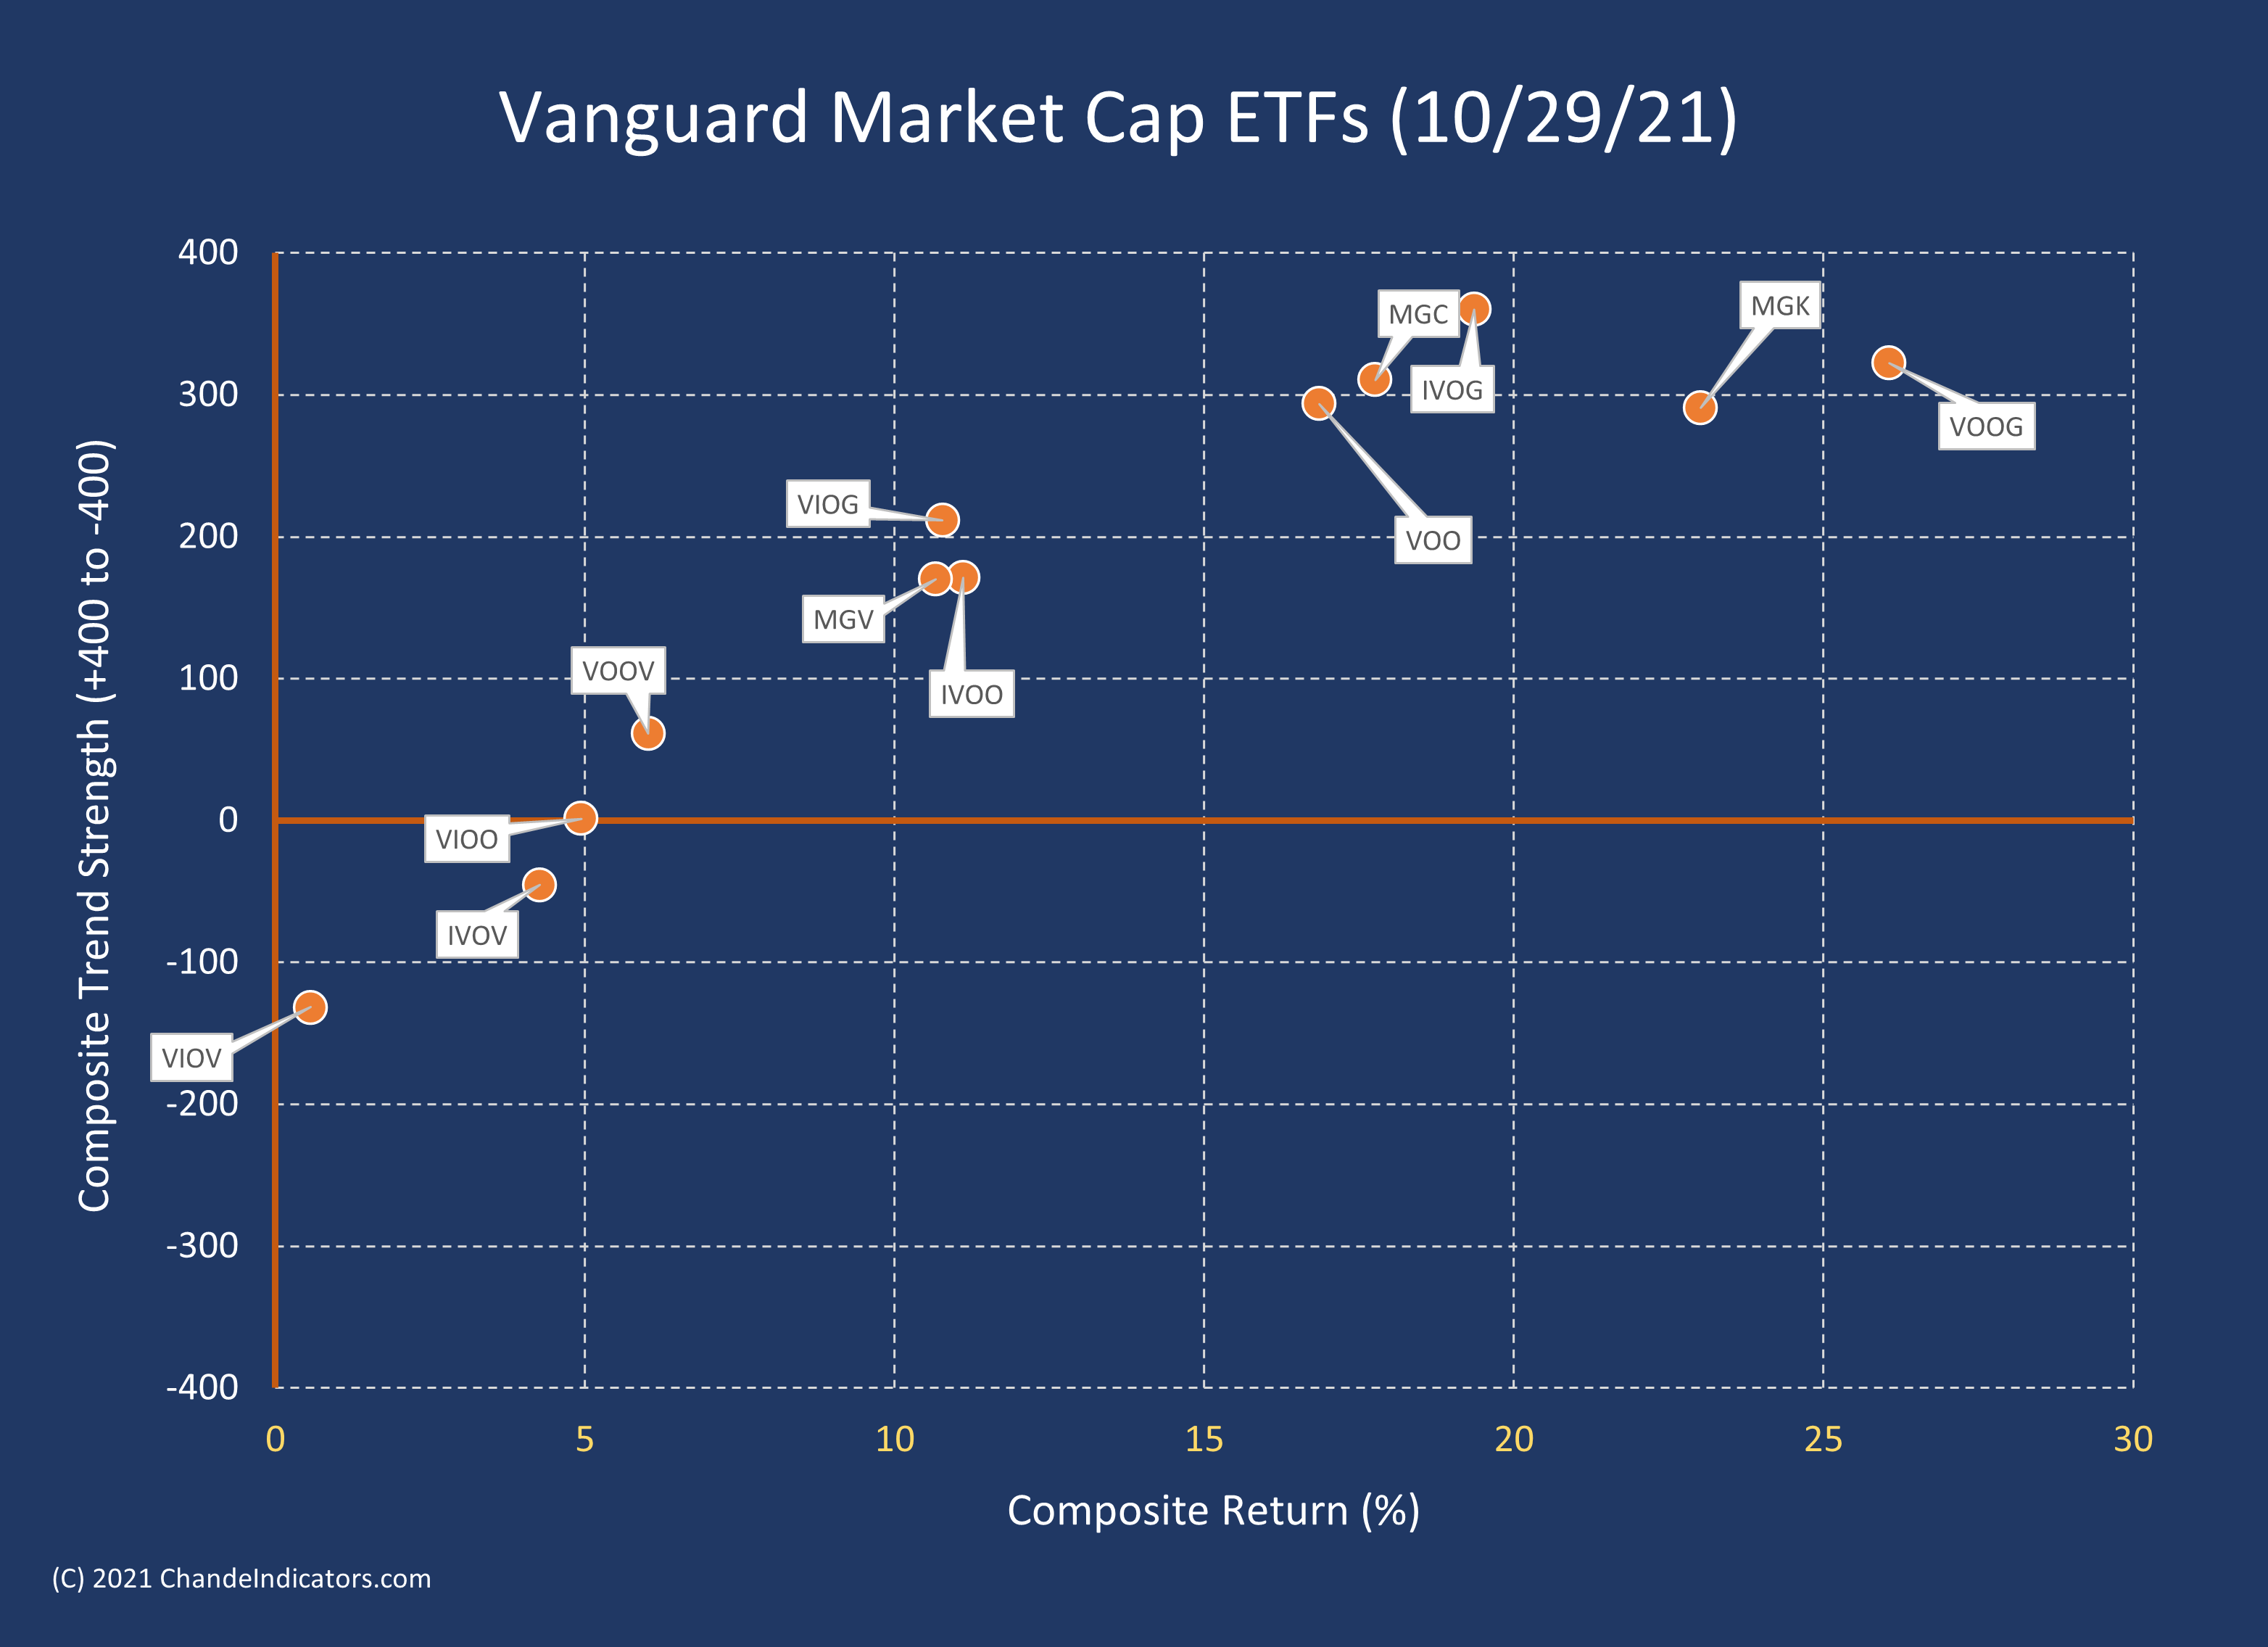
The Vanguard market-capitalization-based ETFs have an interesting story to tell. The strength has shifted from value-oriented ETFs to growth-oriented ETFs and from small-cap to mega-cap ETFs.
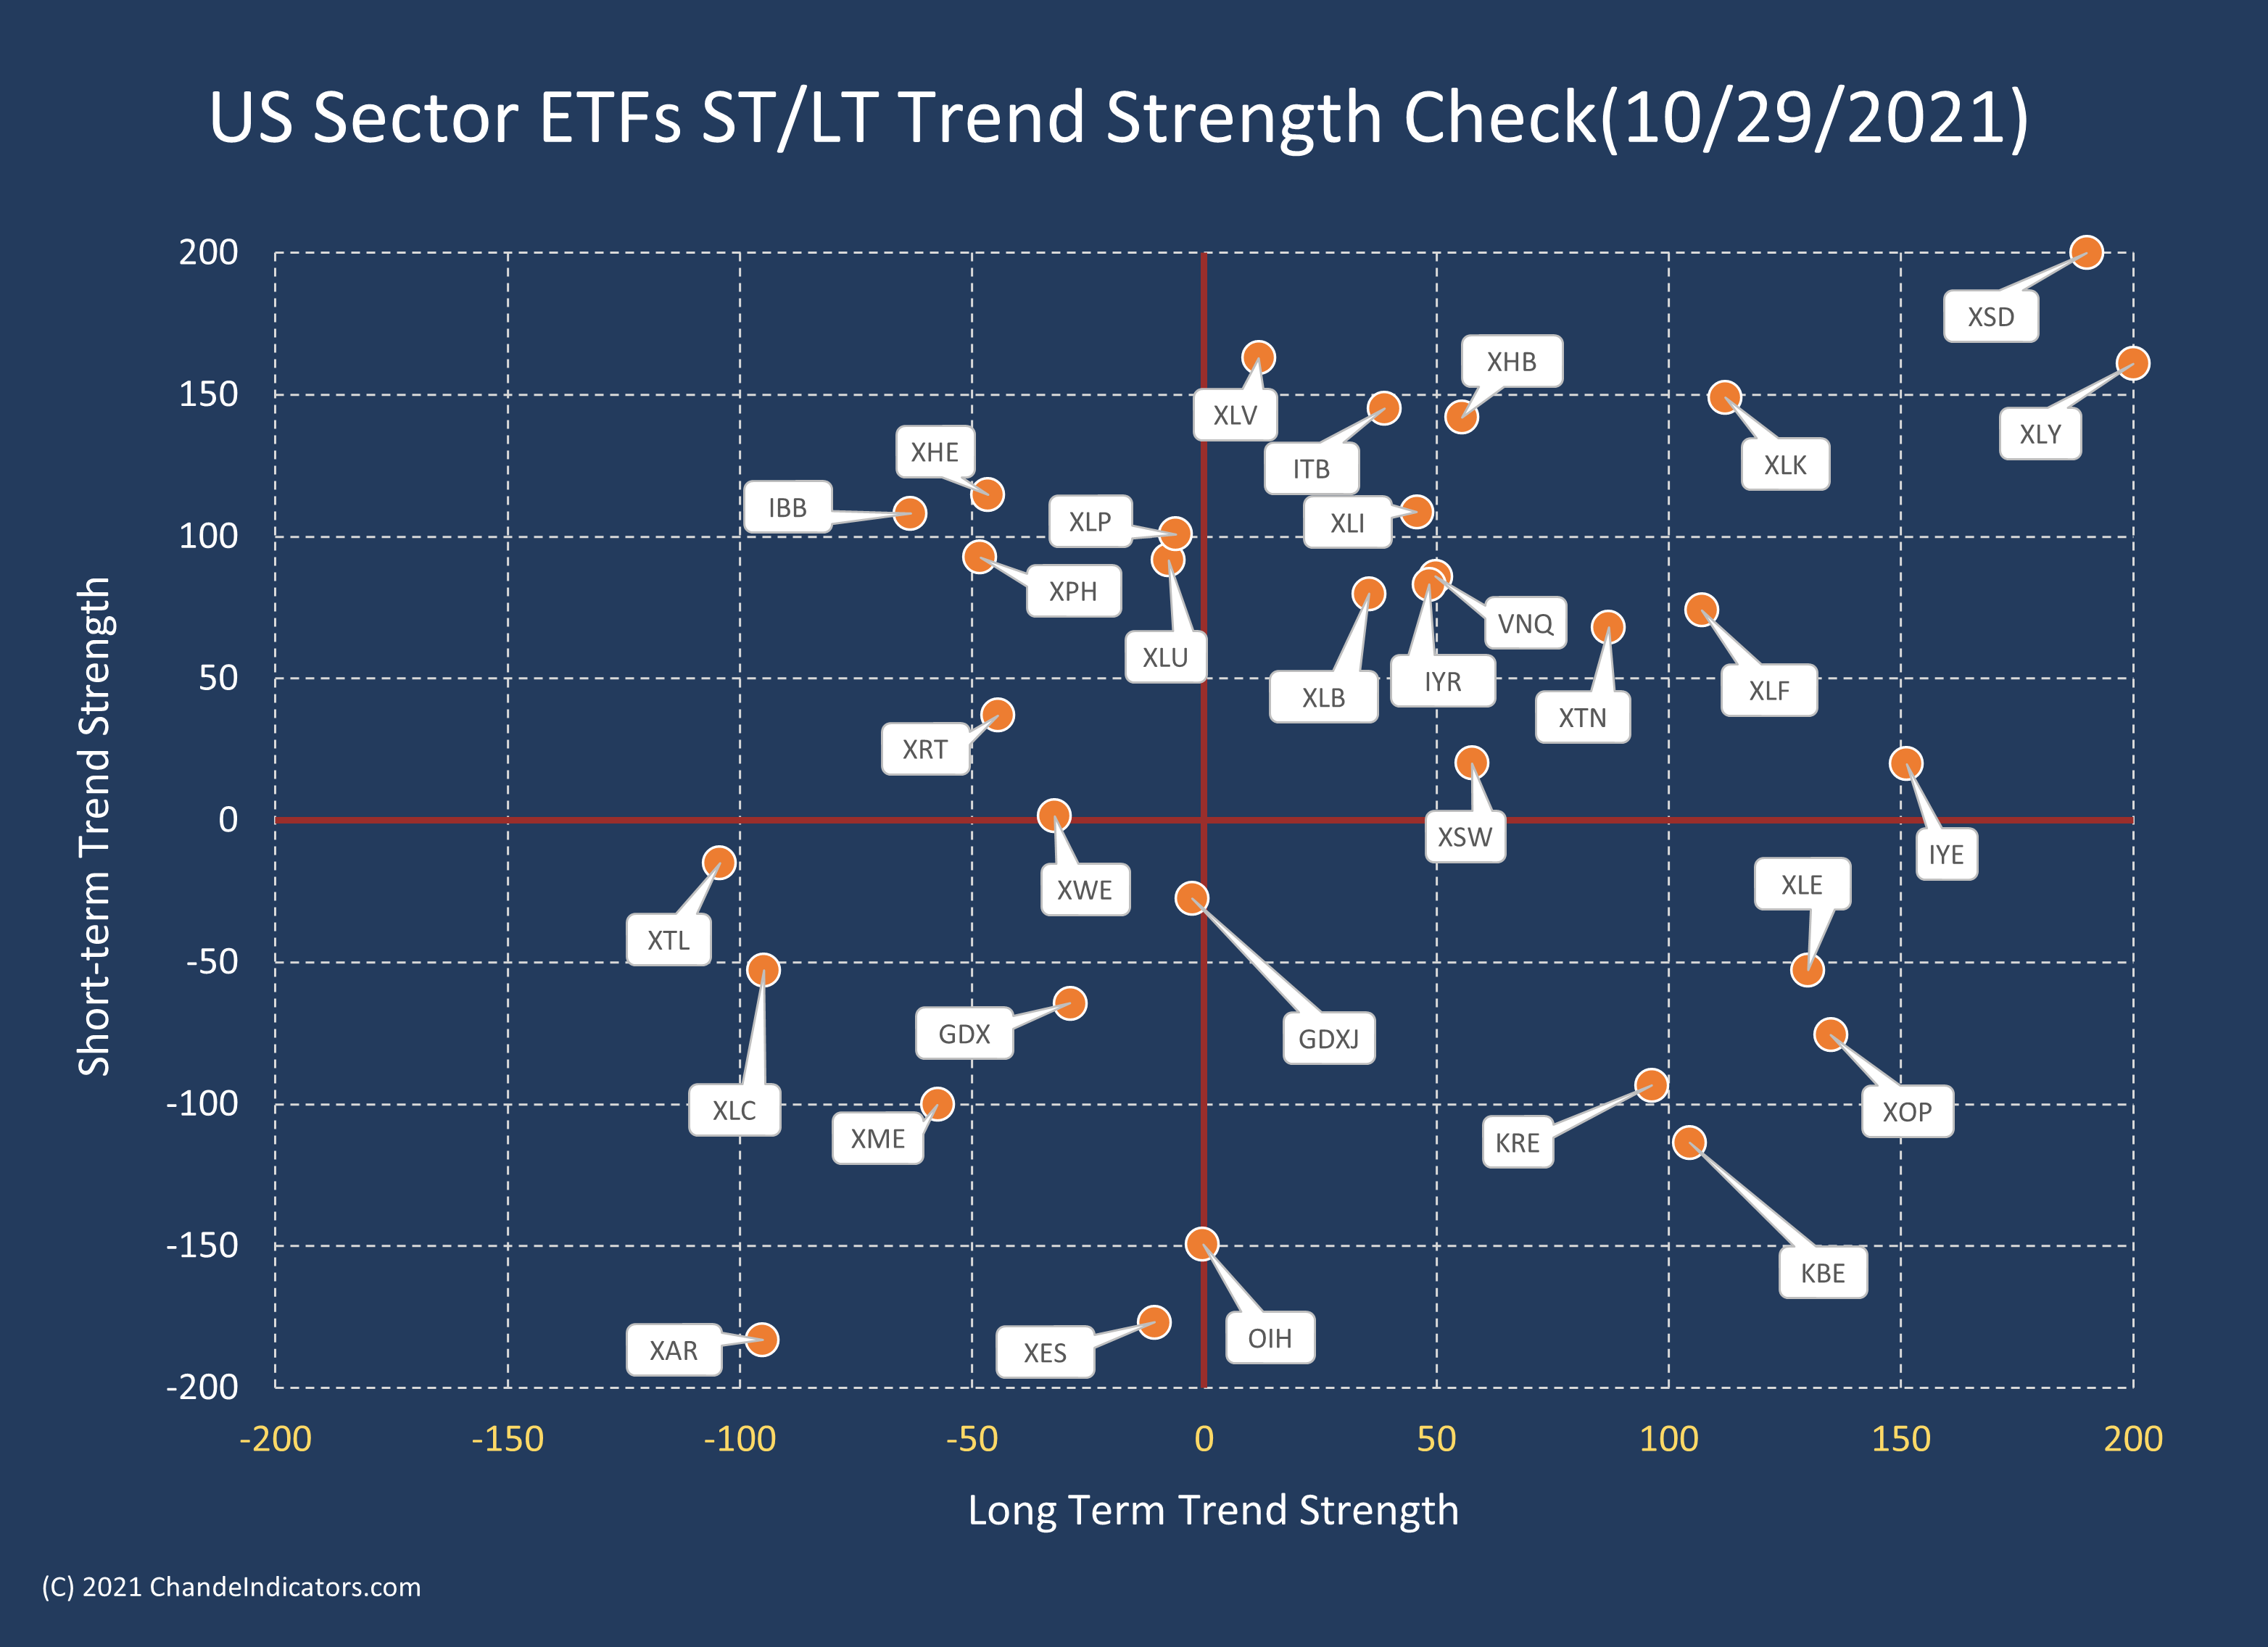
The US Sector ETFs picture today is more evenly distributed on this chart since the summer. Semiconductors (XSD), consumer discretionary (XLY), and technology (XLK) were leading at the end of the week. On the other hand, the previously strong Energy sector (XLE) weakened in the short term.
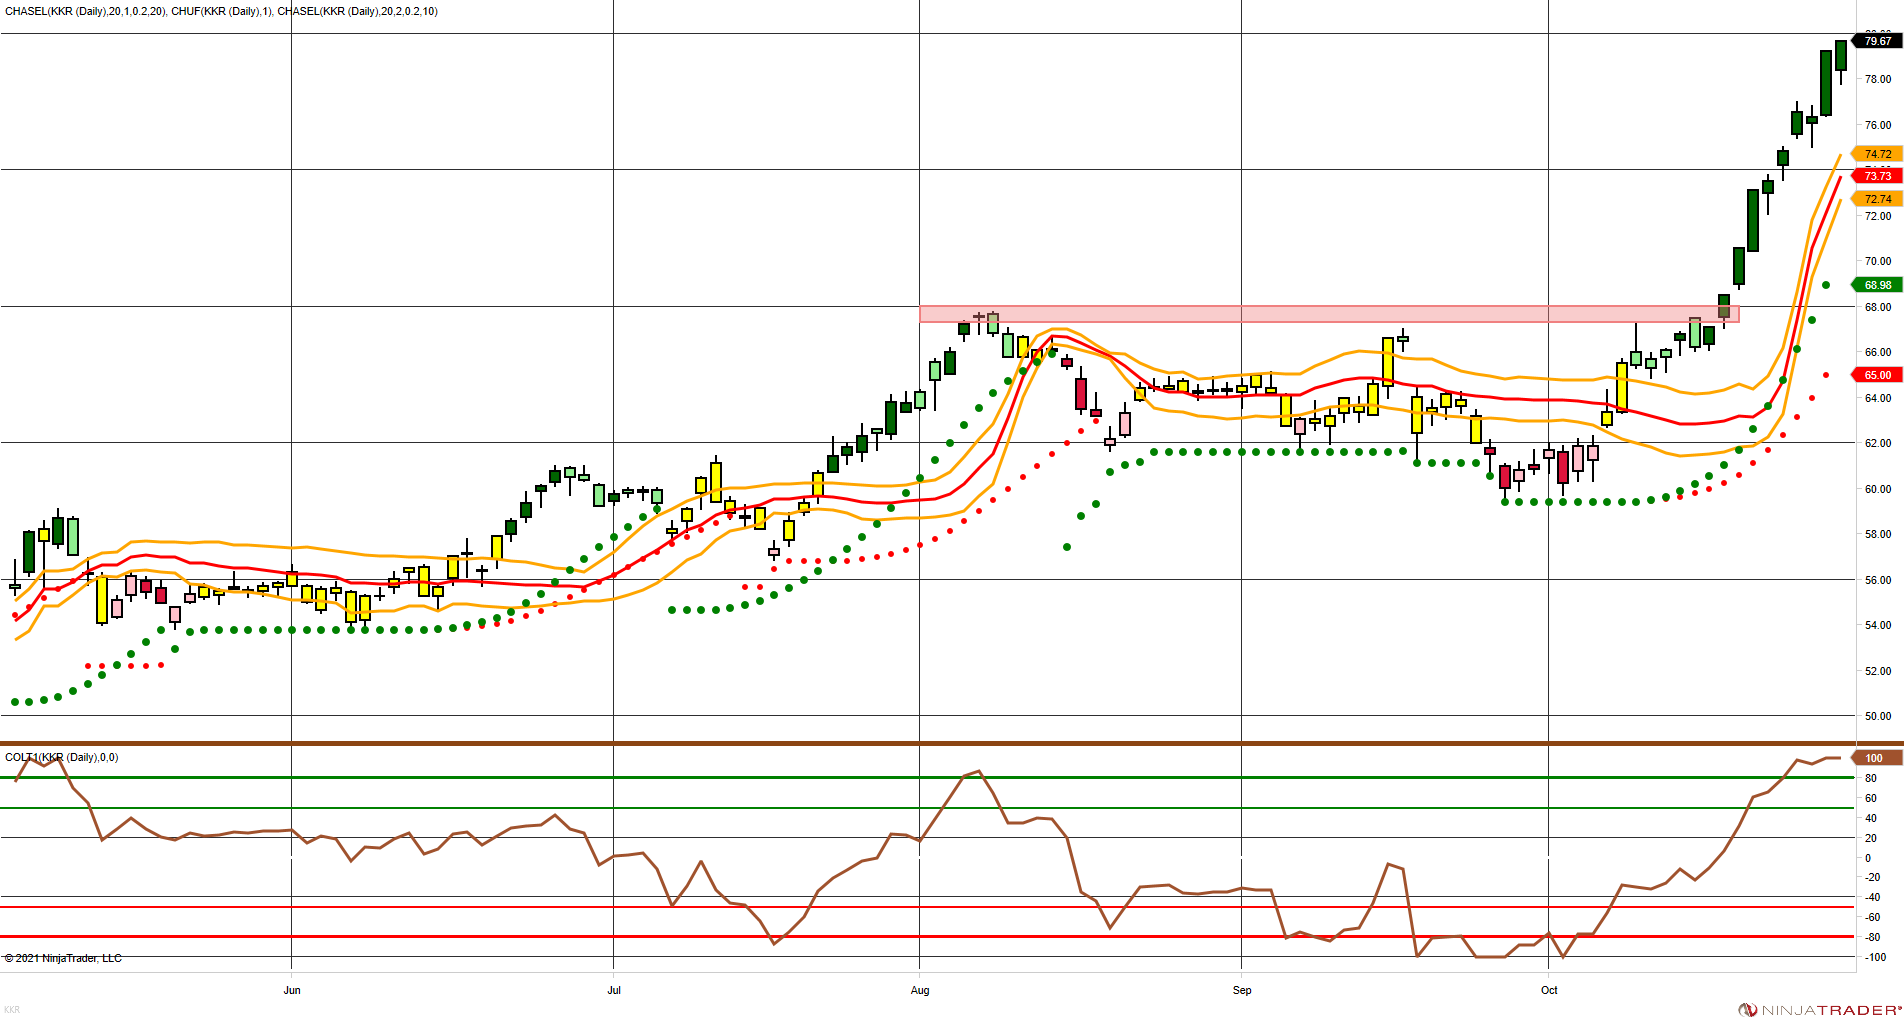
The Stock Finder table on our website is full of stocks breaking out to new highs. If you sort that table by the “Sum of Scores” column, #16 on the list is KKR & Co. The stock has moved up smartly after breaking out of resistance near 68. The table is worth checking out if you are looking for stocks with strong trends.
MetaBands
There are all sorts of bands in technical analysis. Bands are constructed using some moving average and then adding and subtracting some value from the moving average to get a band of three lines that travel together. For example, the “adder” could be standard deviation, a percentage, some multiple of average true range, and so on. When we use percentage bands, the average is not plotted, and we get price envelopes, and I use this idea for my entries.
Now consider the width of the band. When prices rise above the upper band (or fall below the lower band), we get entry signals. The narrower the bands, the closer they are to the moving average, the more easily prices can move beyond the bands, and the more often they will generate signals. As we widen the bands, the frequency with which signals are generated begins to decline till the bands are so wide that no entry signals will ever be generated. Visualize a horse jumping over a fence. When the fence is short, any horse can jump over it. As the height of the fence is raised, fewer and fewer horses have the ability to jump over it. Eventually, the fence is so high that no horse could ever jump over it.

I wanted to think very long term, so I used an average with a very long look-back period, close to a year and a half. Then, I wanted relatively wide bands so that only the most powerful stock trends would rise beyond it. I chose insanely wide bands that no ordinary stock would easily scale. Then, I wanted to trade these stocks without trailing stops. We have all heard of “Buy Low, Sell High,” but that is clearly incomplete. My strategy could be summarized as “Buy low, sell high, and prepare to withstand months of volatility.” However, prudence dictates that we use some trailing stop. I like to use my wide stop set to a relatively loose setting. This combination is included in my toolkit for MetaStock. (I called the system a long-term system, but I should have called it The MetaBands System!)
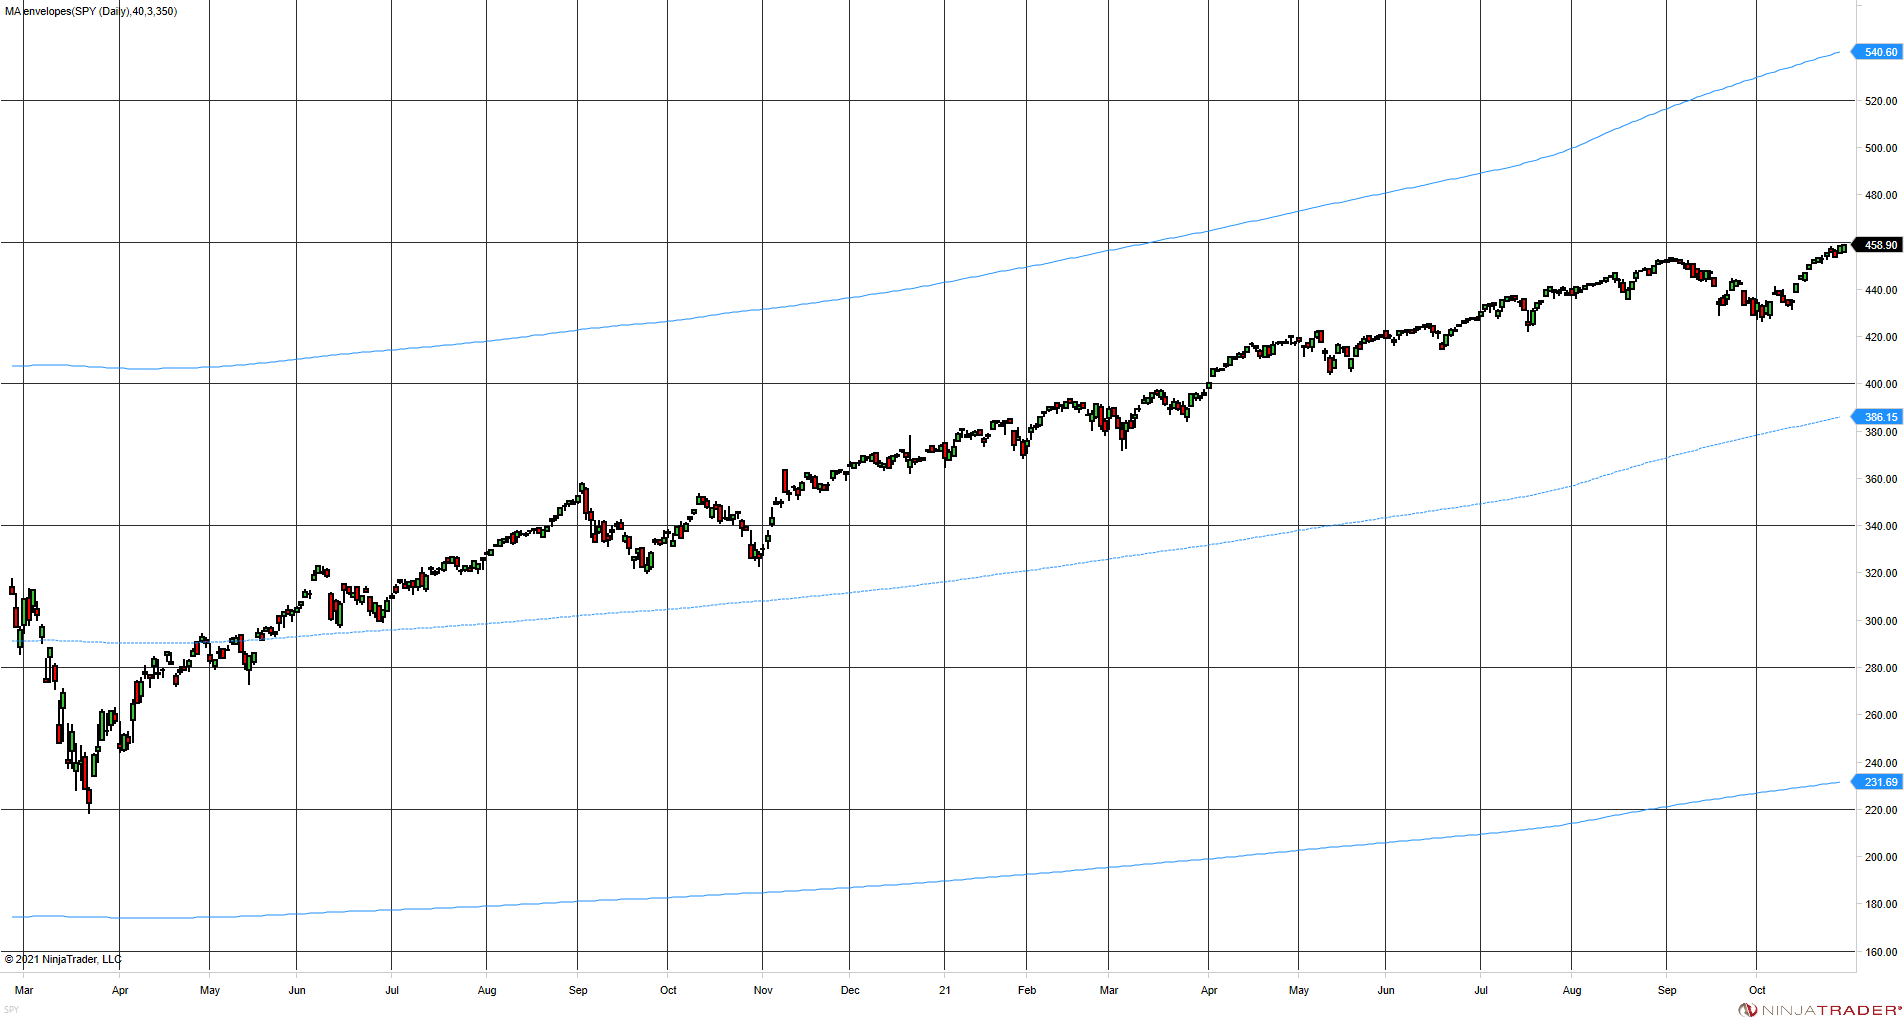
Instead of getting bogged down into why I chose this value or that parameter, I will try to give you an intuitive understanding. First, consider the SPY with my wide bands. The bands are so wide that there is no danger of SPY generating a signal: this horse can’t jump.
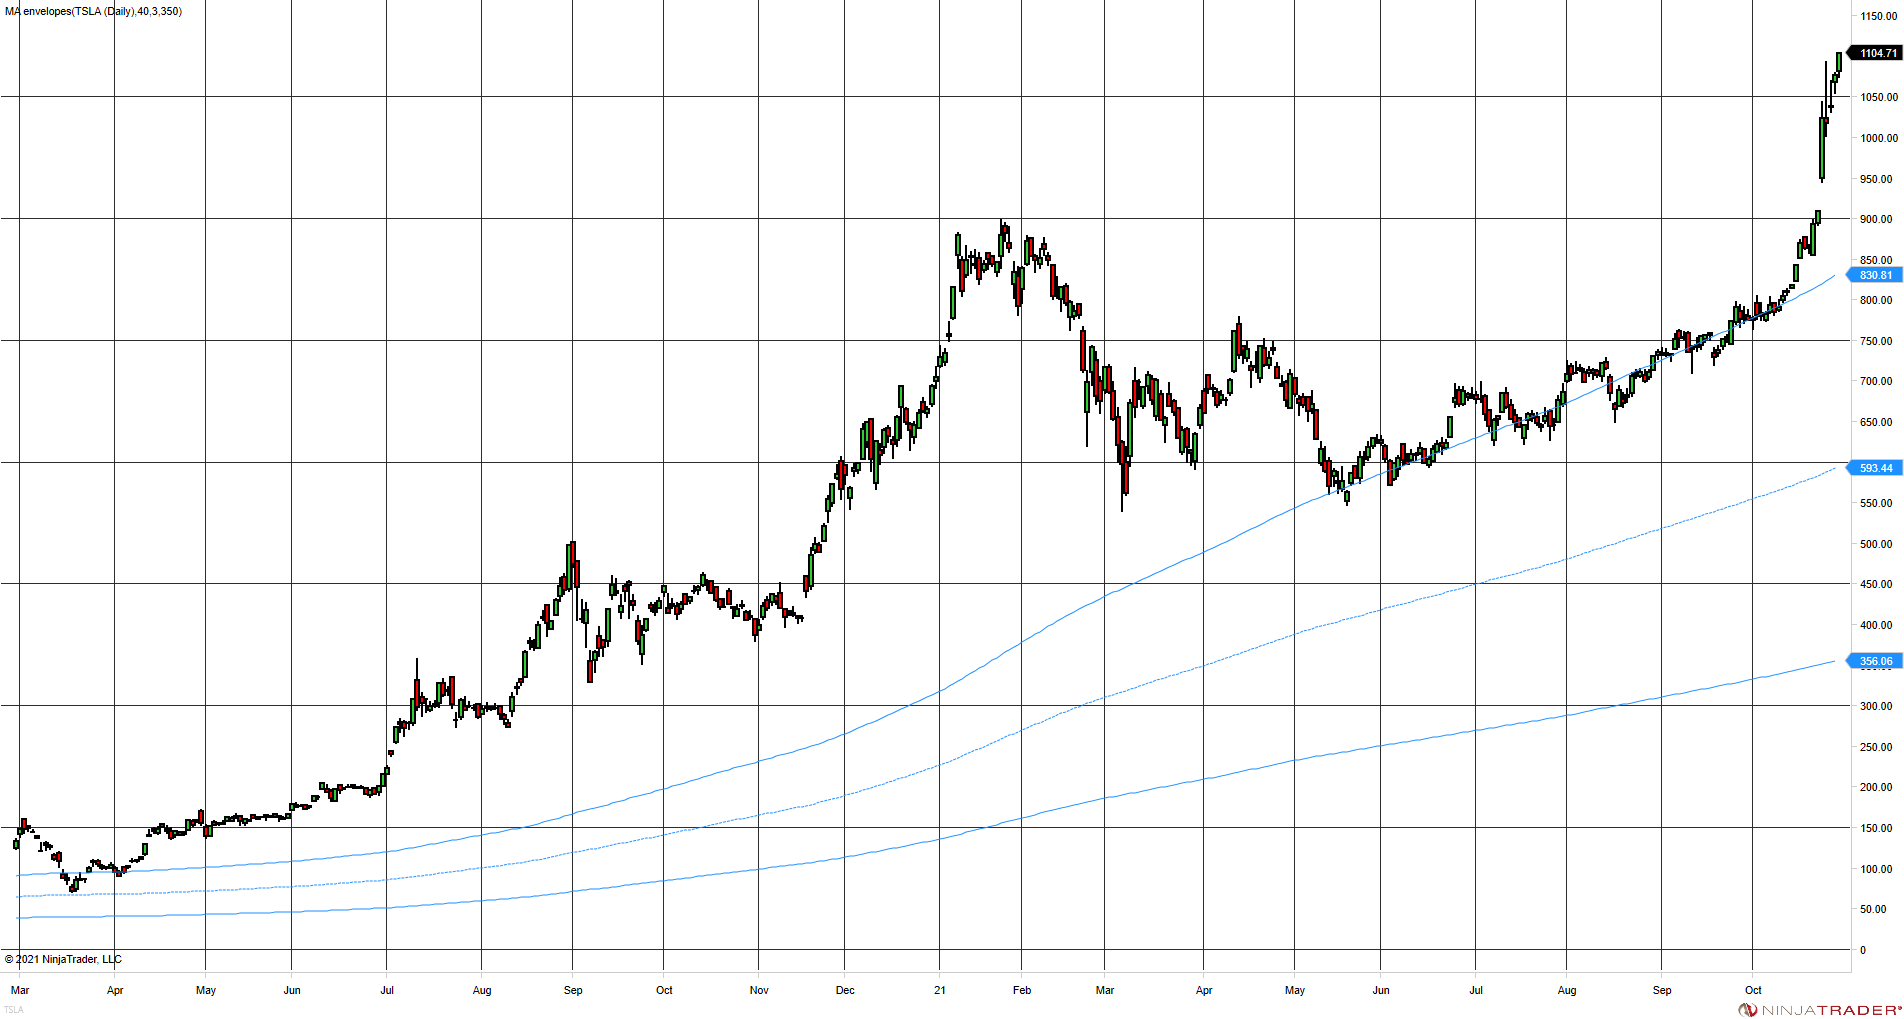
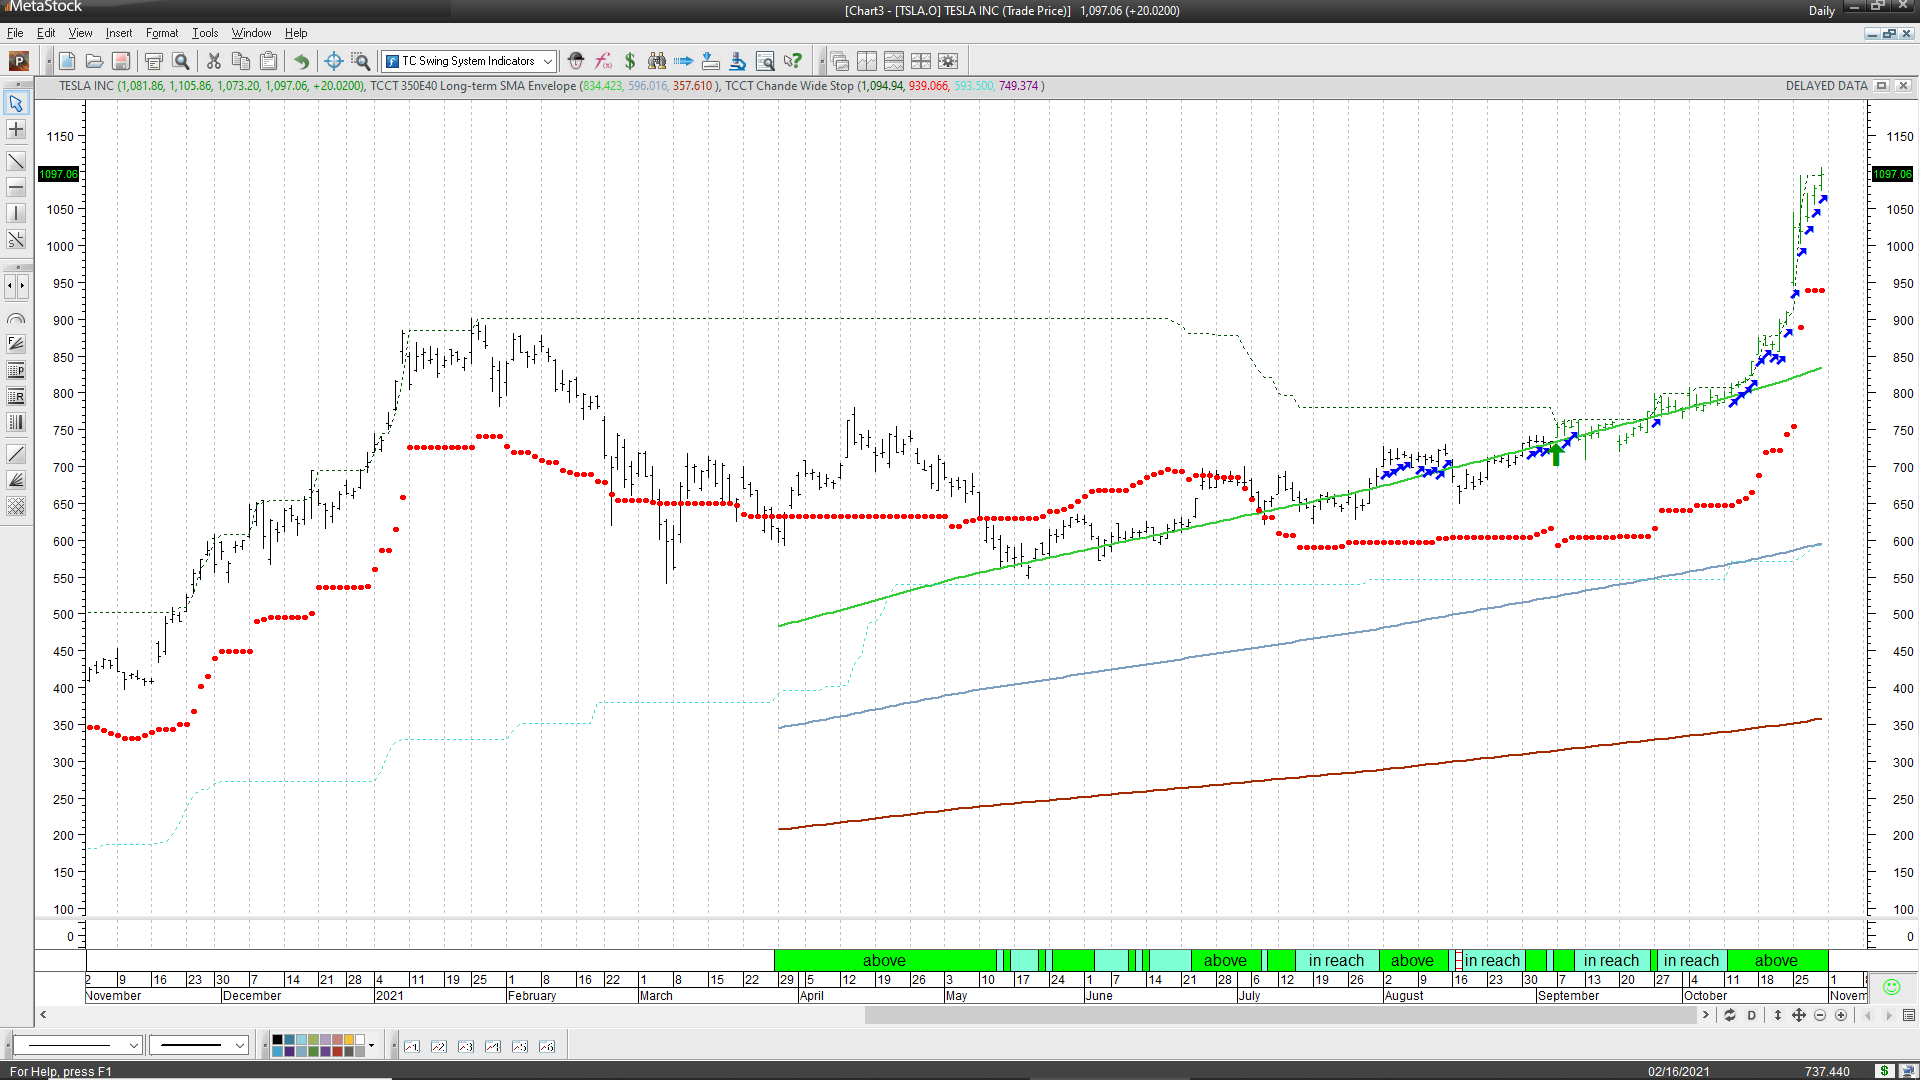
Now consider Tesla (TSLA). Tesla had no trouble moving way outside my bands. Notice how TSLA has actually stayed mostly outside the bands. If trading with a buy-and-hold strategy, you would have to withstand quite a bit of volatility and hold through the significant declines earlier this year. Now you see why I wrote above that my strategy could be summarized as “Buy low, sell high, and prepare to withstand months of volatility.”
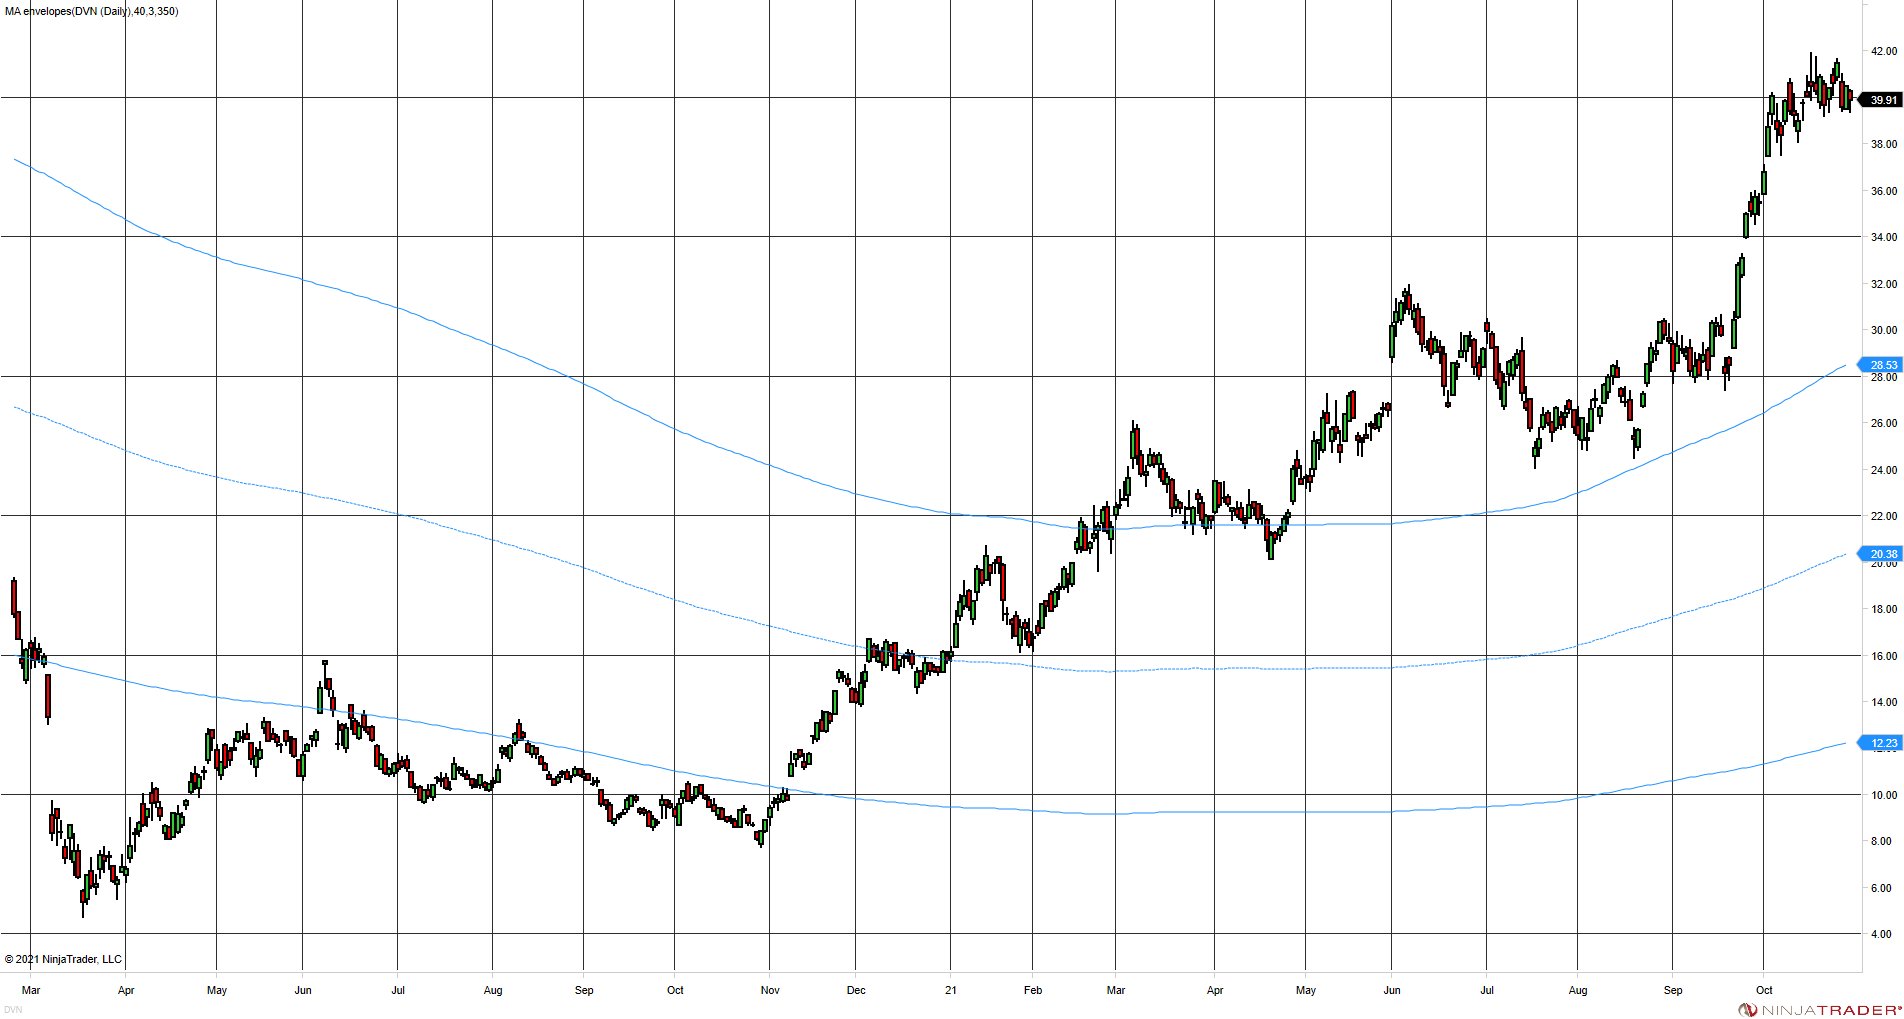
In contrast to Tesla, let us look at the Devon Energy (DVN) chart below. DVN began this chart well under the lower band and then moved up very nicely to rise above the bands for the first time in March of this year. Devon Energy shows another feature of this strategy: it is slow to enter, and indeed, gives up or misses the major move needed to get beyond the upper band. At that point, it looks “overbought,” and only the crazies would buy it, which is probably why this strategy works. Notice the pullback toward the upper band you would have to sit through, which is par for the course with this strategy.
Let me show you how the Tesla chart would look with a trailing stop. The blue arrows show when prices are outside the upper band. The green arrow shows the entry point into the trade. The red dots show the exits, set here to 8x the measured volatility. Notice how the stop jumped with rapidly rising Tesla prices. So, the risk here is that TSLA could come down and hit your stop to take you out of the trend without falling below the upper band. So, the stop controls risk (especially after entry) but is not a buy-and-hold strategy.
OXXO Charts - A New Charting Technique
The November issue of Technical Analysis of Stocks and Commodities magazine has my article on a new charting technique (OXXO Charts) as their cover story. The title, “Convertible Point & Figure Charts,” says it all: we can convert breakout models into P&F charts and back again.
MetaStock Event: Thursday, November 18, 10:00 EST
MetaStock is putting on a week-long event (Nov 15-19), and they have kindly asked me to present some ideas using my new MetaStock package. Registration is free, so please stop by if you have some time. The line-up of speakers offers an astonishing range of trading ideas, so do take a look.
Wrap-up
If you like to do your own research, my posts should give you a good starting point, with context and suggestions. Then, you can visit my website, chandeindicators.com, for more information and ideas. I hope you will stay tuned and help by subscribing and recommending it to your friends and colleagues.
Thank you for spending some time with me.
Disclaimer
And now for some housekeeping. This publication is for “edutainment,” education, information, and entertainment purposes only. It is not to be construed as investment advice. Past performance is not necessarily indicative of future results. Our disclaimer at chandeindicators.com is included herein by reference.