


Stocks Yield to Bonds
Rising rates sink stocks, so we examine the evolution of the 10-year T-Note's yield.

Overview
Fed Chair Powell delivered as much clarity as he could: a 50-bp increase as indicated, two more 50-bp raises thru July, no to a 75-bp hike, and a gentle ramp-up in the balance sheet runoff.
Stocks rallied hard on Wednesday after the Powell presser (relief at no 75-bp increases), only to give up all those gains and more on Thursday (oops, at least two 50-bp increases in the pipeline.)
On Friday, selling in stocks resumed as the 10-year Treasury rate rose to 3.13% in response to a strong employment report (+428,000 jobs).
The week unfolded as we expected:

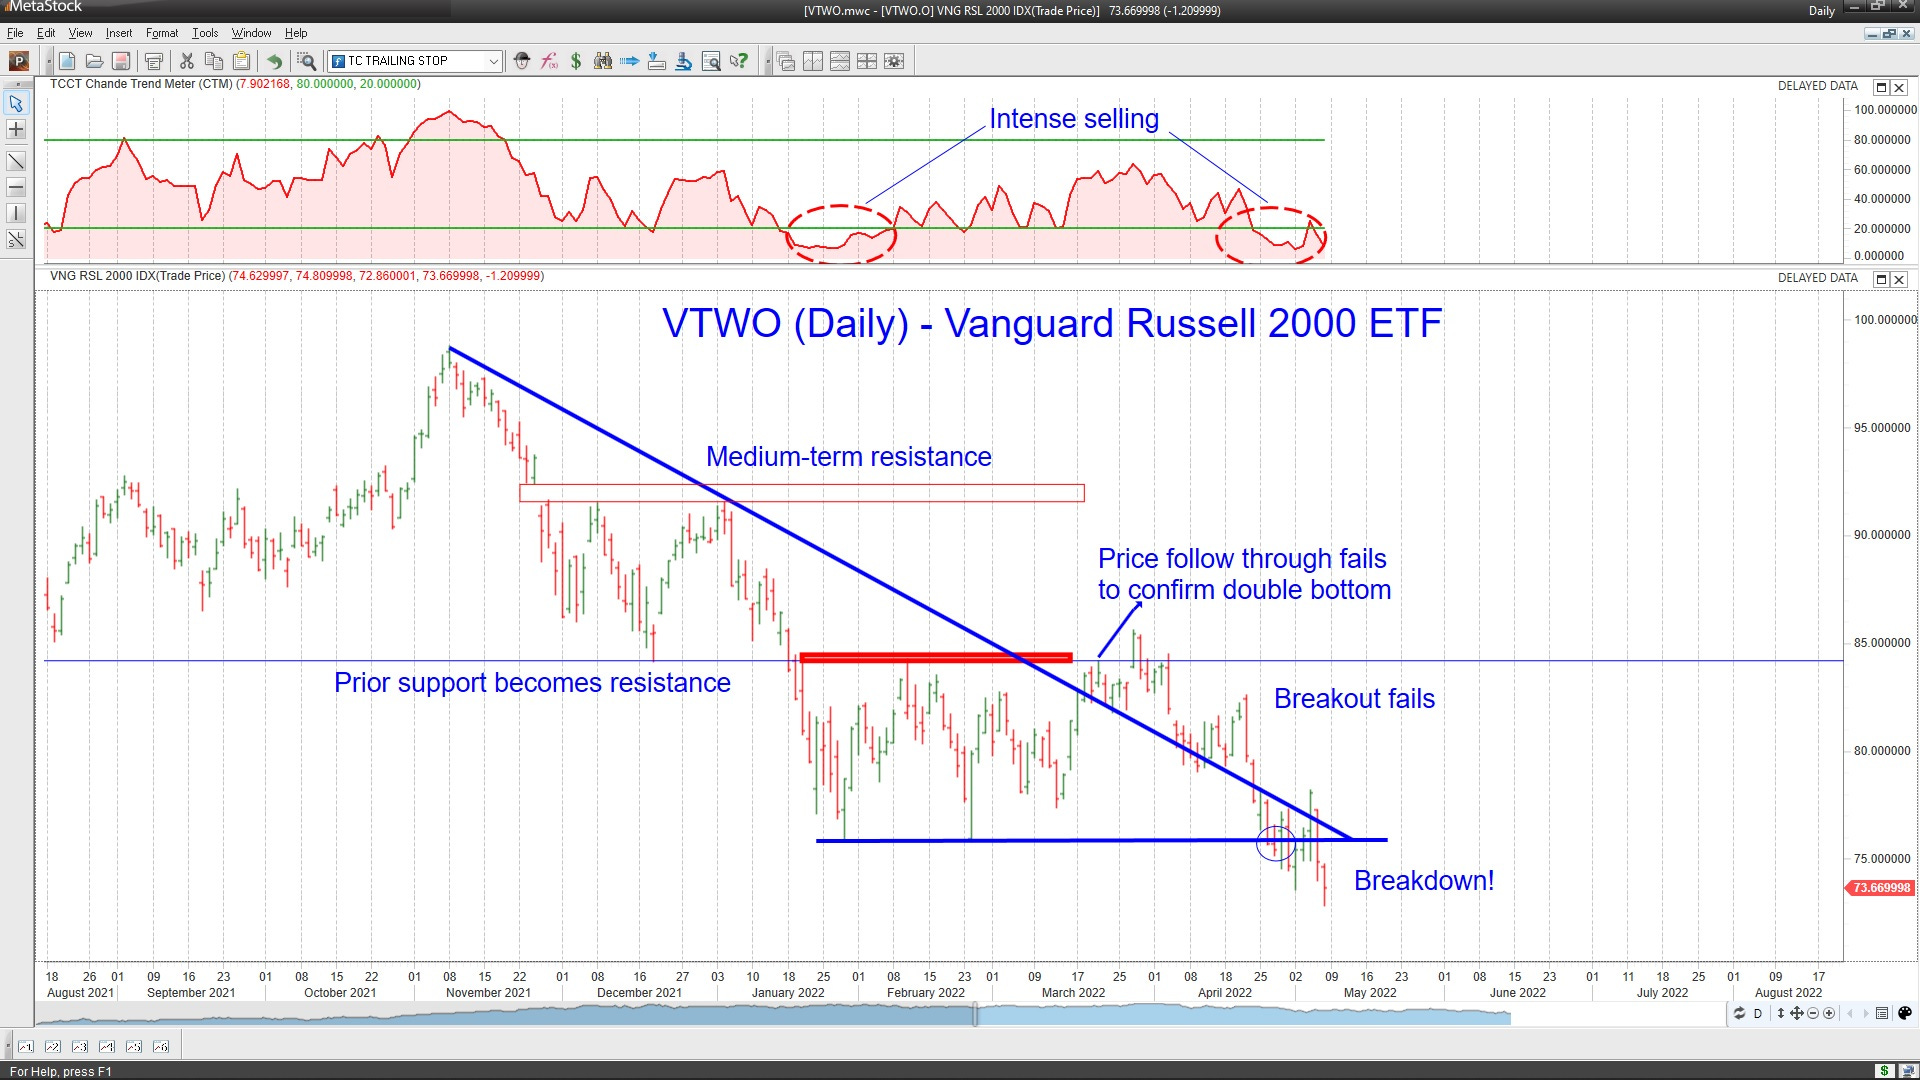
The broader market made new lows, suggesting that a new down-leg may be underway.

The VTWO ETF broke down to new lows, indicating a new down-leg in prices for the broader market. (Chart courtesy MetaStock.)

Key Question
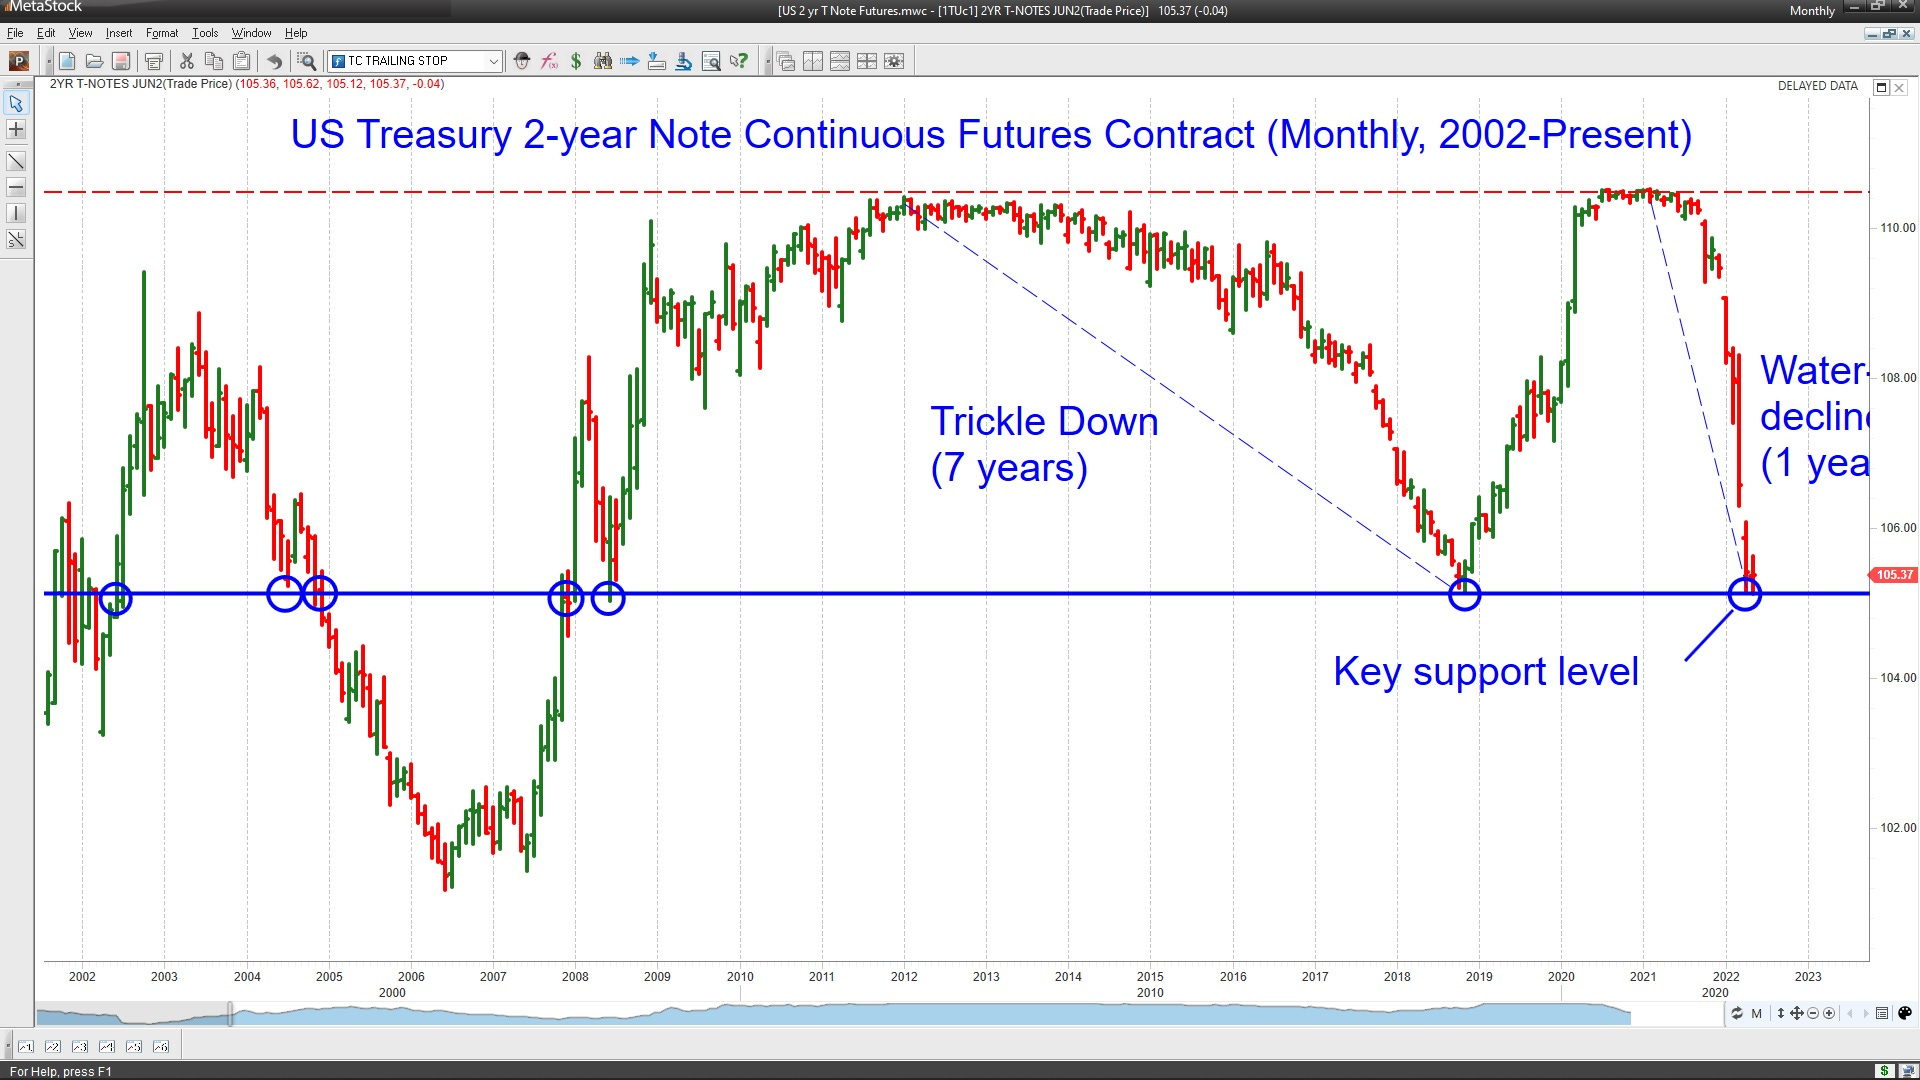
How high can the 10-year Treasury rates go, at least in the near term? The market seems to be worried about the 10-year Treasury yield rising above 3% in a rapid ~ 20-bp move. Last week we looked a the 2-year Treasury note futures long-term chart. This week we do the same for the 10-year Treasury note futures.
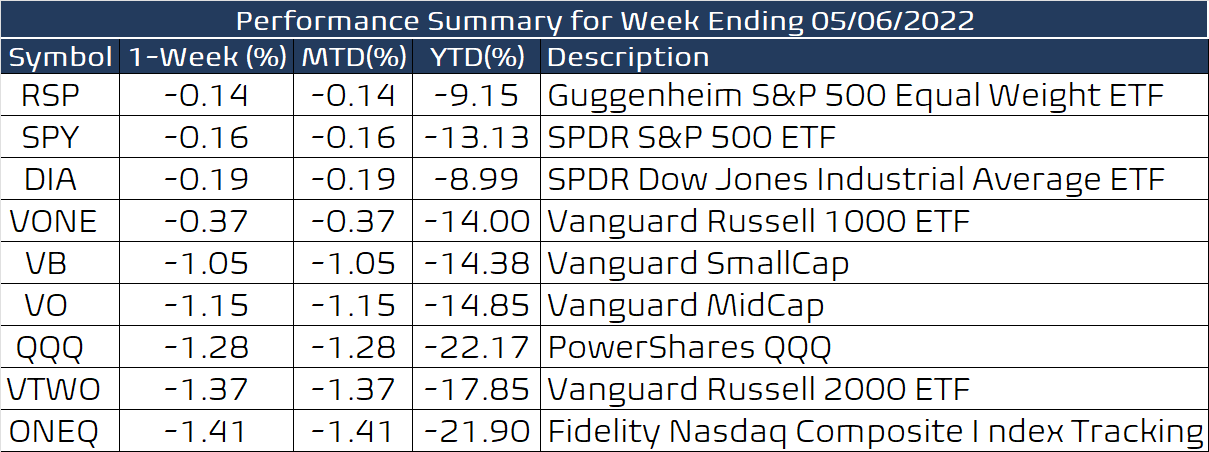
Performance Summary
With two days of changes greater than 3% in either direction, it was a rough week. Technology shares were weak in the face of rising rates. On the other hand, the dollar trended higher nicely, so currency traders were happy.
The net bull/bear balance remains firmly negative, below -60 again. The rally on Wednesday briefly turned the balance positive, showing how strong the rebound rally was. However, the reversal on Thursday was quite powerful.

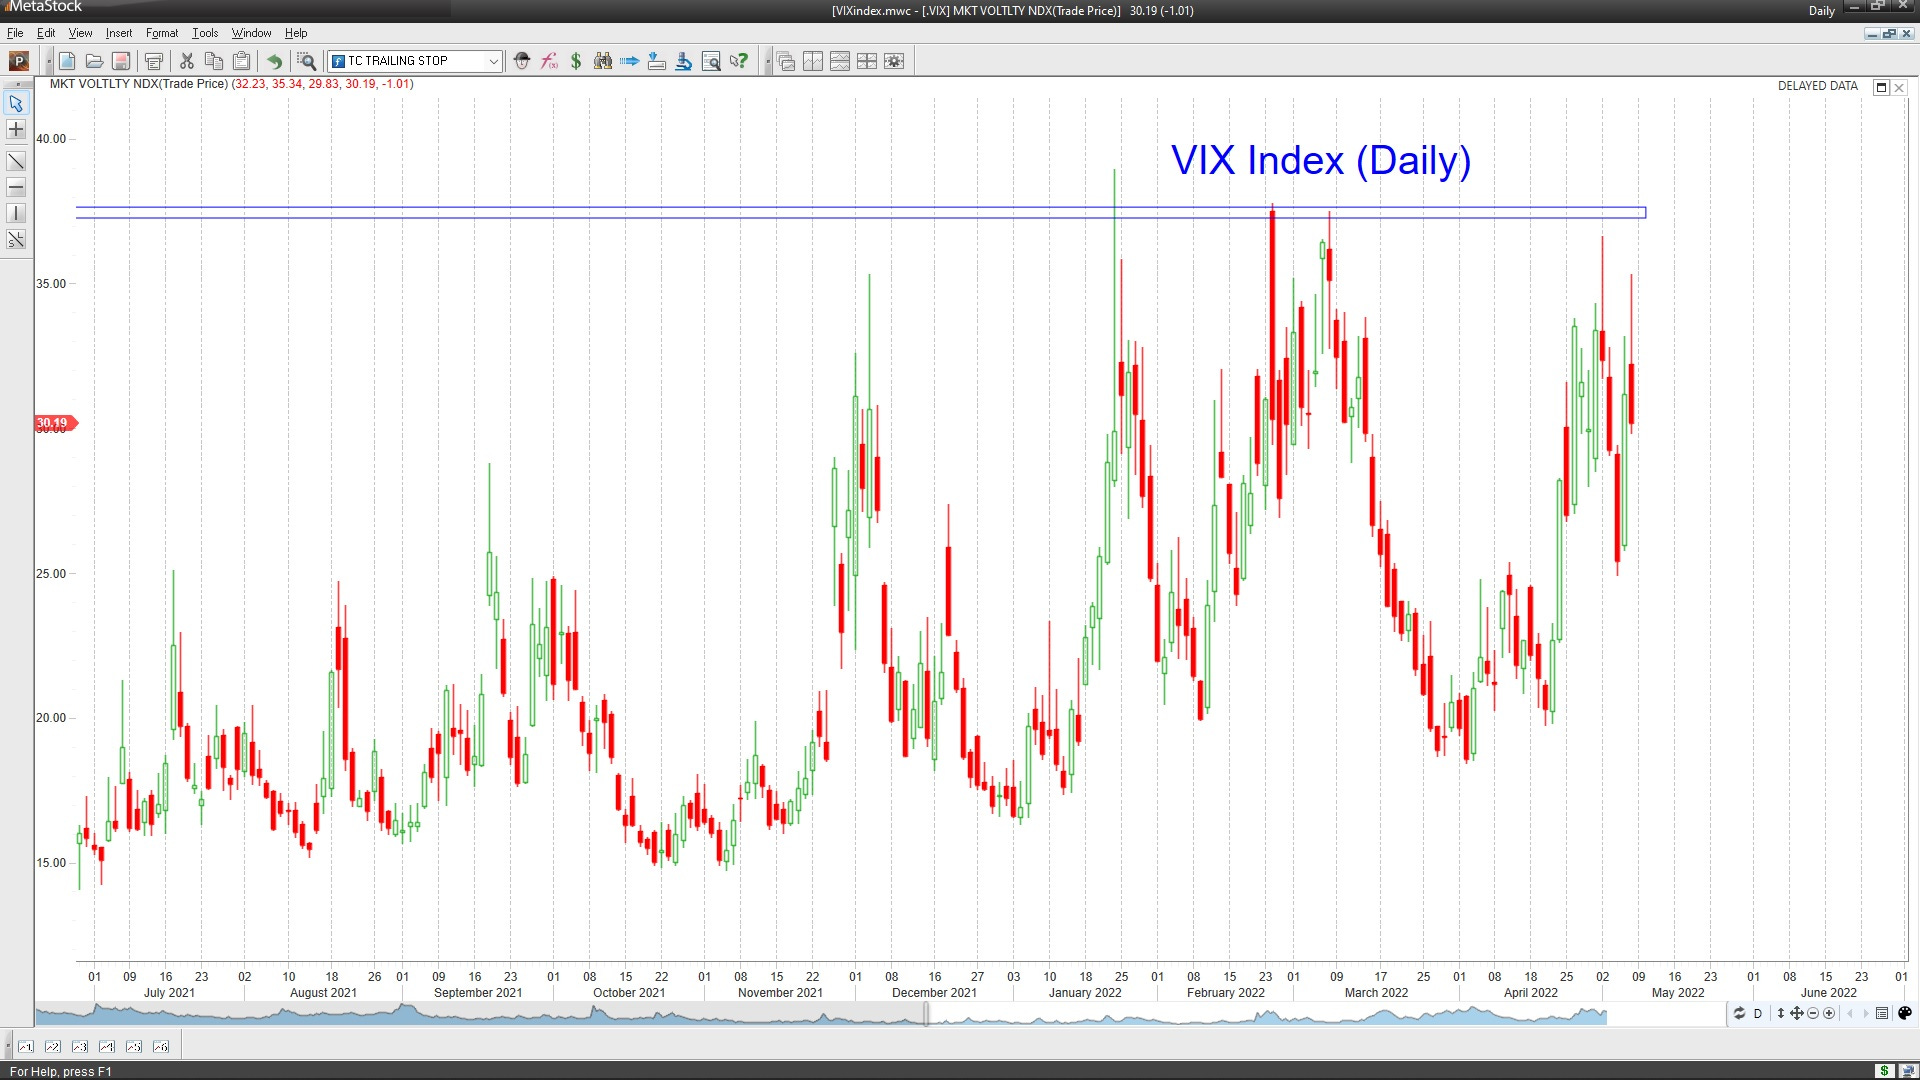
The VIX index retested the previous highs as we expected last week but then pulled off that level. We can hope that this will provide some relief next week.
Evolution of T-Note Yields
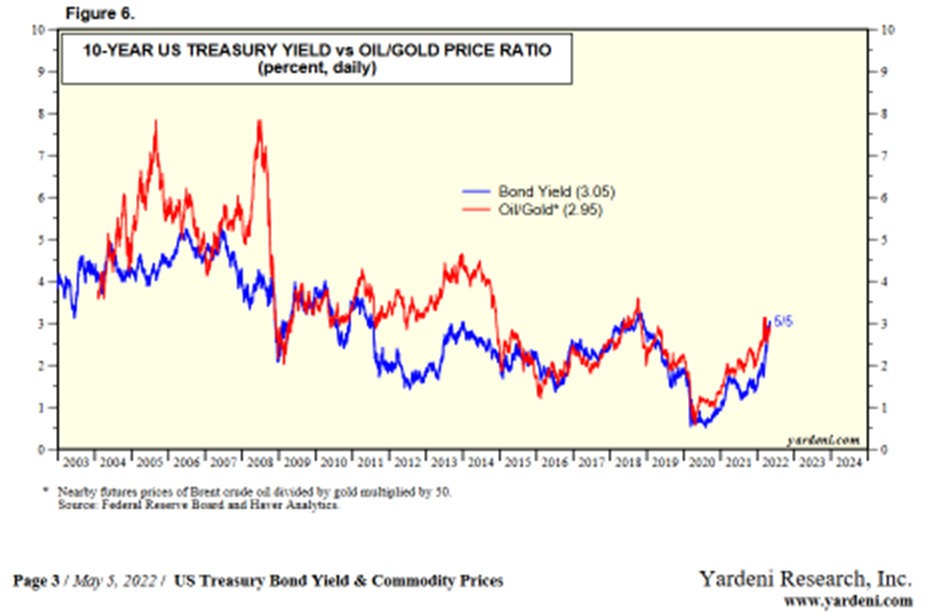
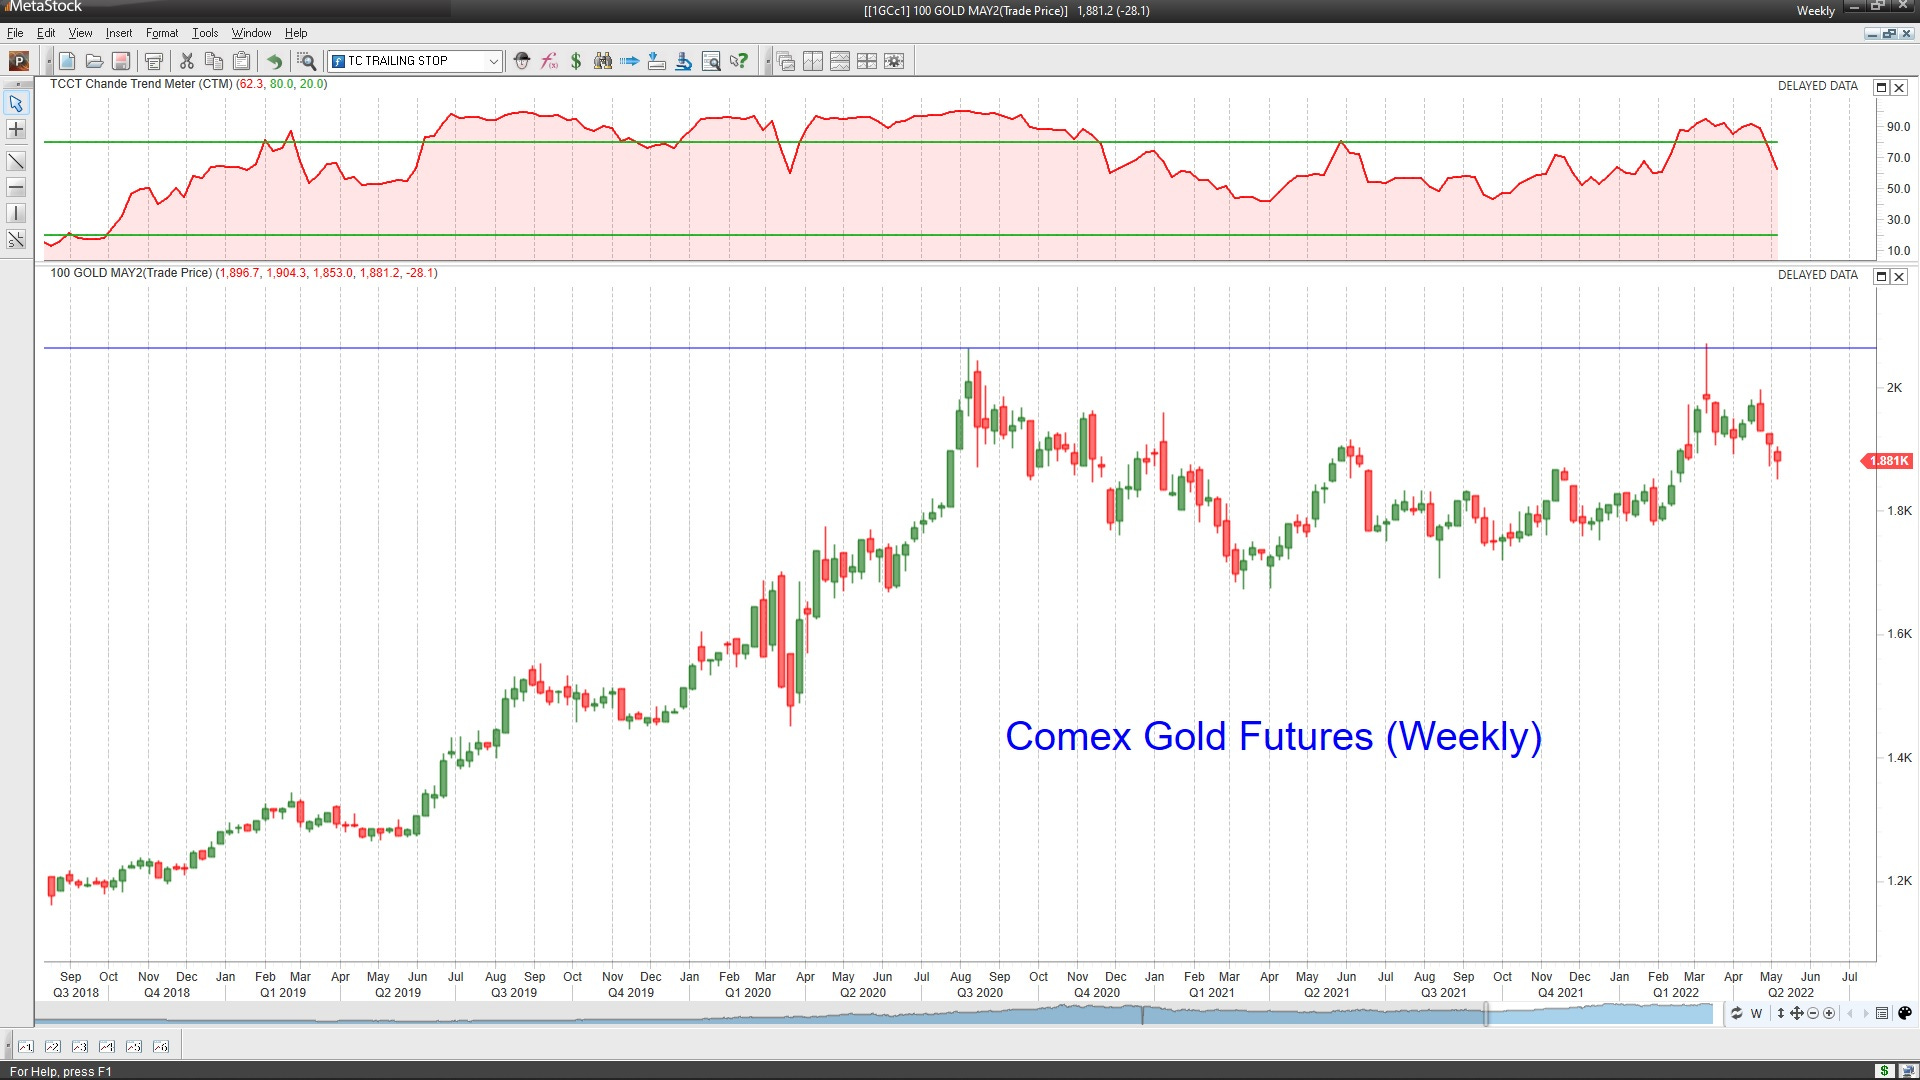
Ed Yardeni of Yardeni Research shows a close correlation between the 10-year Treasury yield and the 50x ratio of Brent crude oil spot price and gold spot price. For example, today, the Brent crude spot price is $112.86, and the gold spot price is 1882.87, so the 50x ratio is (112.86*50/1882.87=2.997 or ~3%, and the spot T-note yield is about 3.13%.
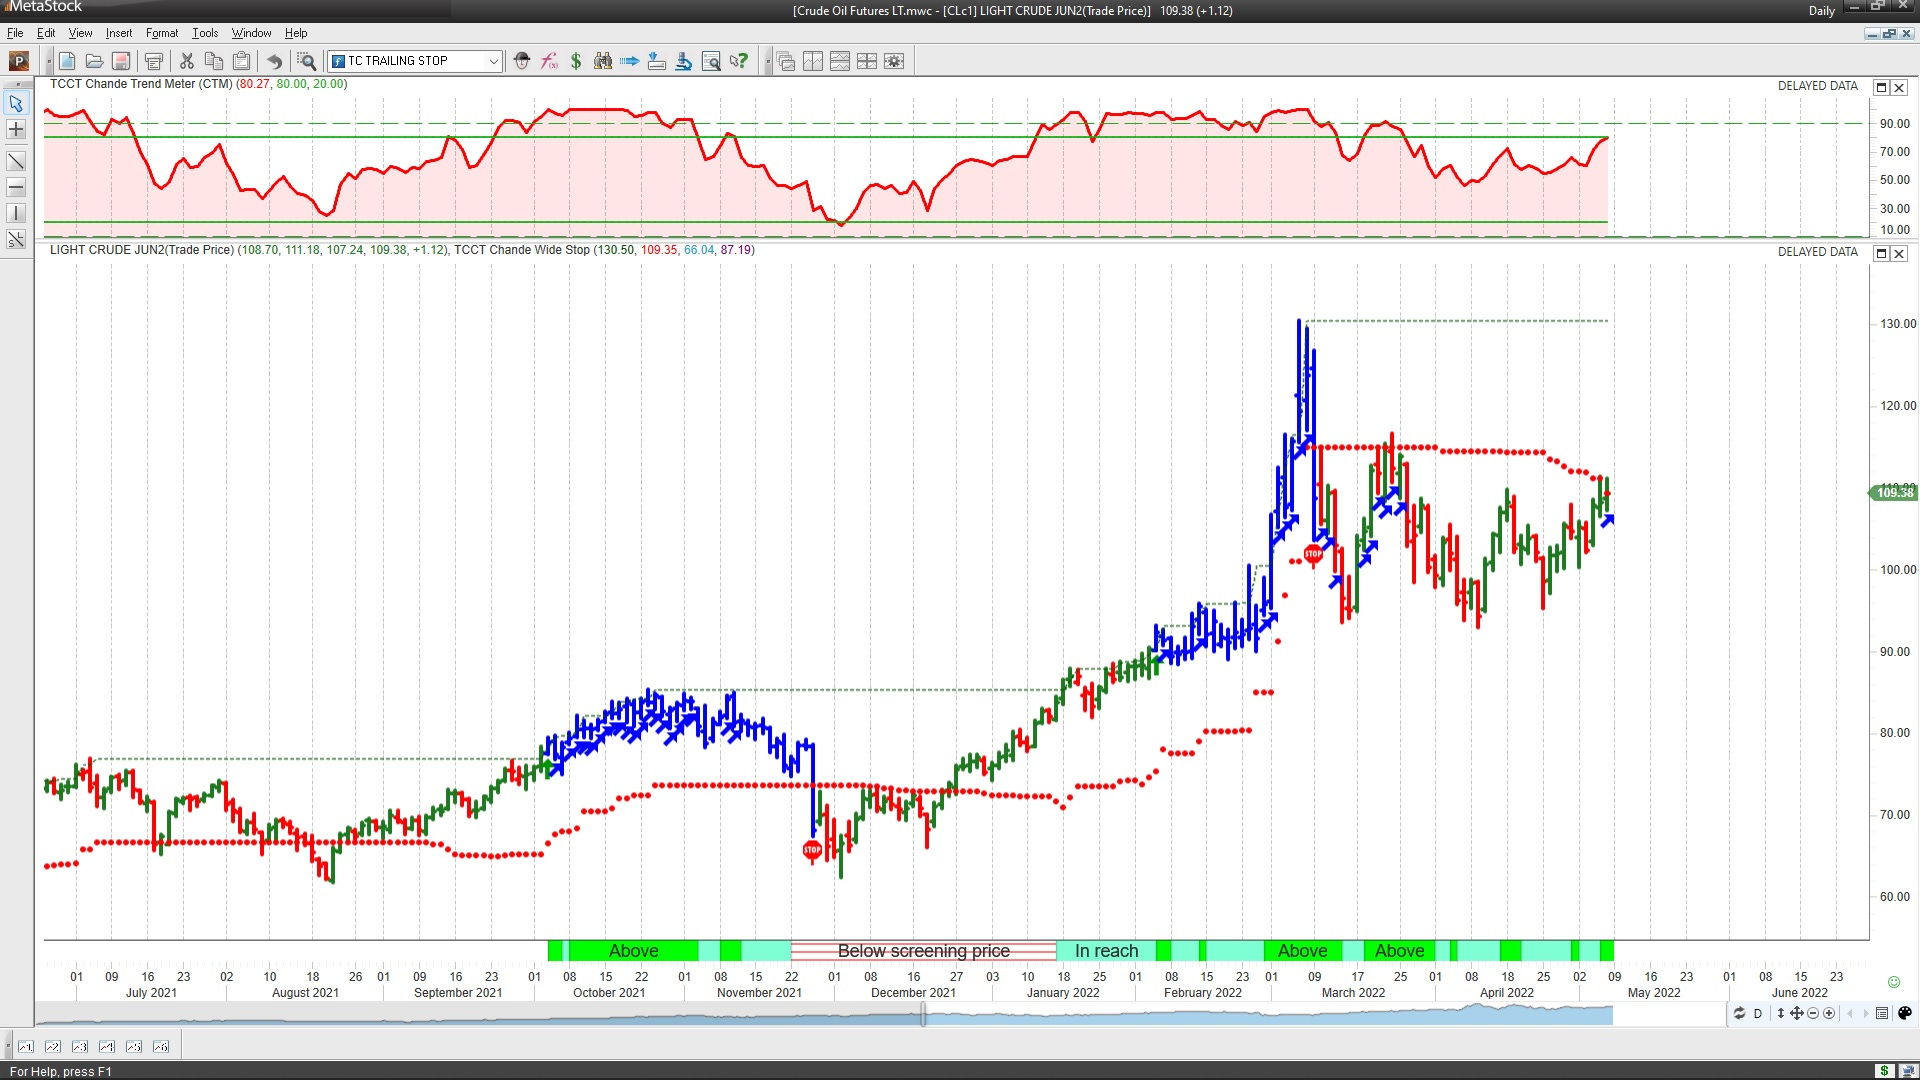
The charts for Comex Gold futures and Light Sweet Crude Oil futures shown below are now trading below their recent highs made during the early days of the Ukraine invasion. Add to this the move by the EU to reduce energy imports from Russia, the weakening of global growth due to rising rates, and COVID-19 lockdowns in China, and it appears that neither gold nor oil is racing to new highs. Therefore, we may expect the oil/gold ratio to be approximately stable near current values for the next few months. (Of course, the Ukraine invasion could always perturb the current equilibrium.)
The long-term monthly chart of the 10-year T-Note futures contract shows it approaching critical support. A Fibonacci extension analysis also indicates that the bottom of the two support zones coincides loosely with key levels at 114.34 and 104.50. The chart plus the potential stability in the oil/gold ratio implies that the T-Note might be in a support zone, and any stability in this rate over the next few months will help stocks find support.
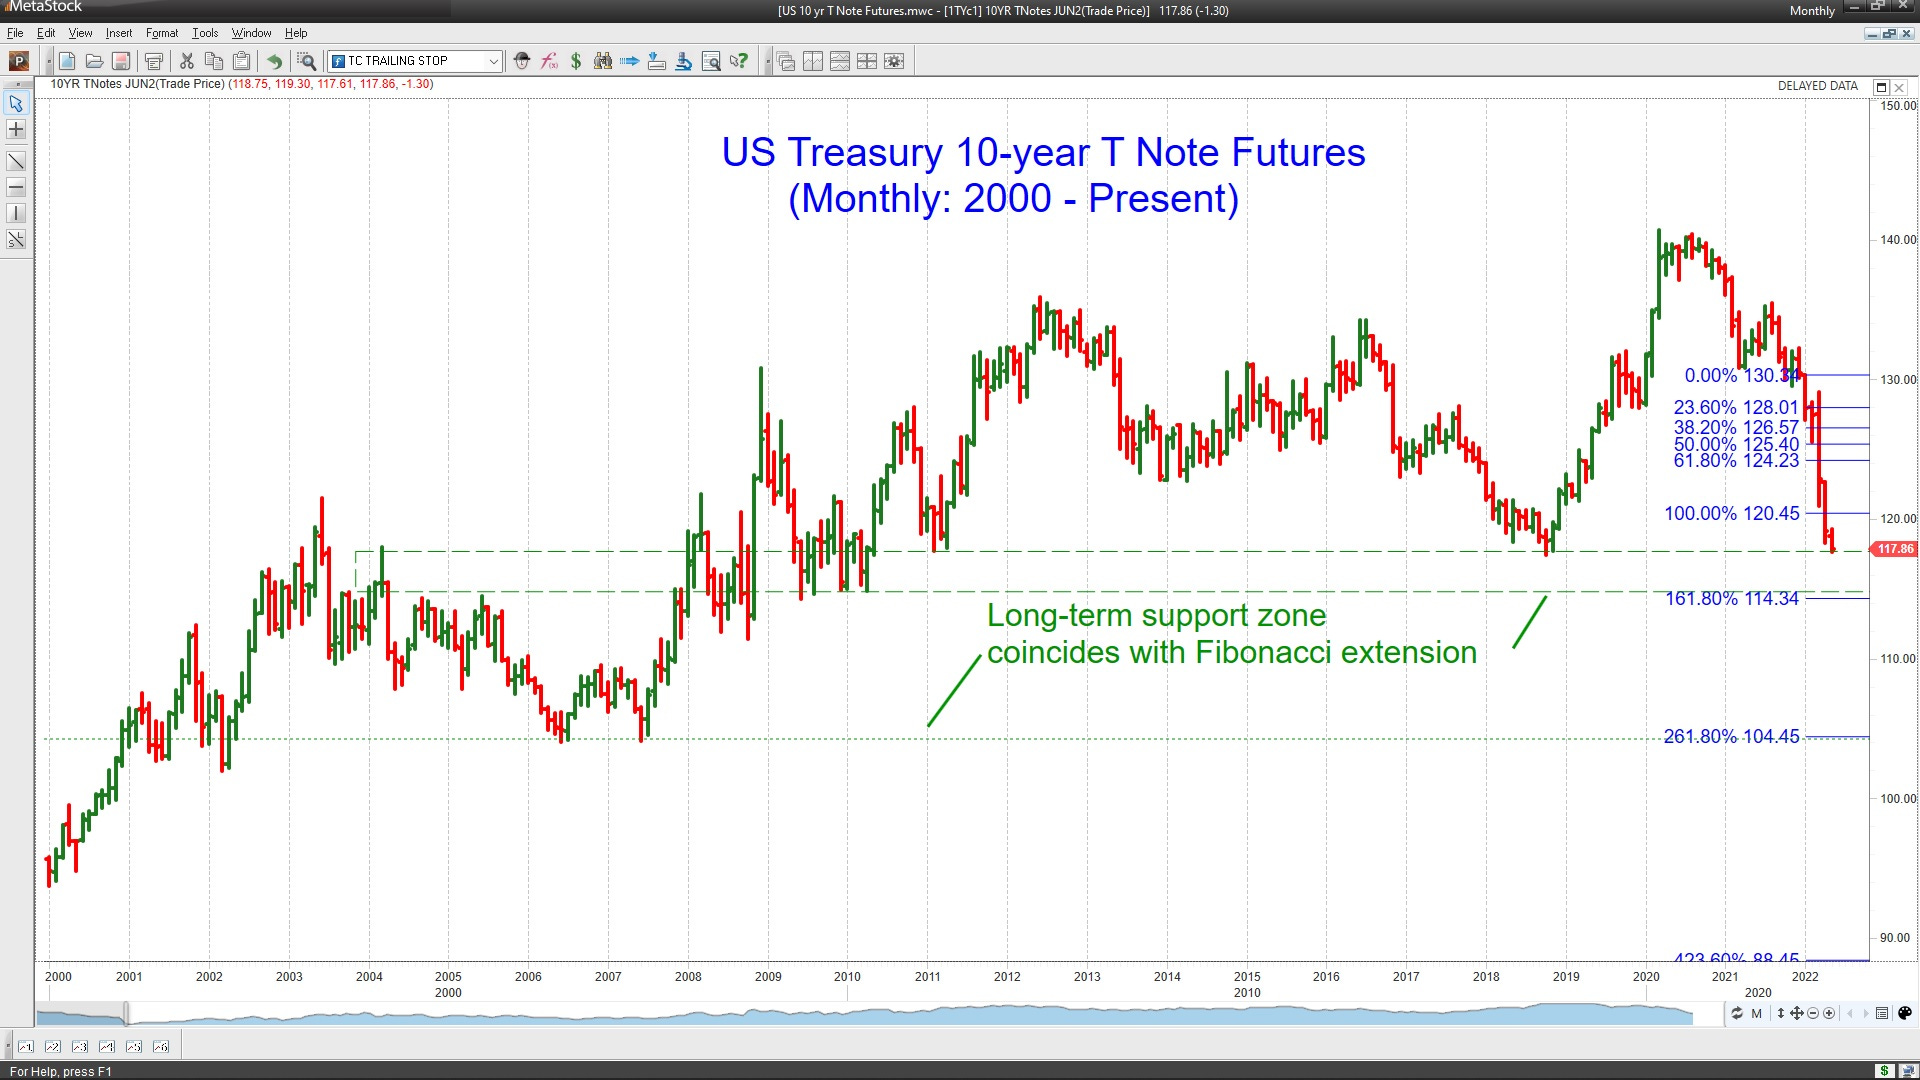
Using the Dec-21 10-year T-Note yield low of 1.35% and its February 2022 peak of 2.05% as reference levels, then a Fibonacci extension analysis gives us an upside target of 3.18% on average the yield. So, optimistically, we could find resistance to rapid increases in yields, perhaps around the 3.15%~3.3% zone. Some are eying the 3.5% level as a “round-number” resistance, but in any case, these are only guesses.
Last week, you might remember that we made a similar observation about the 2-year T-Note yield since it is a proxy for the Federal Reserve’s intentions. Its prices held above support this week, a welcome sign.
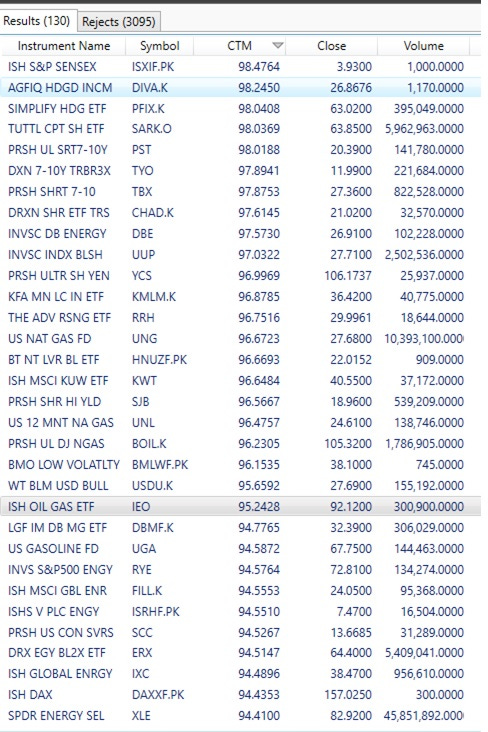
A scan of the major us ETFs using the Chande Trend Meter and MetaStock shows inverse bond, stock, and currency ETFs, along with energy and dollar-bull ETFs with strong uptrends.
MetaStock Conference Week Of May 16-20
You're invited to join us at the Online Traders Conference on May 16-20, 2022, sponsored by MetaStock and Technical Analysis of Stocks and Commodities and the Chartered Market Technicians Association.
Thirty-six industry experts are going to show you what it takes to be a successful trader in ANY market with ANY account size. This event is for traders of all levels, and all presentations will be recorded and delivered to everyone that registers.
Register Here to Save Your Space. It's Free
Don't miss a moment: As a bonus for registering you'll get access to all of the recordings at no charge for you to watch at your leisure. Learn more about the presenters and get more details about their presentations.
Bonus: Door Prizes! All registrants will be eligible to win random drawings for valuable prizes. We will have multiple drawings each day. Don't miss it.*
On Monday at 1:00 PM EST, I will be speaking on “Top Trading Opportunities with Chande Trend Meter.” Please stop by or review their Youtube recording.
Wrap-up
My posts should give you a good starting point, with context and suggestions if you like to research. Then, you can visit my website, chandeindicators.com, for more information and ideas. I hope you stay tuned and help by subscribing and recommending it to your friends and colleagues.
Thank you for spending some time with me.
Disclaimer
And now for some housekeeping. This publication is for “edutainment,” education, information, and entertainment purposes only. It is not to be construed as investment advice. Past performance is not necessarily indicative of future results. Our disclaimer at chandeindicators.com is included herein by reference.