


Slow Motion Ascent
We take a look at the SPY and show some

Overview
The market continued its labored ascent to new highs with little conviction.
Small stock indexes continued their relative outperformance versus large-cap stocks but remained in a broad sideways consolidation.
The value-growth debate has tilted towards large and mega-cap growth.
Key Question
With the SPY / S&P-500 making new highs, albeit reluctantly, should we look for a breakout or reversal?
Performance Snapshot
The market continued in an uptrend, with small stocks taking the lead (VTWO), along with a recovery in the NASDAQ (ONEQ) and technology (QQQ). The market has made a new high this week, but with low momentum. For example, the 14-day RSI is well below 70. On the other hand, our sensitive bull-bear leverage ETF indicator remains bullish (since 05/21/21), well above 40. So, we will assume that an uptrend is in place until proven otherwise.


You can clearly see the lack of strong momentum near new highs in the US sector’s trend spectrum. Only 20% of the sectors we follow were rising in the very short term. This means there is some selling across the sectors even as the indexes try to make new highs. For example, strong sectors from only a few weeks ago are weaker, such as home construction, banks, materials, and financials.
One bright spot for the market is that the SVXY ProShares Short VIX Short-term Futures ETF made new highs this week, suggesting that volatility is decreasing, usually a sign that the market is trending higher.

The Vanguard Market-Cap ETFs are offering an interesting insight into the value-growth debate. As part of the market’s rotation, value stocks are lagging, and mega-cap and large-cap stocks are leading.

S&P 500 at Inflection Point
The SPY ETF shows the S&P-500 index breaking out of an ascending triangle with a rising trendline. My short-term oscillators are both above 50, showing that the breakout is supported by short-term momentum. However, as we have seen above, market breadth is a bit weak. Small-stocks peeked above their early-March highs and then pulled back a bit.
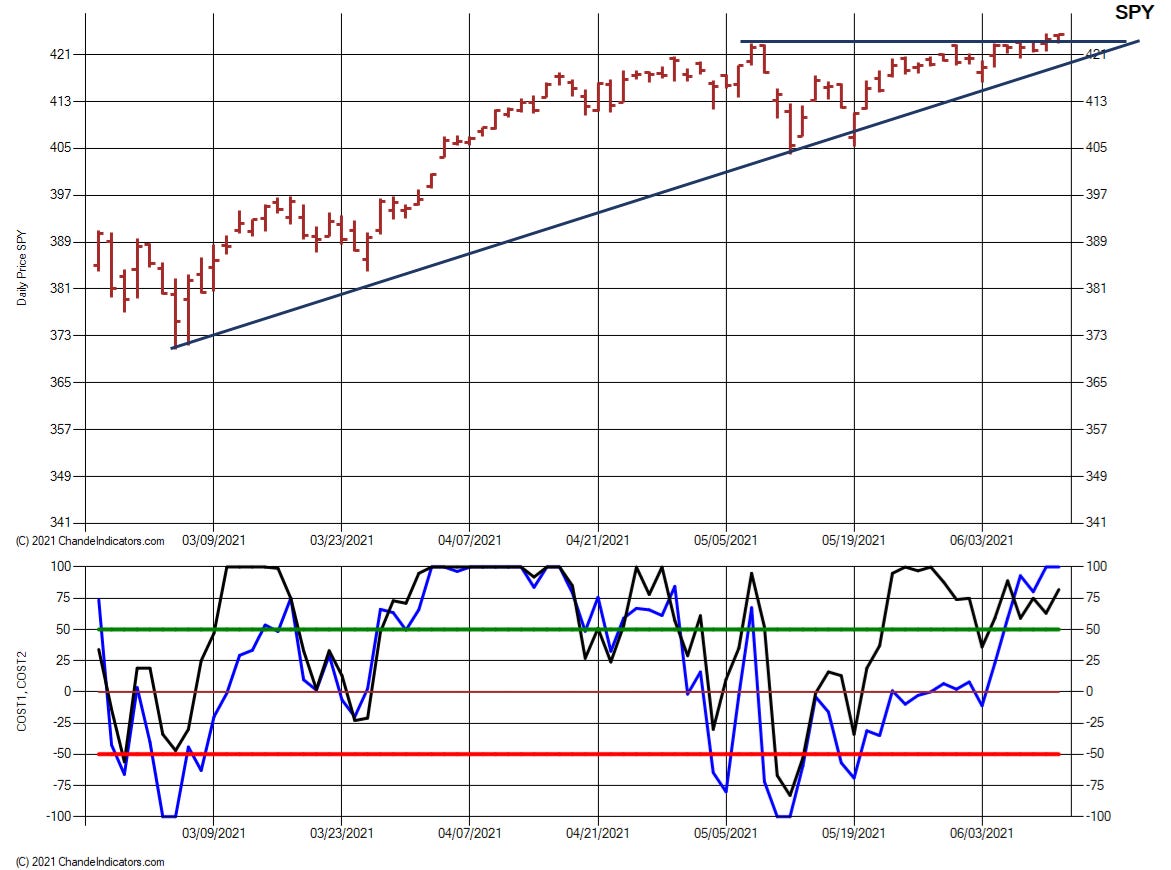

As the above chart shows, the oscillators point to higher prices, but the market is laboring in its ascent. The market is at an inflection point. It needs to push higher with conviction or pull back to regroup. I favor a small pullback, perhaps to the uptrend line, so the market can catch its breath before heading higher.
Strongest Stocks in our Database

I used our Stock Finder table to look for stocks with strong RPM and strong technical strength of all four oscillators. Last week’s post has a detailed explanation of the terms in the table.
Wrap-up
If you like to do your own research, my posts should give you a good starting point, with context and suggestions. You can visit my website, chandeindicators.com, for more information and ideas. I hope you will stay tuned and help by subscribing and recommending it to your friends and colleagues.
Thank you for spending some time with me.
Disclaimer
And now for some housekeeping. This publication is for “edutainment,” education, information, and entertainment purposes only. It is not to be construed as investment advice. Past performance is not necessarily indicative of future results. Our disclaimer at chandeindicators.com is included herein by reference.