

Ruble Rubble = Commodities Crunch
Ruble Rubble = Commodities Crunch
The inflationary implications of Russia's least-favored nation status.

Overview
January and February were both negative months in the market. Historically, this implies a flat-to-down year for the S&P-500 index. The risks from the Ukraine invasion are a wild-card for the next few months, in addition to the launch of a rate-tightening cycle by the FOMC.
The US February jobs report was strong, and previous months were revised upwards. Our economy created an estimated 678,000 new jobs, but wage growth moderated, good signs for the economy.
Fed Chair Powell’s testimony calmed the markets as he clarified the path of interest rates hikes (25-bp steps) and pointed to a gradual roll-off of the bloated balance sheet. However, he emphasized they would carefully monitor incoming data and Ukraine's effects, thus avoiding risks of over-tightening.
Fast-moving global sanctions reduced the Russian Ruble to rubble as the Russian economy was severed from global financial networks, and Russia acquired a least-favored nation status. In addition, the market fears a commodity crunch due to the partial or total loss of wheat, energy, base, and precious metal exports.
The human cost of the war in Ukraine is expected to rise rapidly, even as Russia’s military campaign bogs down and Russia resorts to extreme measures.
The war-zone headlines from Ukraine kept the markets in check while adding volatility. However, the broader market seems to have made a double bottom and is holding above recent lows. Interest rates fell, and commodities such as Wheat and Oil exploded higher.

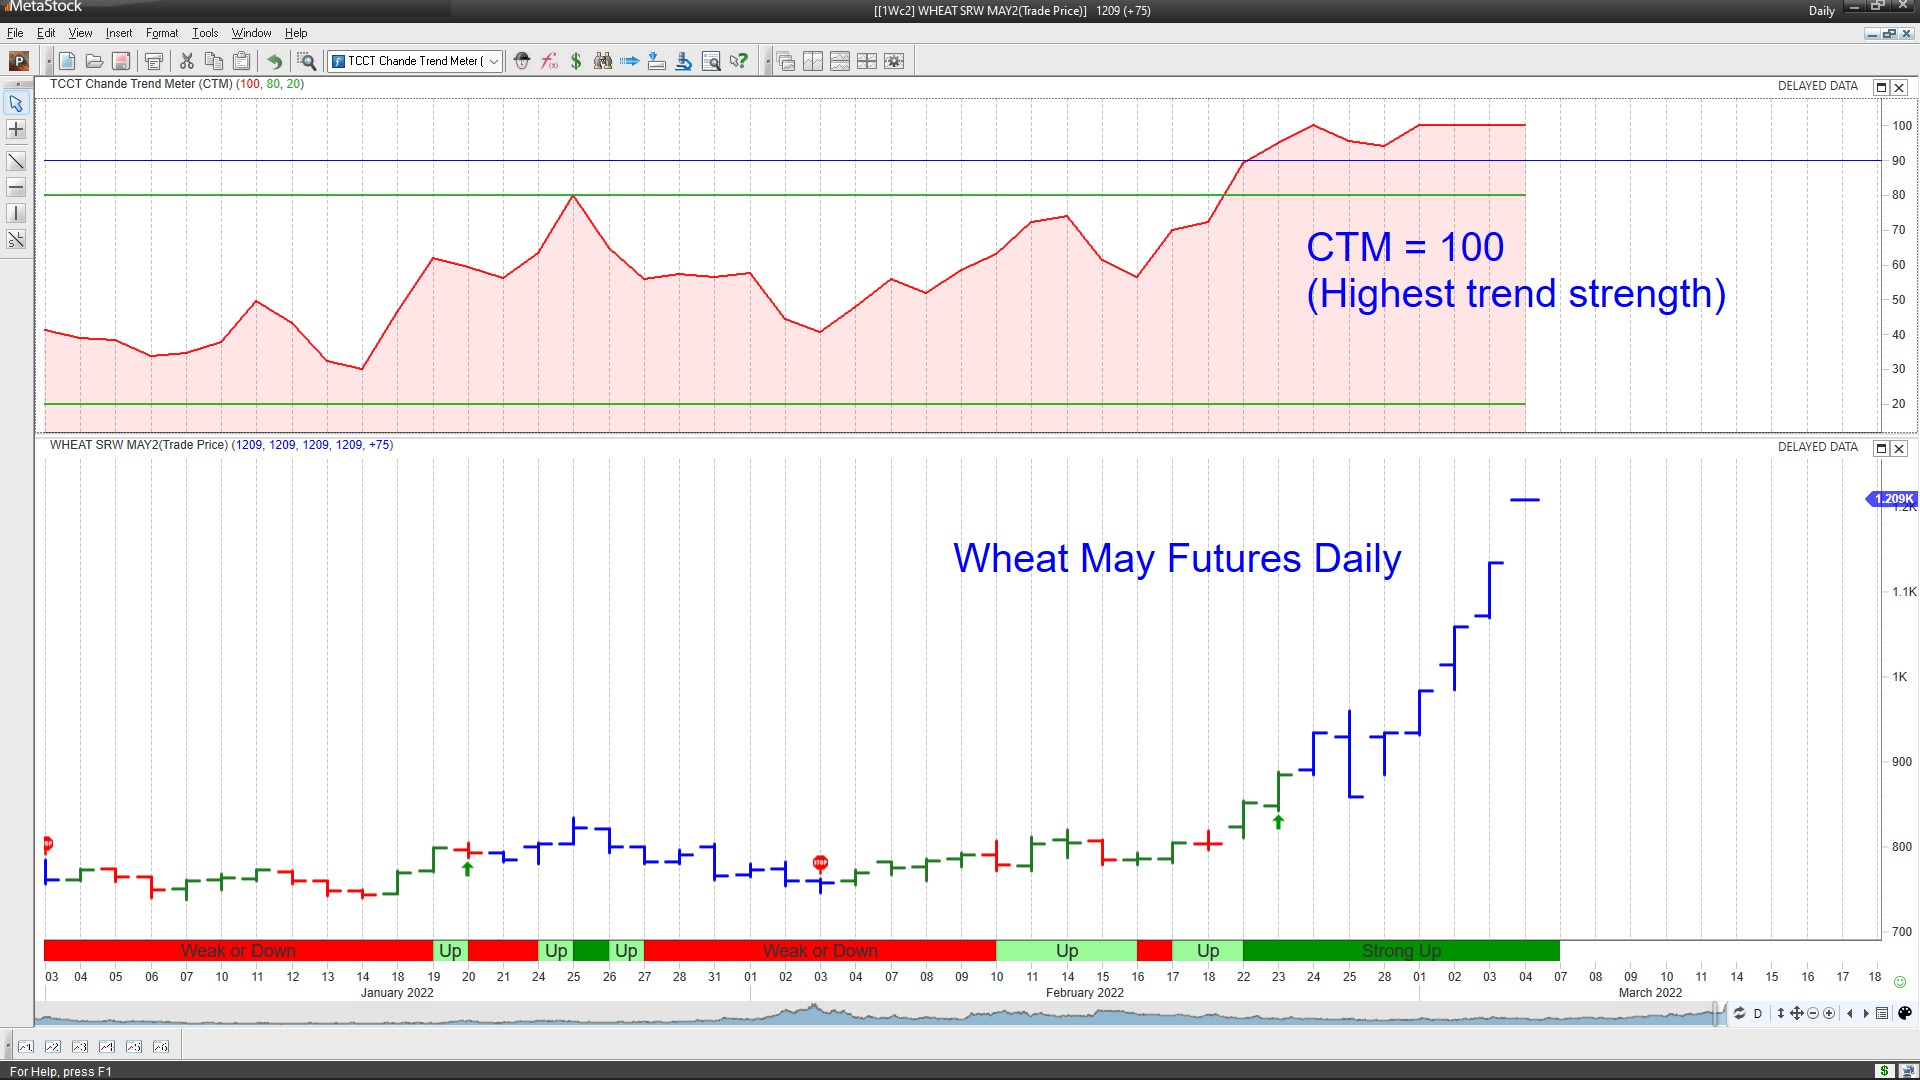
Wheat futures contracts exploded higher this week in response to the potential loss of up to 30% of the world’s wheat exports from Ukraine and Russia. (Chart courtesy MetaStock.)
Key Question
The war in Ukraine could cause a melt-up in commodity prices because there is not enough spare production capacity to replace any interruption in the exports of crude oil, wheat, aluminum, and gold. We look at some stocks and ETFs to participate in these trends.
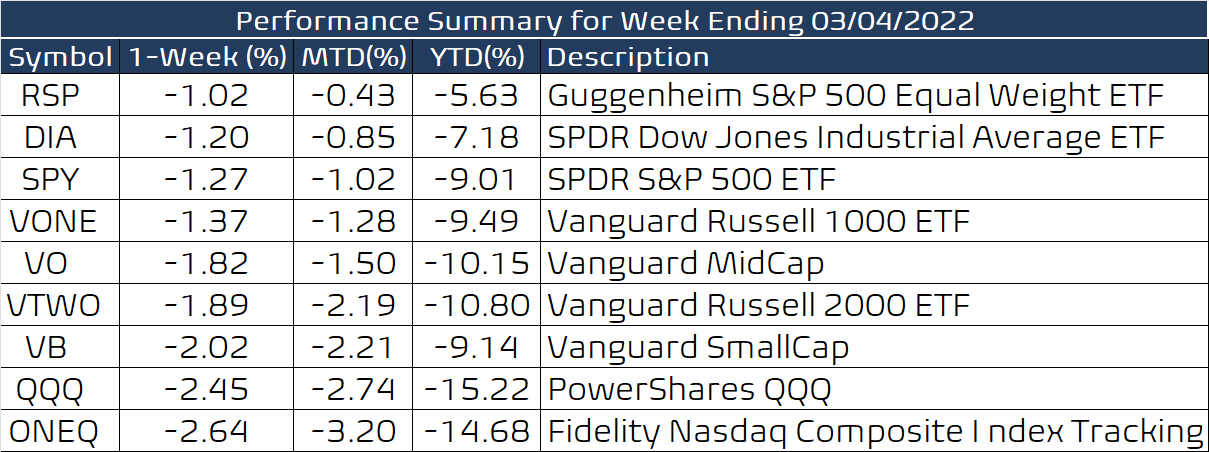
Performance Review
A losing week in the markets, with dispatches from the war front in Ukraine driving volatility. Though the Powell testimony helped calm the market a bit, fears of additional sanctions or unintended escalation in Ukraine (such as the bombing of nuclear power plants) kept prices in check.
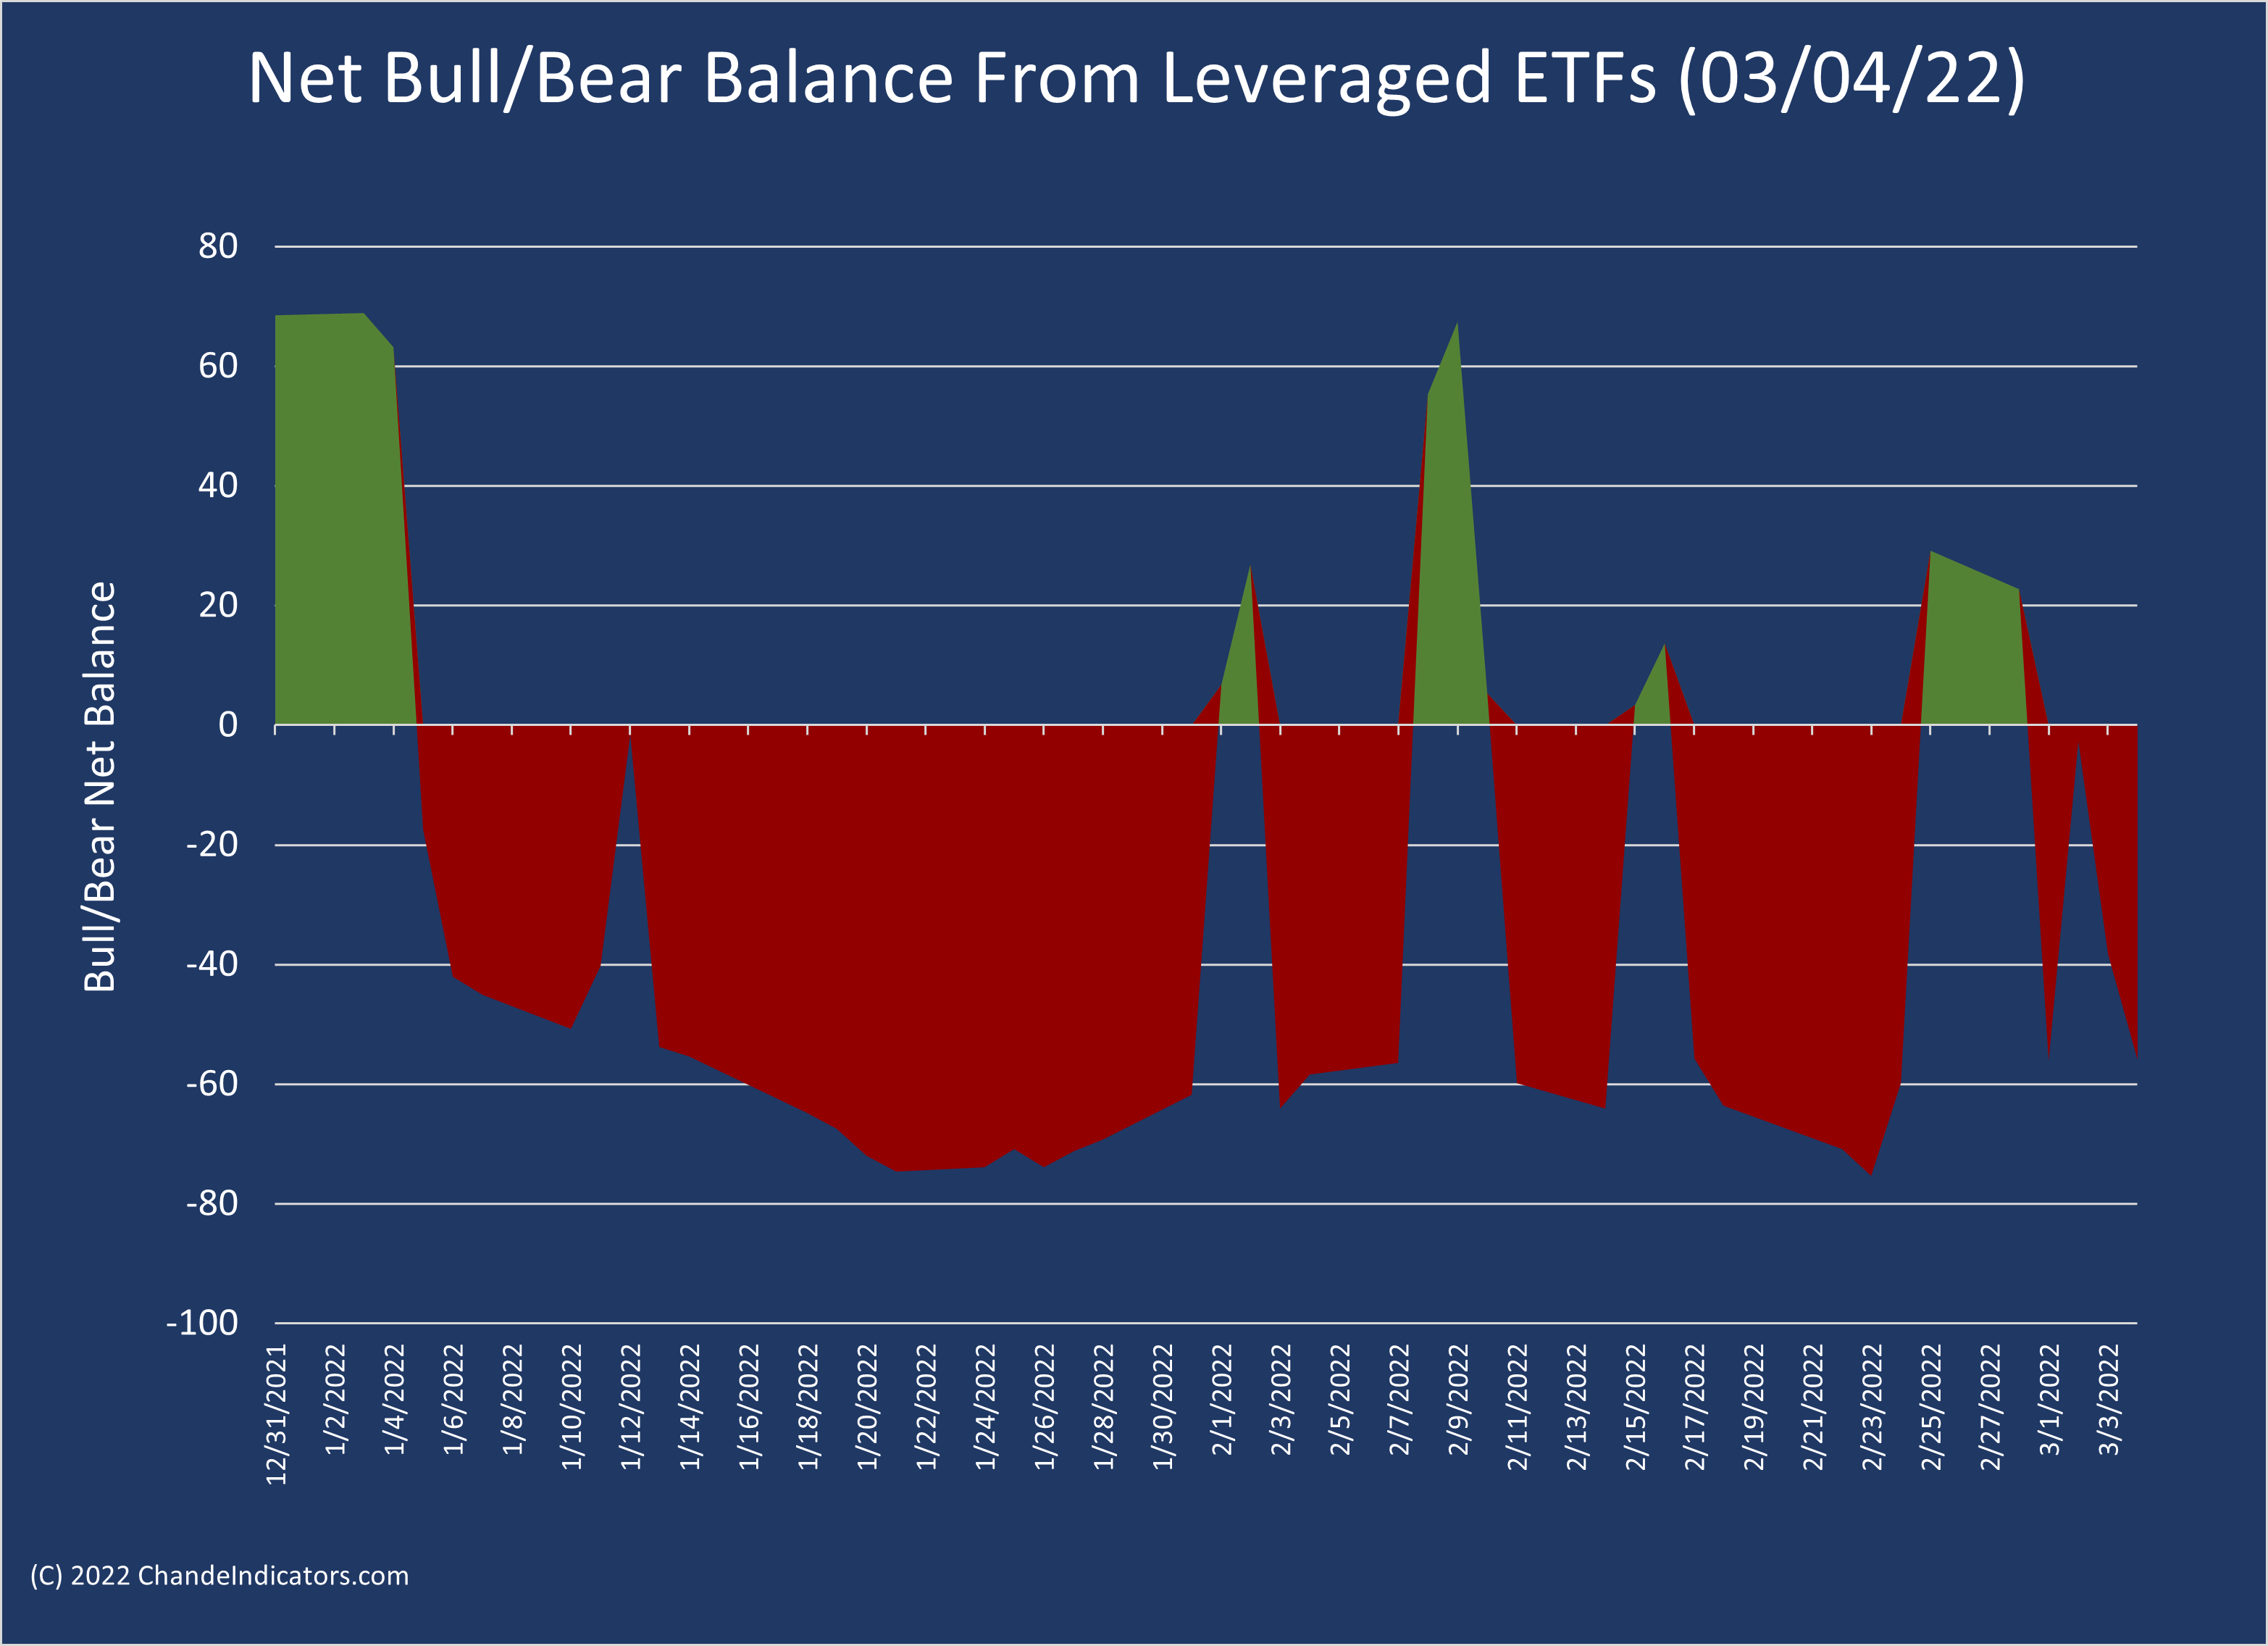
The choppy trading is visible in our net bull/bear blog, which ended the week in a bearish mood.
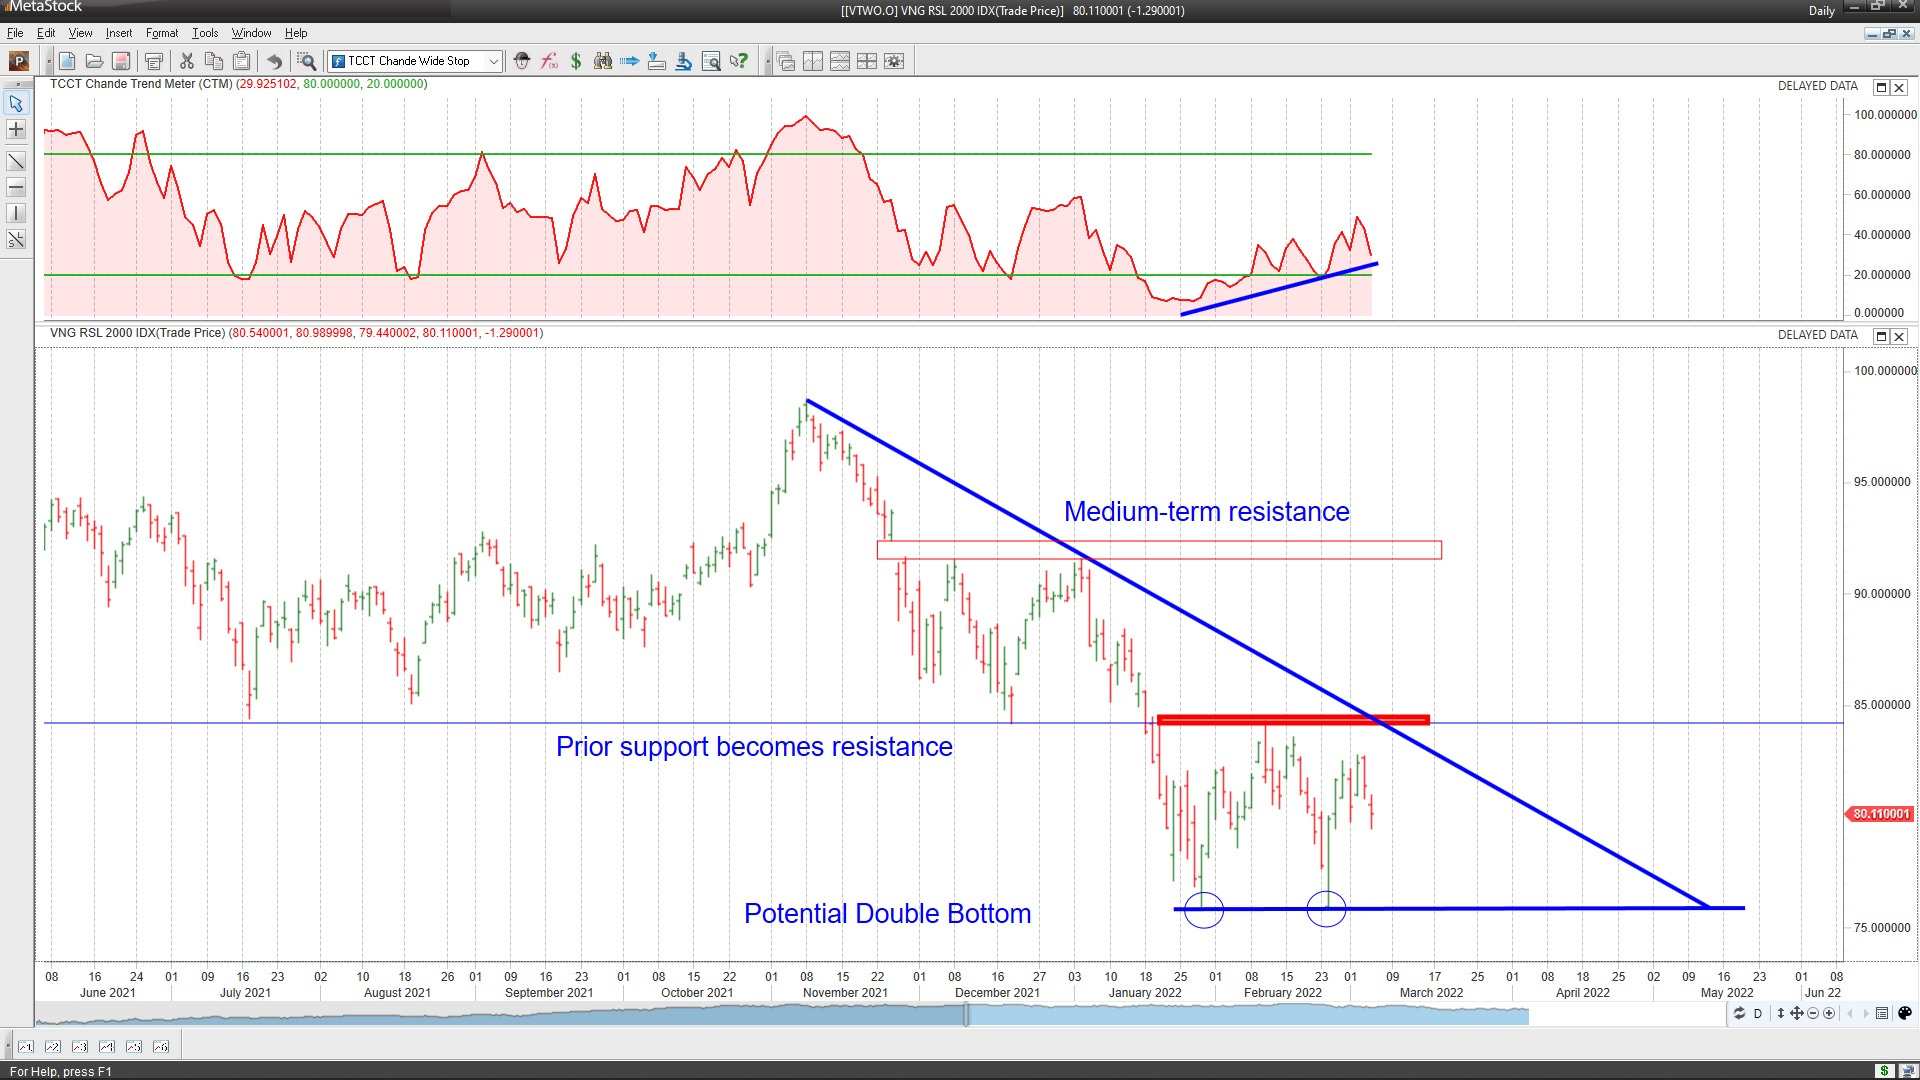
The Vanguard Russell 200 ETF (VTWO) chart captures the current state of play. A possible double bottom is capped by a strong down-trend line and resistance from prior support. Medium-term resistance is also clearly defined, so the market will have a lot of work to do if it rallies from here. Events could yet drive a retest of the recent lows.
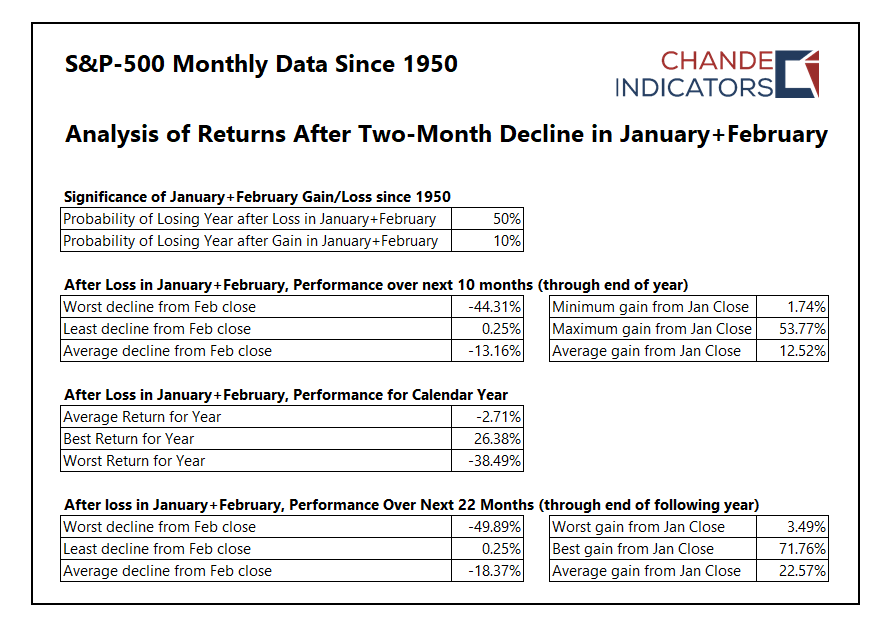
We repeat here a chart from our January-end blog. It shows a historical analysis of S&P-500 returns when the first two months jointly have negative returns. The average return for such years was -2.71%.
Commodity Melt-Up
We rank the major US ETFs using the Chande Trend Meter (via MetaStock). If you focus on ETFs with a CTM=100, you will find gold (SGOL), energy funds (UCO, XME, BNO, UGA), and agricultural funds (WEAT, TAGS). So this shows you where the major trends are: oil, wheat, and gold.

Here are a group of symbols you can follow to track or trade the commodity melt-up caused by the Ukraine invasion.
Energy Complex
XLE, USO, BNO, UGA, BP, CVX, MRO, BPT, etc.
Agricultural Complex
WEAT, SOYB, CORN, DE, MOS, CF
Metals Complex
XME, GLD, PALL, SILV, PMM, PMPIX, GOLD, PICK, XBM.TO
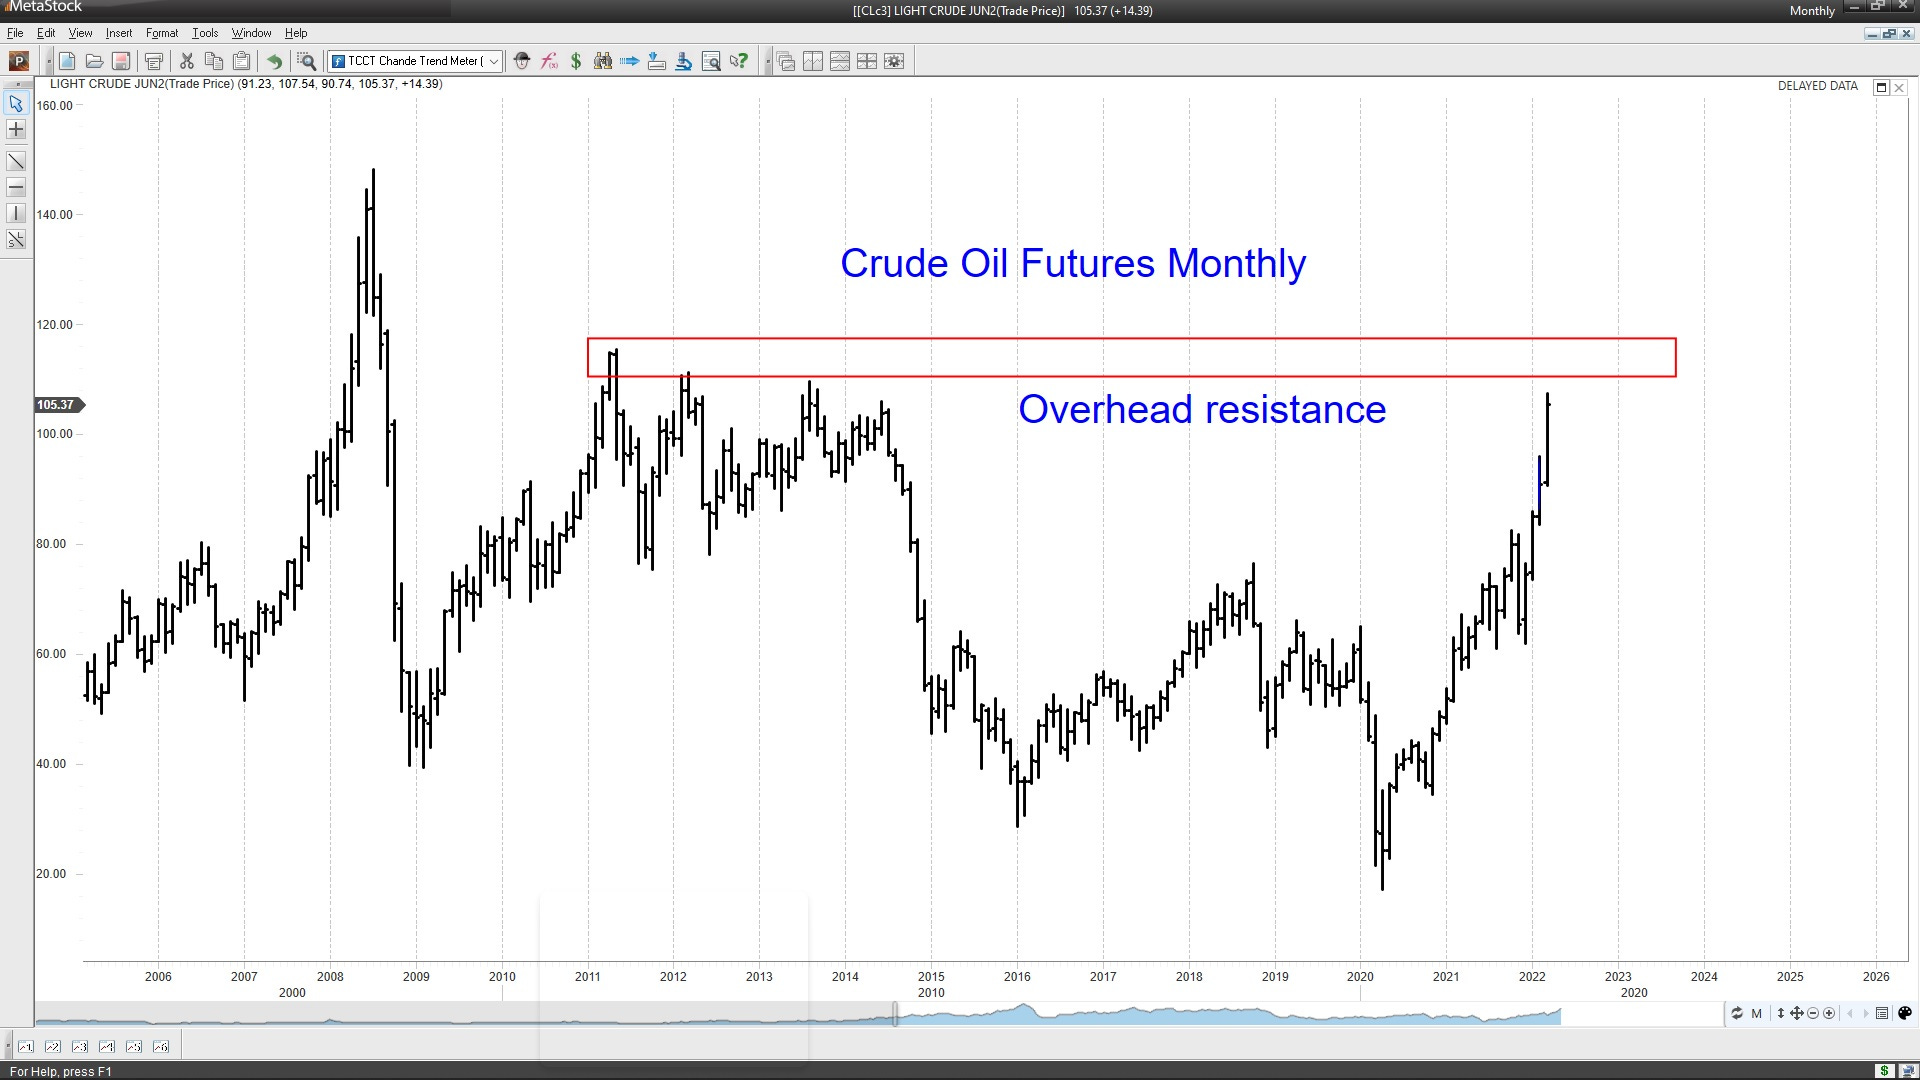
Crude oil futures are clearly approaching long-term resistance, but they have a rip-roaring rally, as you can see below in the monthly chart. The rally in oil has been bullish for refined products also (gasoline).
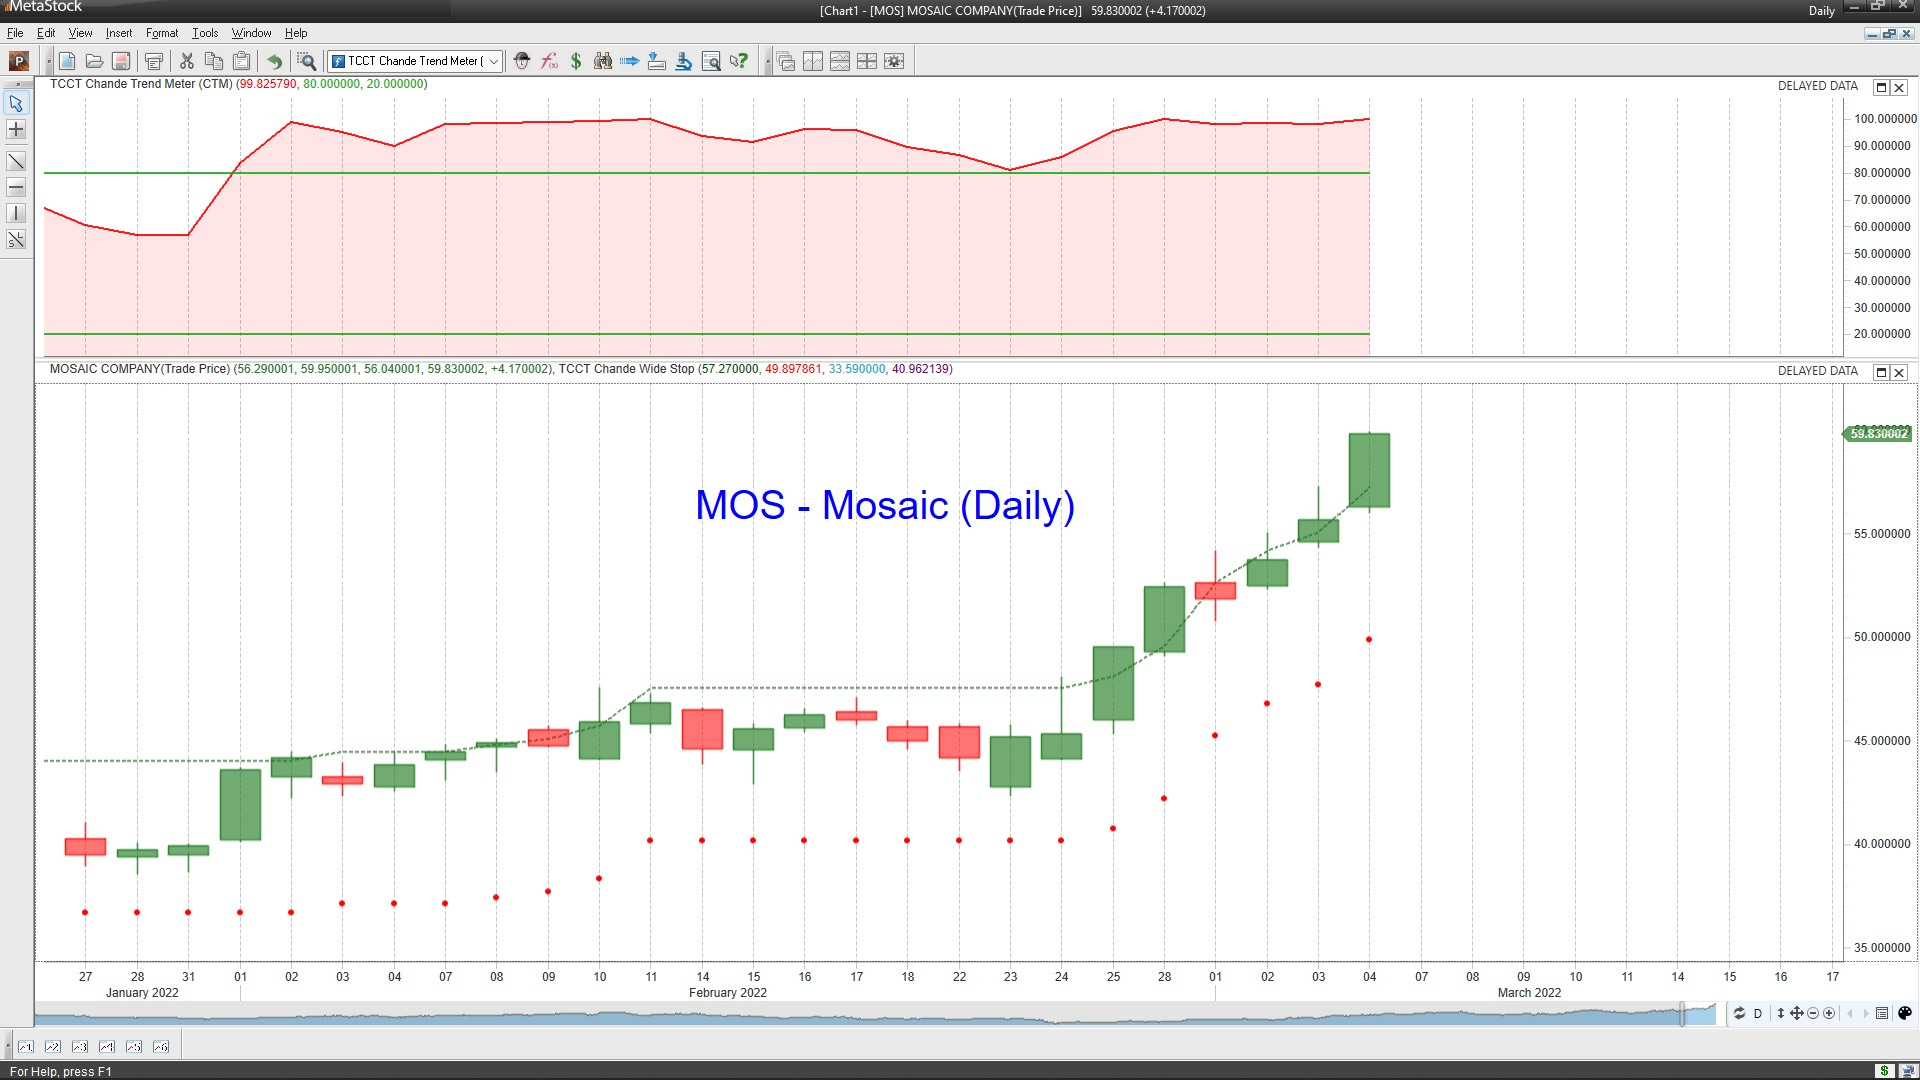
Here is a chart for MOS, a supplier of fertilizers, which has rallied along with Mosaic CF Industries (CF) and Deere (DE). Hence, the rally in Wheat is spilling into the broader agricultural sector.
It is not possible to predict exactly how the war in Ukraine will proceed or end, but the impact on Russia and its exports will be felt for some time until the supply shock can be resolved, which might take many months or even years.
Wrap-up
My posts should give you a good starting point, with context and suggestions if you like to do research. Then, you can visit my website, chandeindicators.com, for more information and ideas. I hope you stay tuned and help by subscribing and recommending it to your friends and colleagues.
Thank you for spending some time with me.
Disclaimer
And now for some housekeeping. This publication is for “edutainment,” education, information, and entertainment purposes only. It is not to be construed as investment advice. Past performance is not necessarily indicative of future results. Our disclaimer at chandeindicators.com is included herein by reference.