
Rebound!
The market's reversal was supported by good news on inflation and consumer spending.

The market rallied all week, rebounding from an oversold condition aided by consumer spending and cooling inflation data. The last few weeks have been stressful, but I hope my analysis has been helpful (see the table below).


Core Personal Consumption Expenditures (PCE), excluding food and energy costs, rose 4.9% in April, but slower than the 5.2% rate reported in March. Including food and energy, the April inflation rate was 6.3% (vs. 6.6% in March).
Consumer spending held up well and shifted to services (bars, restaurants, travel), rising 0.9% versus an upwardly revised 1.5% gain in March. In addition, retailers Macy’s and Nordstroms reported solid earnings and guidance. Hotel reservations remain only slightly below 2019 levels, and air travel was up 36% versus last per (per the TSA).
Evercore ISI discounted the possibility of a recession in the US., and Citi bank reported that their bear market checklist had dropped to only six negative indicators, which means this is a good entry point into the market, with average returns of 31% over the next year. Further, JP Morgan also indicated that conditions were too bearish and ripe for a rapid reversal.
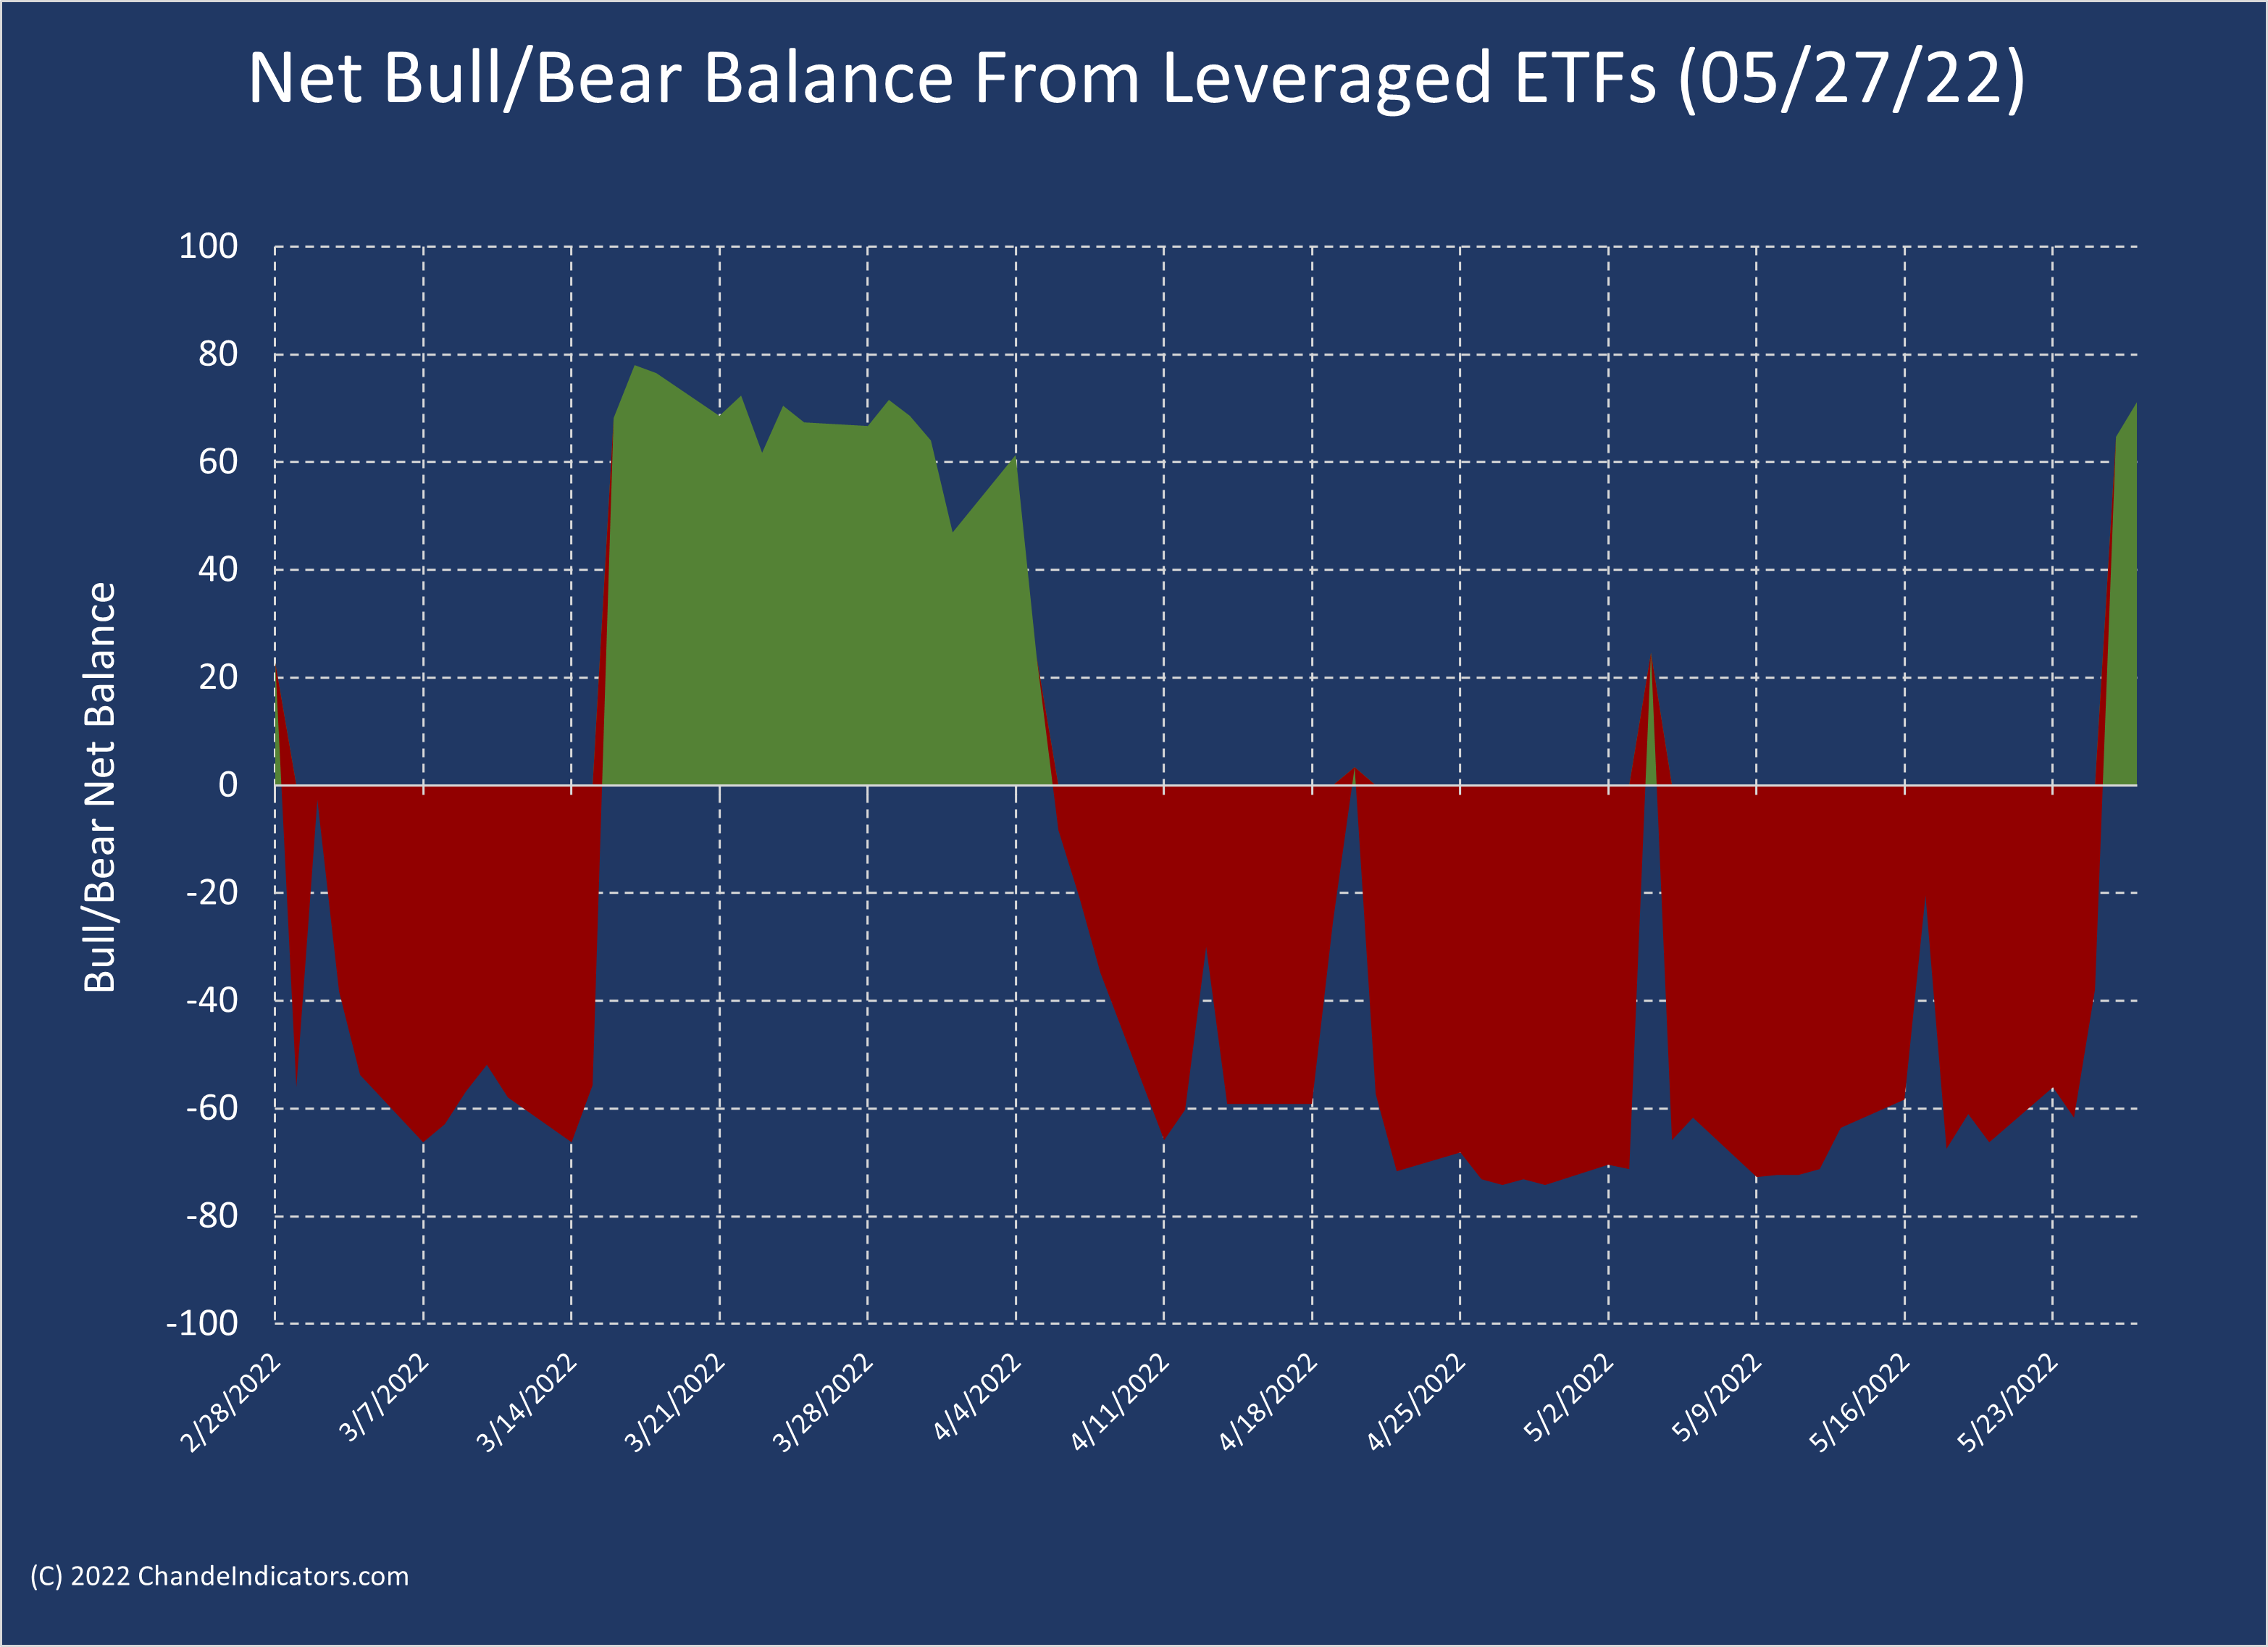
There is a strong possibility that this rebound will carry through for a few more weeks because it has pushed the net bull/bear balance above +60; we have a push above a key accelerating trailing exit and a long-entry from our swing system.
Key Question
Is this bounce for real? Opinions on the street are divided, with the consensus expecting the bounce to fail quickly. Analysts are unwilling to call a bottom without the VIX surging above 40. Some even want further declines to 3500 (or even 3200) on the S&P-500 index. Hence, we will look at the technical picture.
Performance Review
The market had a powerful rally, with tech stocks finding bids aplenty. The buying was broad-based, with excellent breadth and volume, perhaps meeting the expectations of many bears, who were waiting for a breadth thrust before getting in.

For the first time since the heavy selling began in April, the sensitive net bull/bear balance ended the week above +60, suggesting that an upside follow-through is likely. The net bull/bear reading signals a reversal confirmed by the push above an essential trailing stop and an entry from the swing system discussed below. So we will be keen to look for a rally similar to that in March.
The Bounce
The market bounced well this week, and many are now convinced this will lead to another bout of selling. But before we get there, let us look at the technical picture.
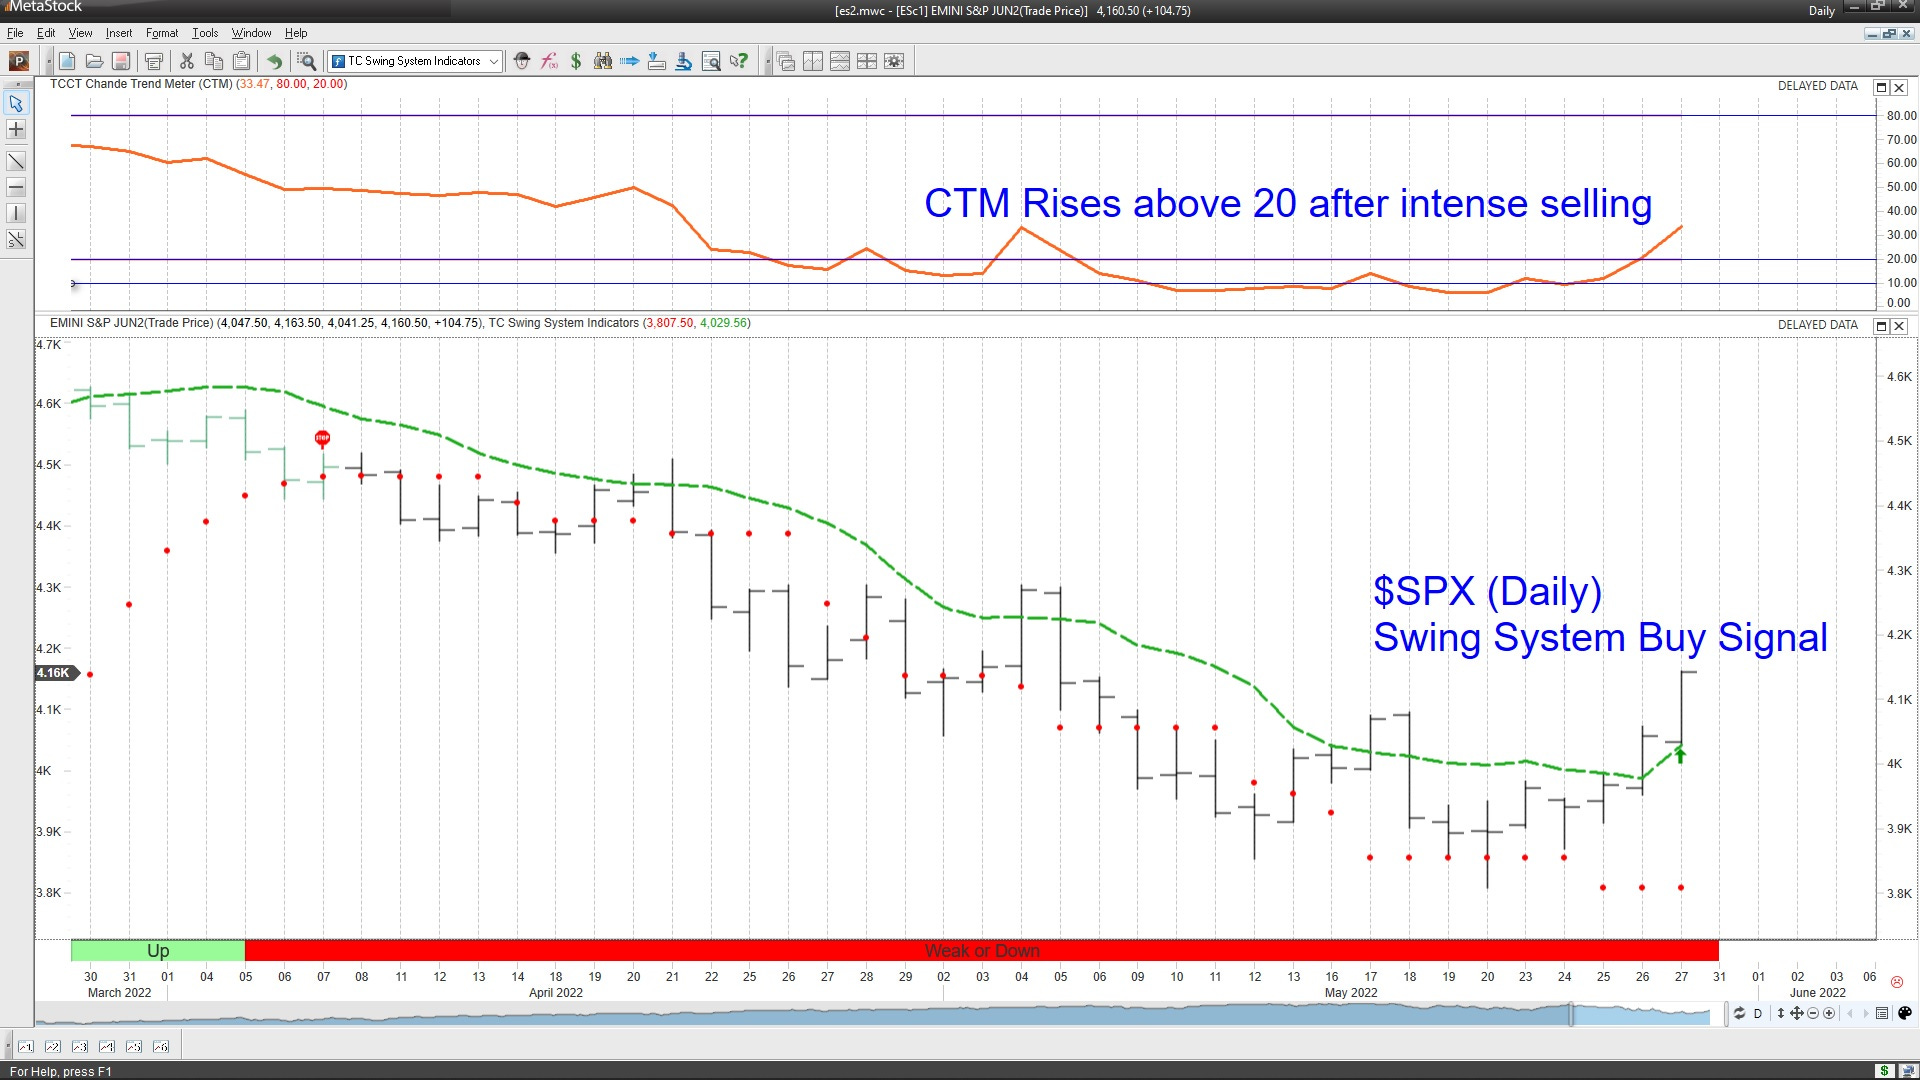
First, the market has rebounded above a key accelerating exit precisely as it did in March 2020. Second, it also generated a buy signal on our swing system that buys strength after weakness.
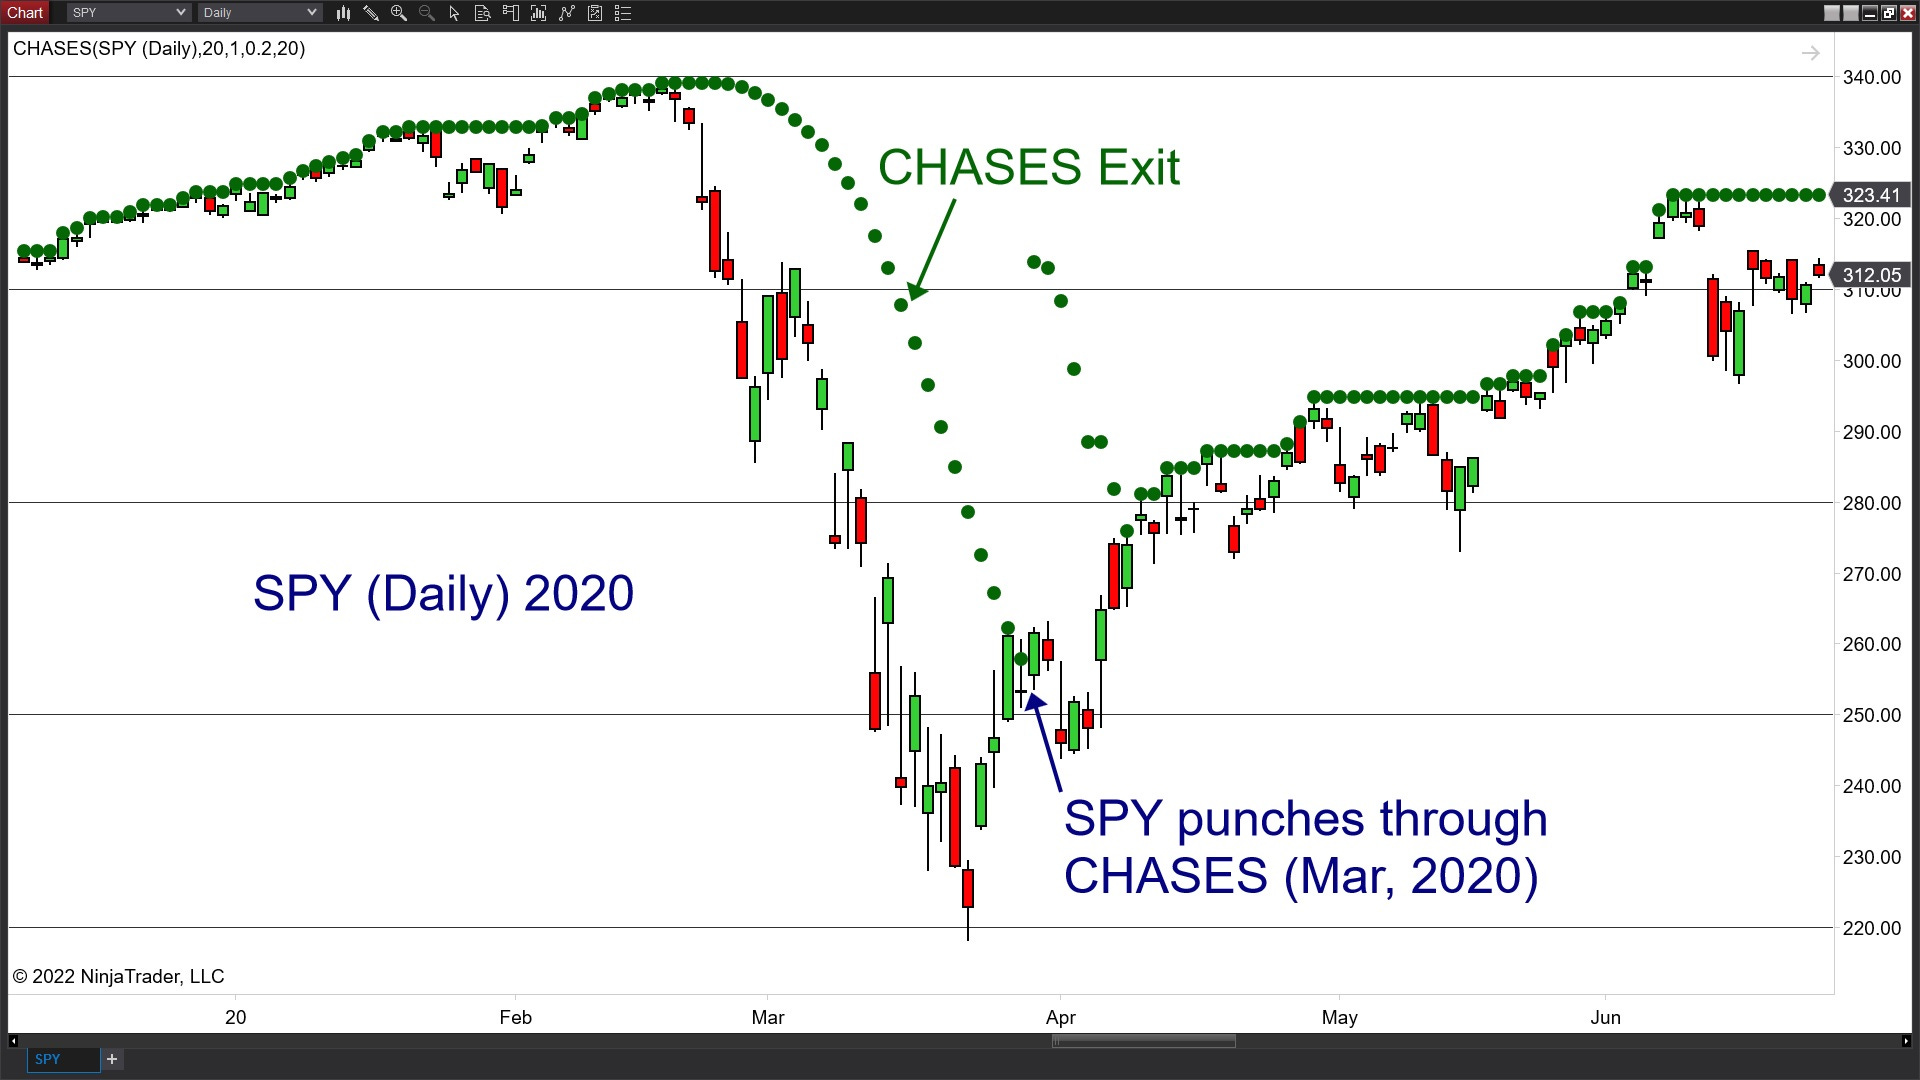
Look at the two charts below. The first shows the CHASES accelerating exit that the market punched through in March 2020. Observe the slight pullback after touching the trailing stop before the market could move higher.
Next, look at the SPY current daily chart below. The market first came off the bottom to hit the trailing stop, and second, it pushed decisively through resistance at 405 (or 4050 in SPX).
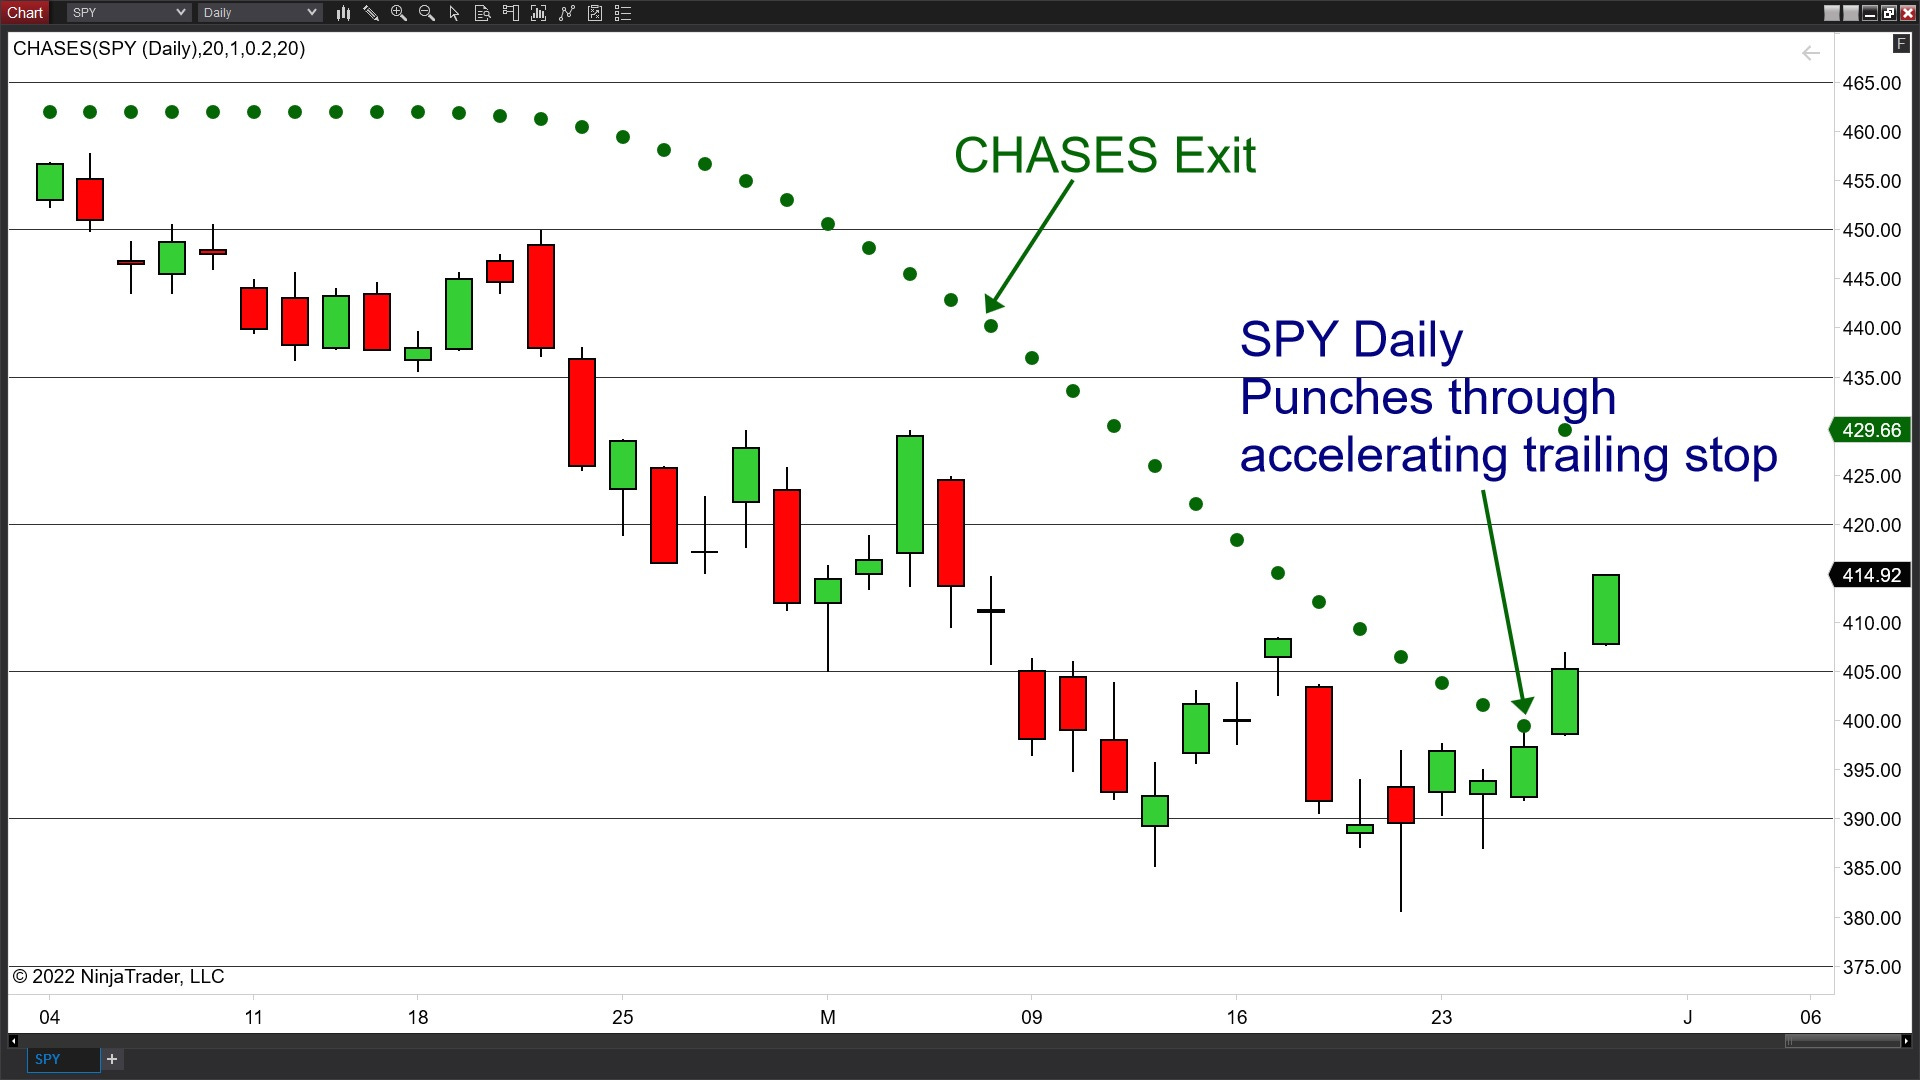
These two charts taken together show that the market has pushed through significant overhead resistance in short order, and we should treat this breakout as one with the potential to move higher. We next mark resistance at 4300 on the $SPX or 430 on the SPY, just above the May highs, which would be a 61.8% retracement of the downtrend that began in April and a logical place for traders to gather their thoughts.

The rally will meet resistance layered around the SPX round numbers (in steps of 100) to 4600. However, another reason to expect that the market could get up to 4300 is that we also have an entry on our counter-trend swing system, which buys strength after weakness.
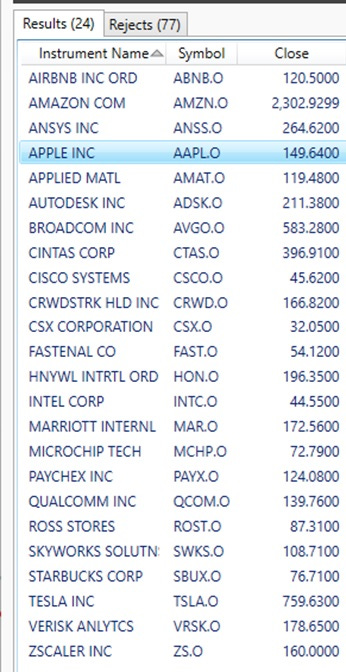
Since the QQQ and its constituents have seen heavy selling, I used MetaStock to scan for swing system entries and found that 24 of them are currently long, as shown below.
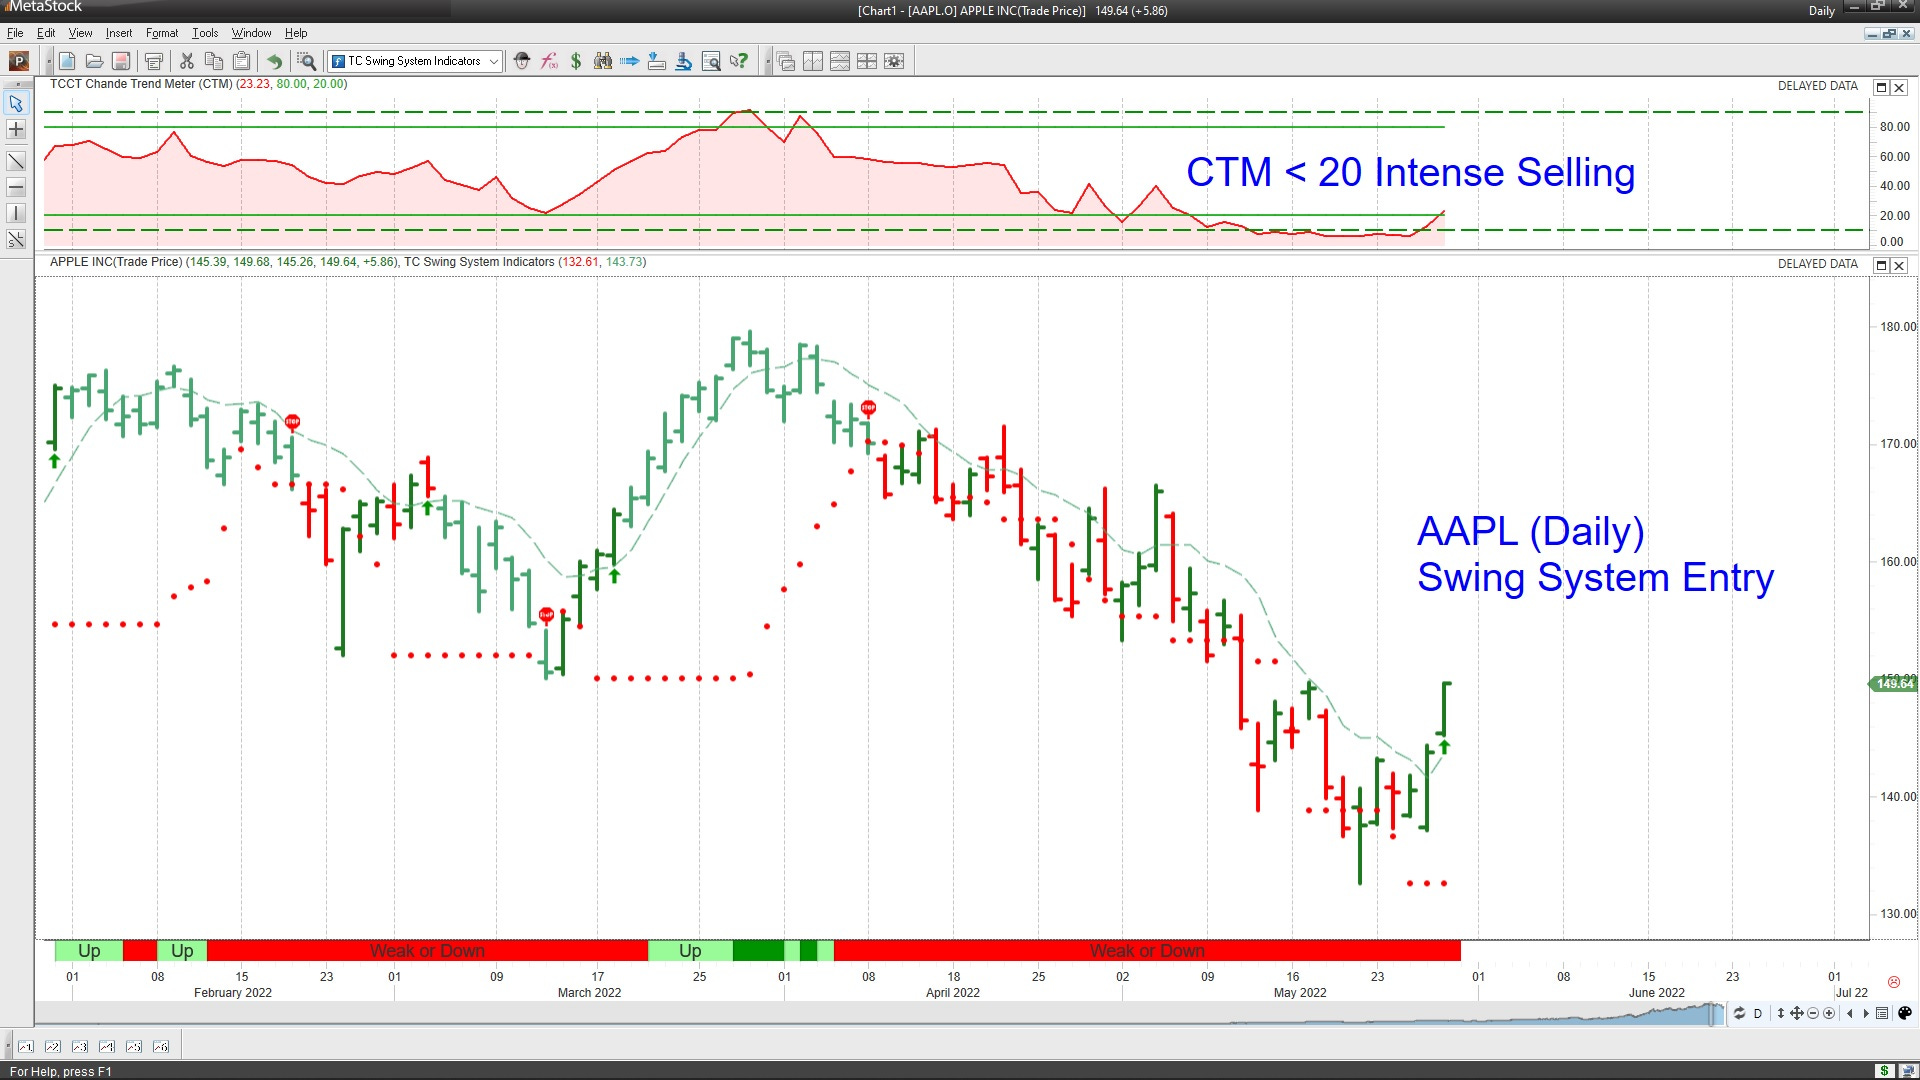
The chart above highlights Apple, which has seen heavy selling for the past few weeks. The swing system entered long earlier on hourly or four-hour charts, but the entry on the daily chart occurred on Friday. Please note the heavy selling, which caused the Chande Trend Meter to stay below 20 and drop below ten during May (see the upper panel in the chart below).
Wrap-up
My posts should give you a good starting point, with context and suggestions if you like to research. Then, you can visit my website, chandeindicators.com, for more information and ideas. I hope you stay tuned and help by subscribing and recommending it to your friends and colleagues.
Thank you for spending some time with me.
Disclaimer
And now for some housekeeping. This publication is for “edutainment,” education, and entertainment, not for investment advice. Past performance is not necessarily indicative of future results. Our disclaimer at chandeindicators.com is included herein by reference.