


Rally Confirms Market Low
The market confirms a double bottom.

Overview
The calm tone and clear guidance from FOMC Chair Powell helped the markets rally.
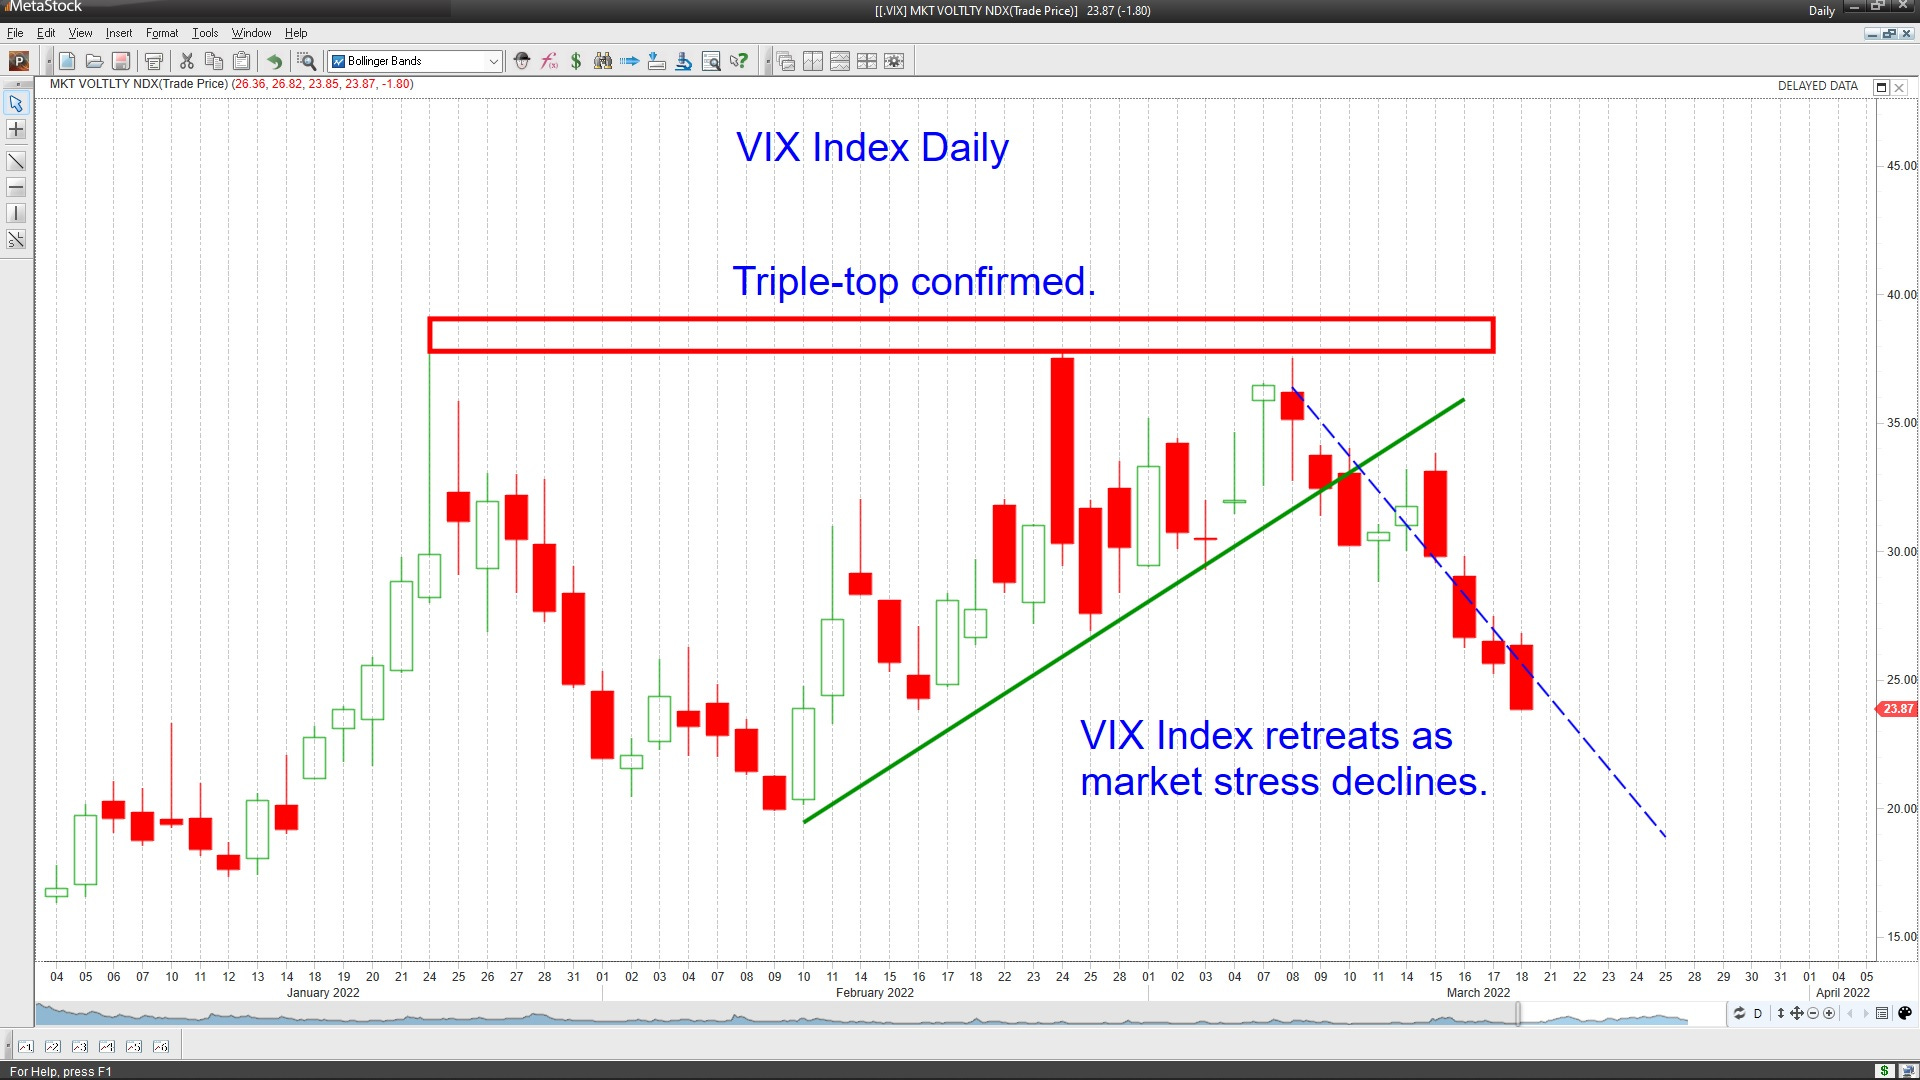
The VIX index declined (~-22%), while Gold and Wheat retreated (~-3.2%). Interest rates rose. The VIX futures term structure returned to the normal pattern, confirming a reduction in market stress.

The VIX index made a triple top and retreated, much to the market’s relief. (Chart courtesy MetaStock.) Maj. Gen. Mick Ryan (Retd.) has just concluded: “the Russian invasion of Ukraine has culminated.” The Russian Army’s Ukraine invasion may have stalled, but their grim bombardment of civilians continued. So the sooner the conflict ends, the better.
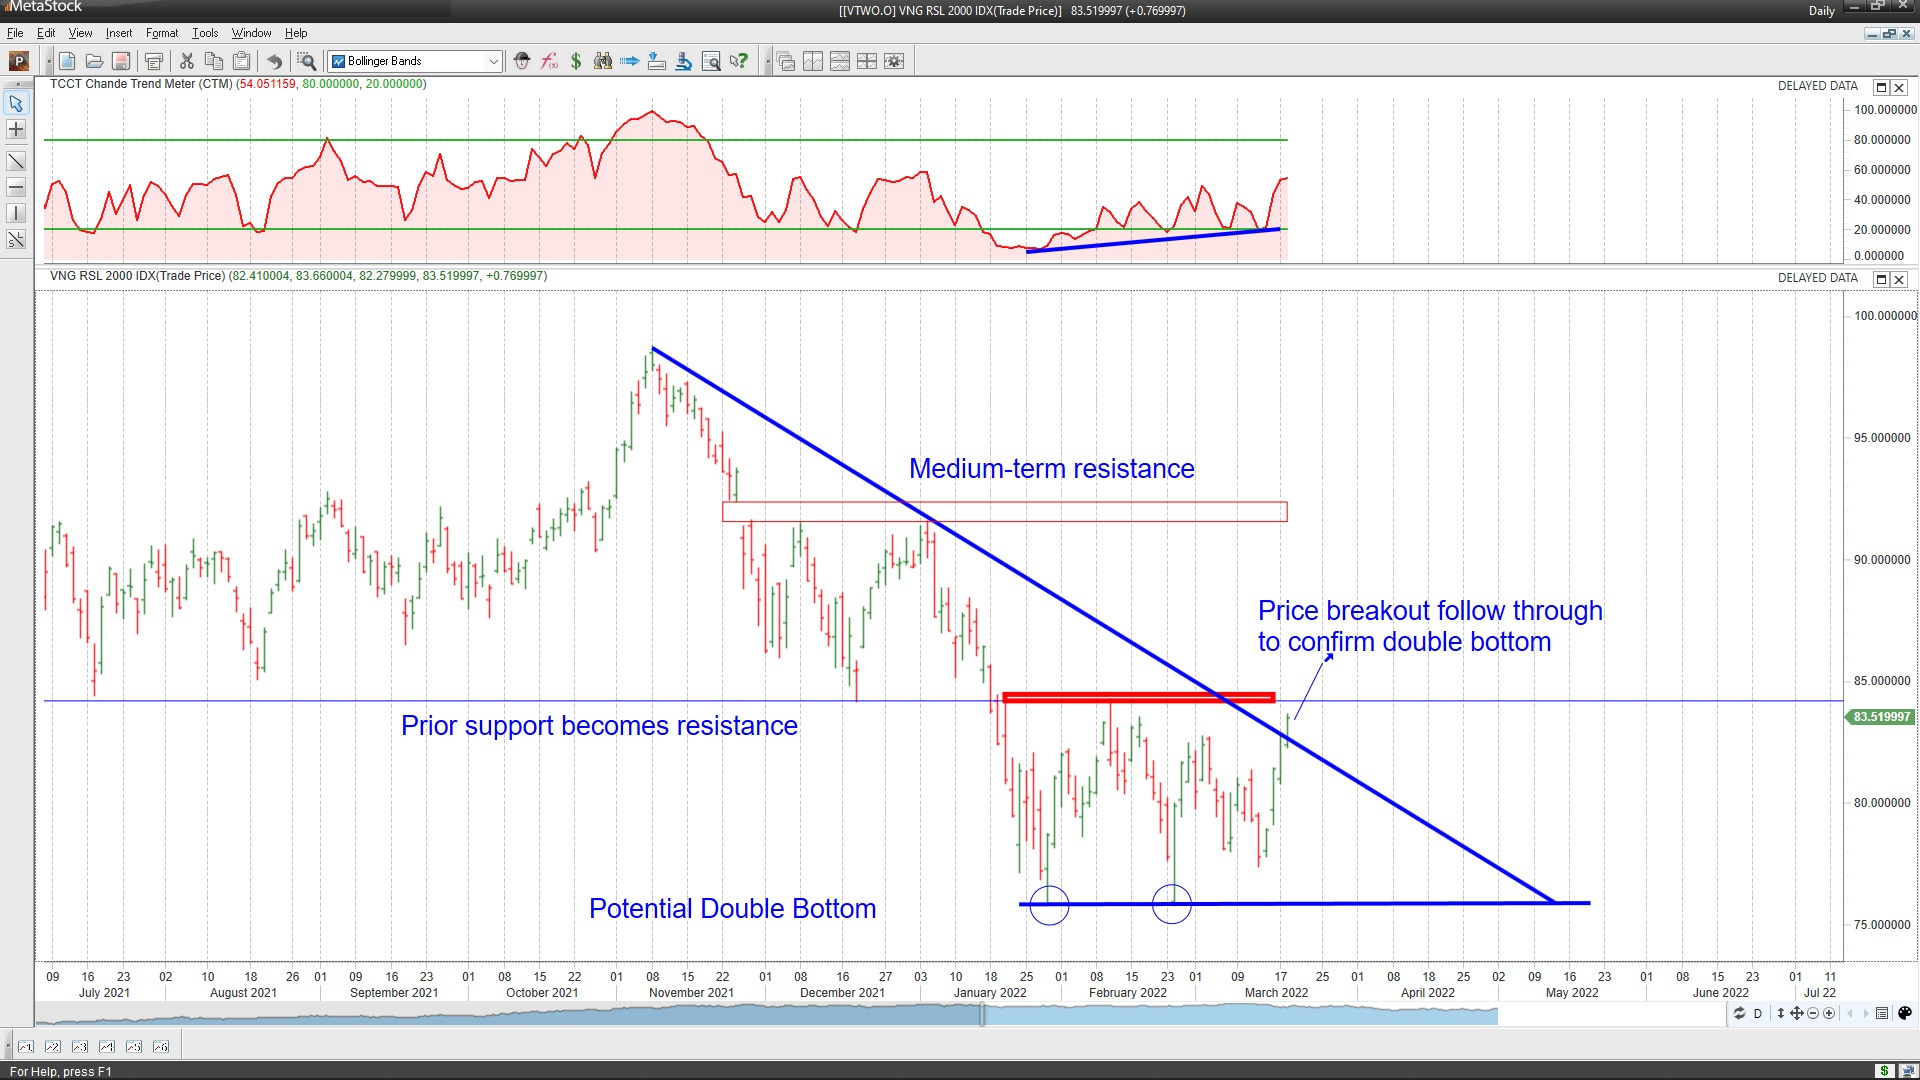
The double-bottom we have discussed for several weeks was confirmed as VTWO moved above its downtrend line since January. However, there is plenty of overhead resistance ahead. For example, VTWO needs to move convincingly above 84.

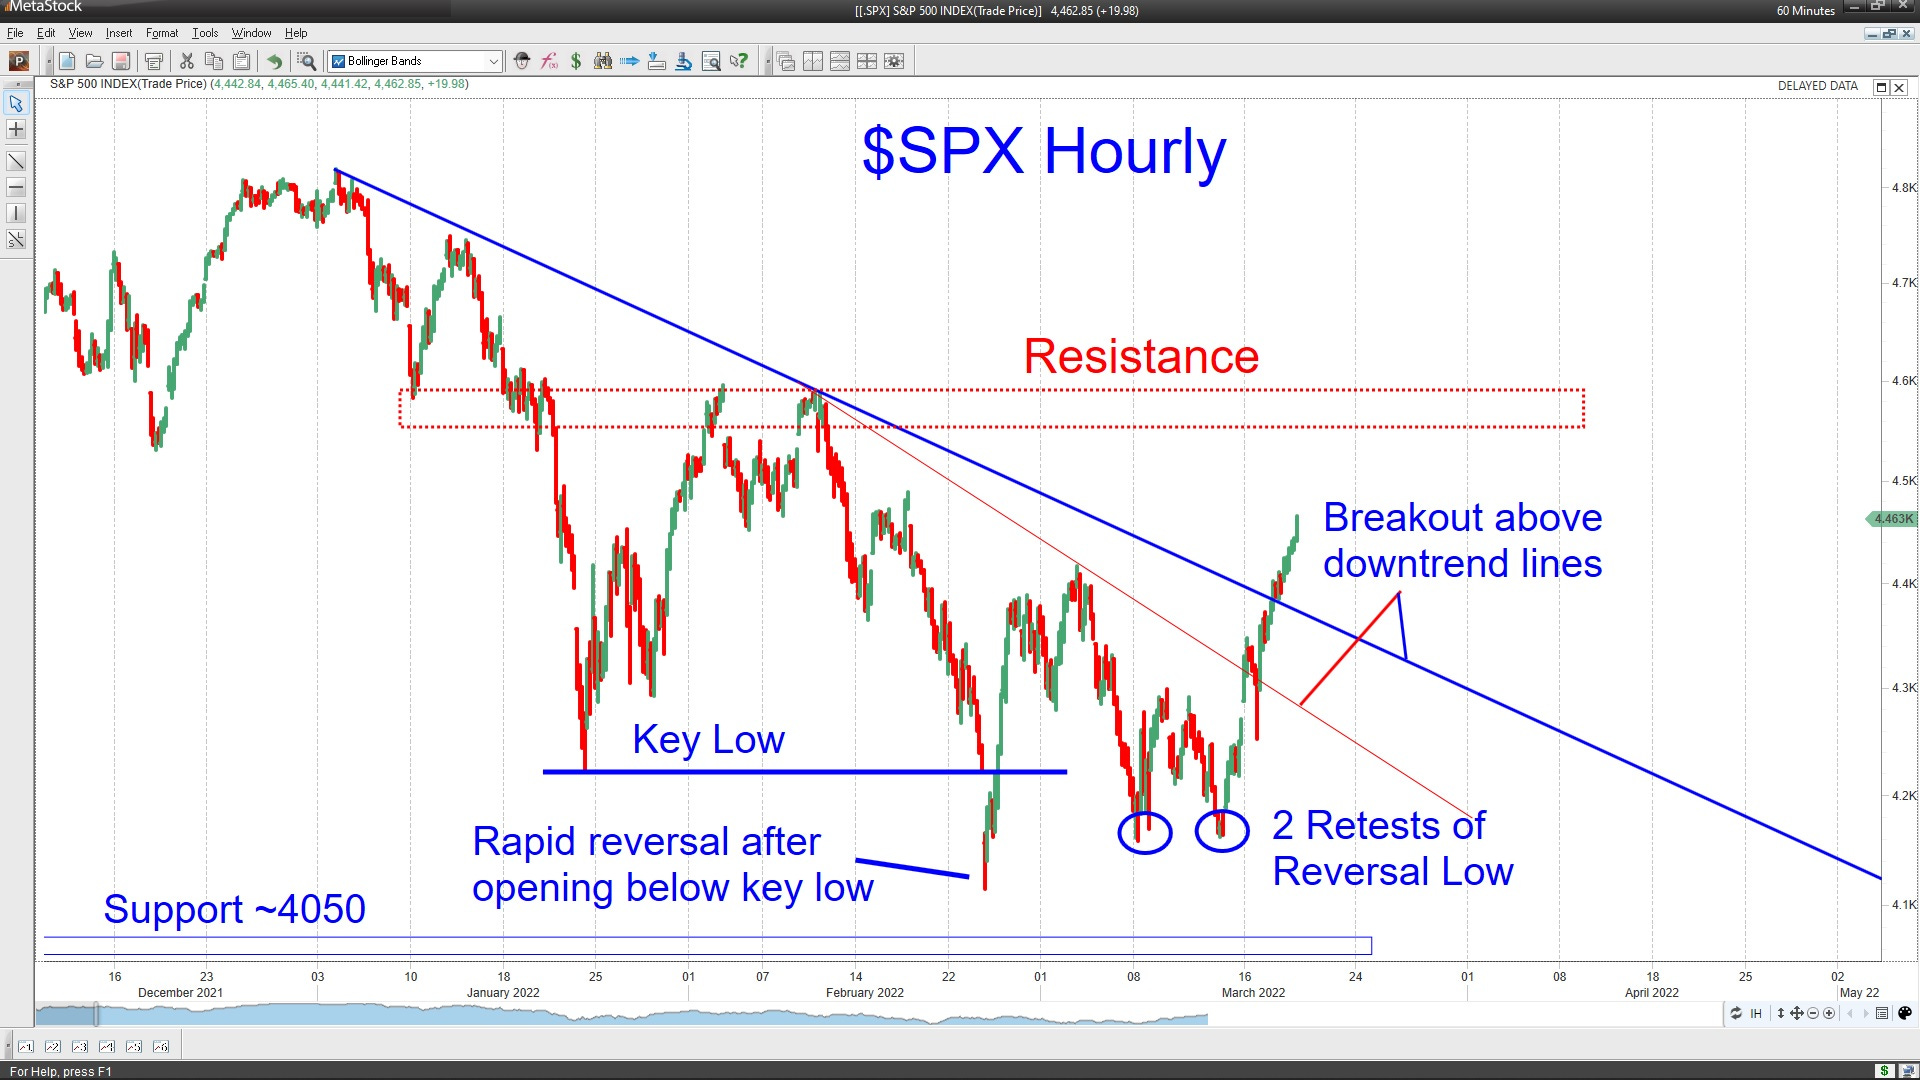
We used this VTWO ETF Chart as our model to identify that the market has bottomed for the past few weeks. (Chart courtesy MetaStock.) The S&P-500 index followed much the same pattern.
Performance Summary
There was a broad rally in the market, led by technology stocks. The importance of the rally in large-cap stocks becomes clear when we see that the SPY outperformed its equal-weight RSP cousin. For context, the Ark Innovation ETF, the long-suffering tech ETF darling, rallied 18.3% this week.

The sensitive net bull/bear balance rose to its highest levels in three months, suggesting that the rally could continue.

The value-growth pendulum swung towards growth this week, usually an indication of risk-on positioning, implying that the trend could continue. Observe how the growth ETFs across all capitalizations are to the right (outperforming) those based on value.

Commodities had retreated last week, but the metals had not. This week, physical Gold retreated, which confirms the bullish bias in the market. The chart below shows that SGOL, a gold bullion ETF, fell below its trailing stop via a swing system approach, signaling an end to the uptrend during the market’s weakness.
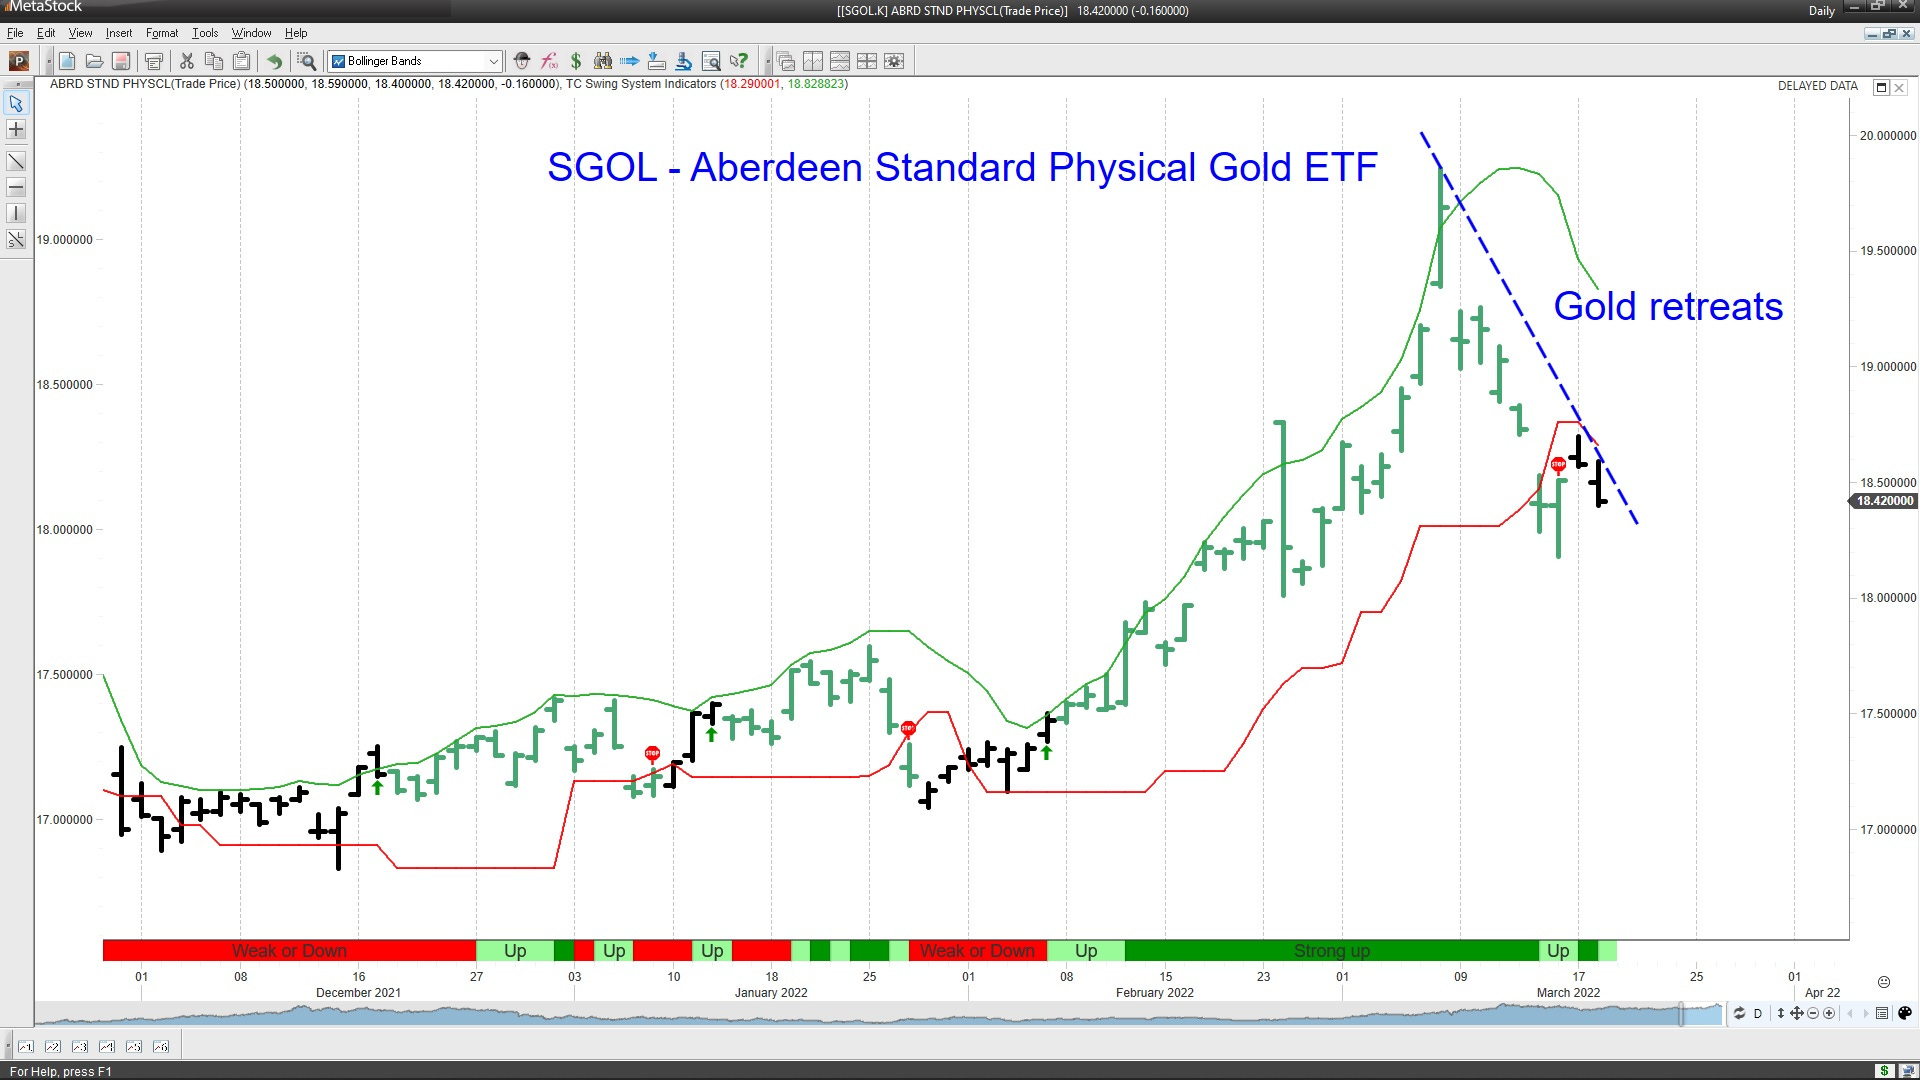
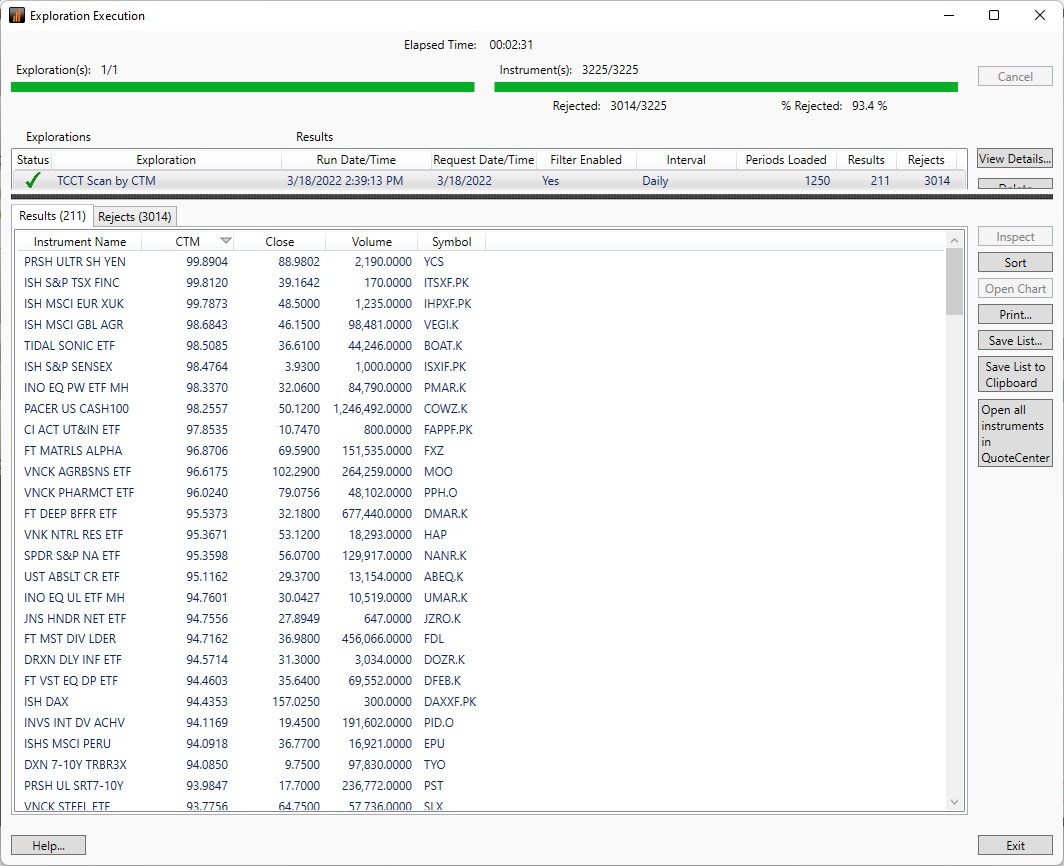
A scan ranking the major US ETFs using the Chande Trend Meter (via the MetaStock Explorer) shows no Gold ETFs near the top. So instead, you should check out such interestingly named ETFs as COWZ and MOO.
Navigating Today’s Volatile Markets using CTM
I have several charts and scans to show that you can trade these volatile markets using the Chande Trend Meter in this Metastock presentation. So it’s worth looking if you think this may be a good time to add to your portfolios.
Wrap-up
My posts should give you a good starting point, with context and suggestions if you like to research. Then, you can visit my website, chandeindicators.com, for more information and ideas. I hope you stay tuned and help by subscribing and recommending it to your friends and colleagues.
Thank you for spending some time with me.
Disclaimer
And now for some housekeeping. This publication is for “edutainment,” education, information, and entertainment purposes only. It is not to be construed as investment advice. Past performance is not necessarily indicative of future results. Our disclaimer at chandeindicators.com is included herein by reference.