

Protecting Portfolios During Confluenza
Protecting Portfolios During Confluenza
The confluence of Delta, Influenza and Omicron could sicken your portfolio.

Overview
The Omicron variant seems more powerful than Delta, and the unvaccinated will be at even greater risk. We are likely to see a period of Confluenza: when influenza, Delta, and Omicron will all be rampant in the population, overwhelming hospitals. It’s not clear that the market has fully factored in these effects. In any case, new vaccines will take 3-8 months before they are widely available to the public.
There was more selling this week as predicted last week, with the S&P-500 closing below its 50-day simple moving average. As a result, market volatility jumped quickly, with the $VIX index rising to nearly 33. In the past, this has led to at least a temporary bounce in the markets.
Only 210,000 new jobs were created in November, well below expectations. However, we must await future revisions to confirm that job creation is truly weakening.
Testifying before Congress, Fed Chair Powell suggested the Fed would focus more on fighting inflation by ending bond purchases sooner. This has negative implications for stock PE multiples, particularly if the Omicron variant starts rampaging through the country.
Interest rates fell and remain trapped in the range we charted last week.
Congress passed a bill to fund the government and can now focus on other pressing items such as the debt limit.
Key Question:
This winter will see a confluence of the Delta variant, regular influenza, and Omicron. Add to this a Fed more focused on inflation than providing liquidity. So what does the recent decline tell us about how to protect our portfolios during further declines?
Performance Summary
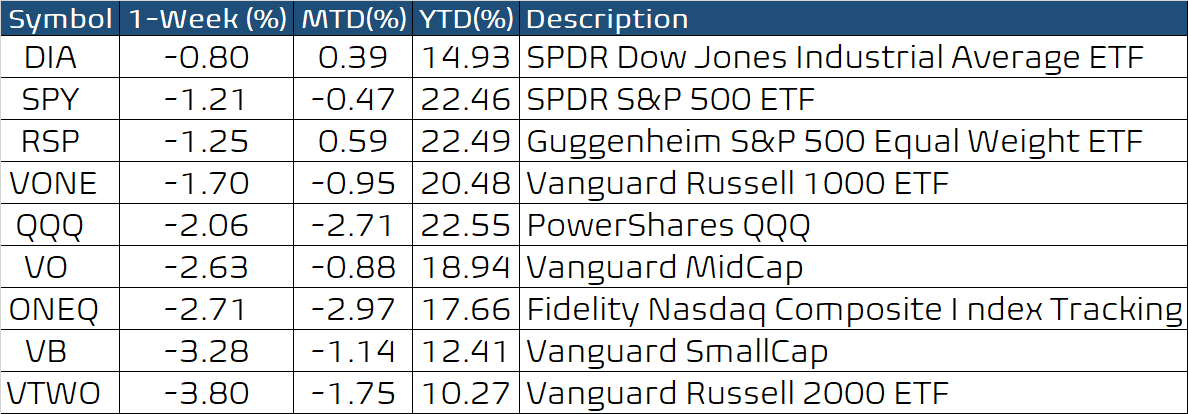
The selling has been intense since last Friday. This week only the Dow stocks held up relatively well, as did the Semiconductors, mega-cap techs, and home builders. However, as a continuation of last week’s pattern, small-cap stocks were hit hard again (see VB and VTWO below).
Our sensitive net bull/bear balance remained fragile, with a reading below -60. This figure gives a snapshot view of how the major market indexes are trading.

The selling has been quite intense. Over a 12-day horizon, about 86% of the stocks in the S&P-500 index were trending lower as of Thursday, Dec 02. However, the fraction trending lower is still below the values last seen in Feb-Mar 2020.
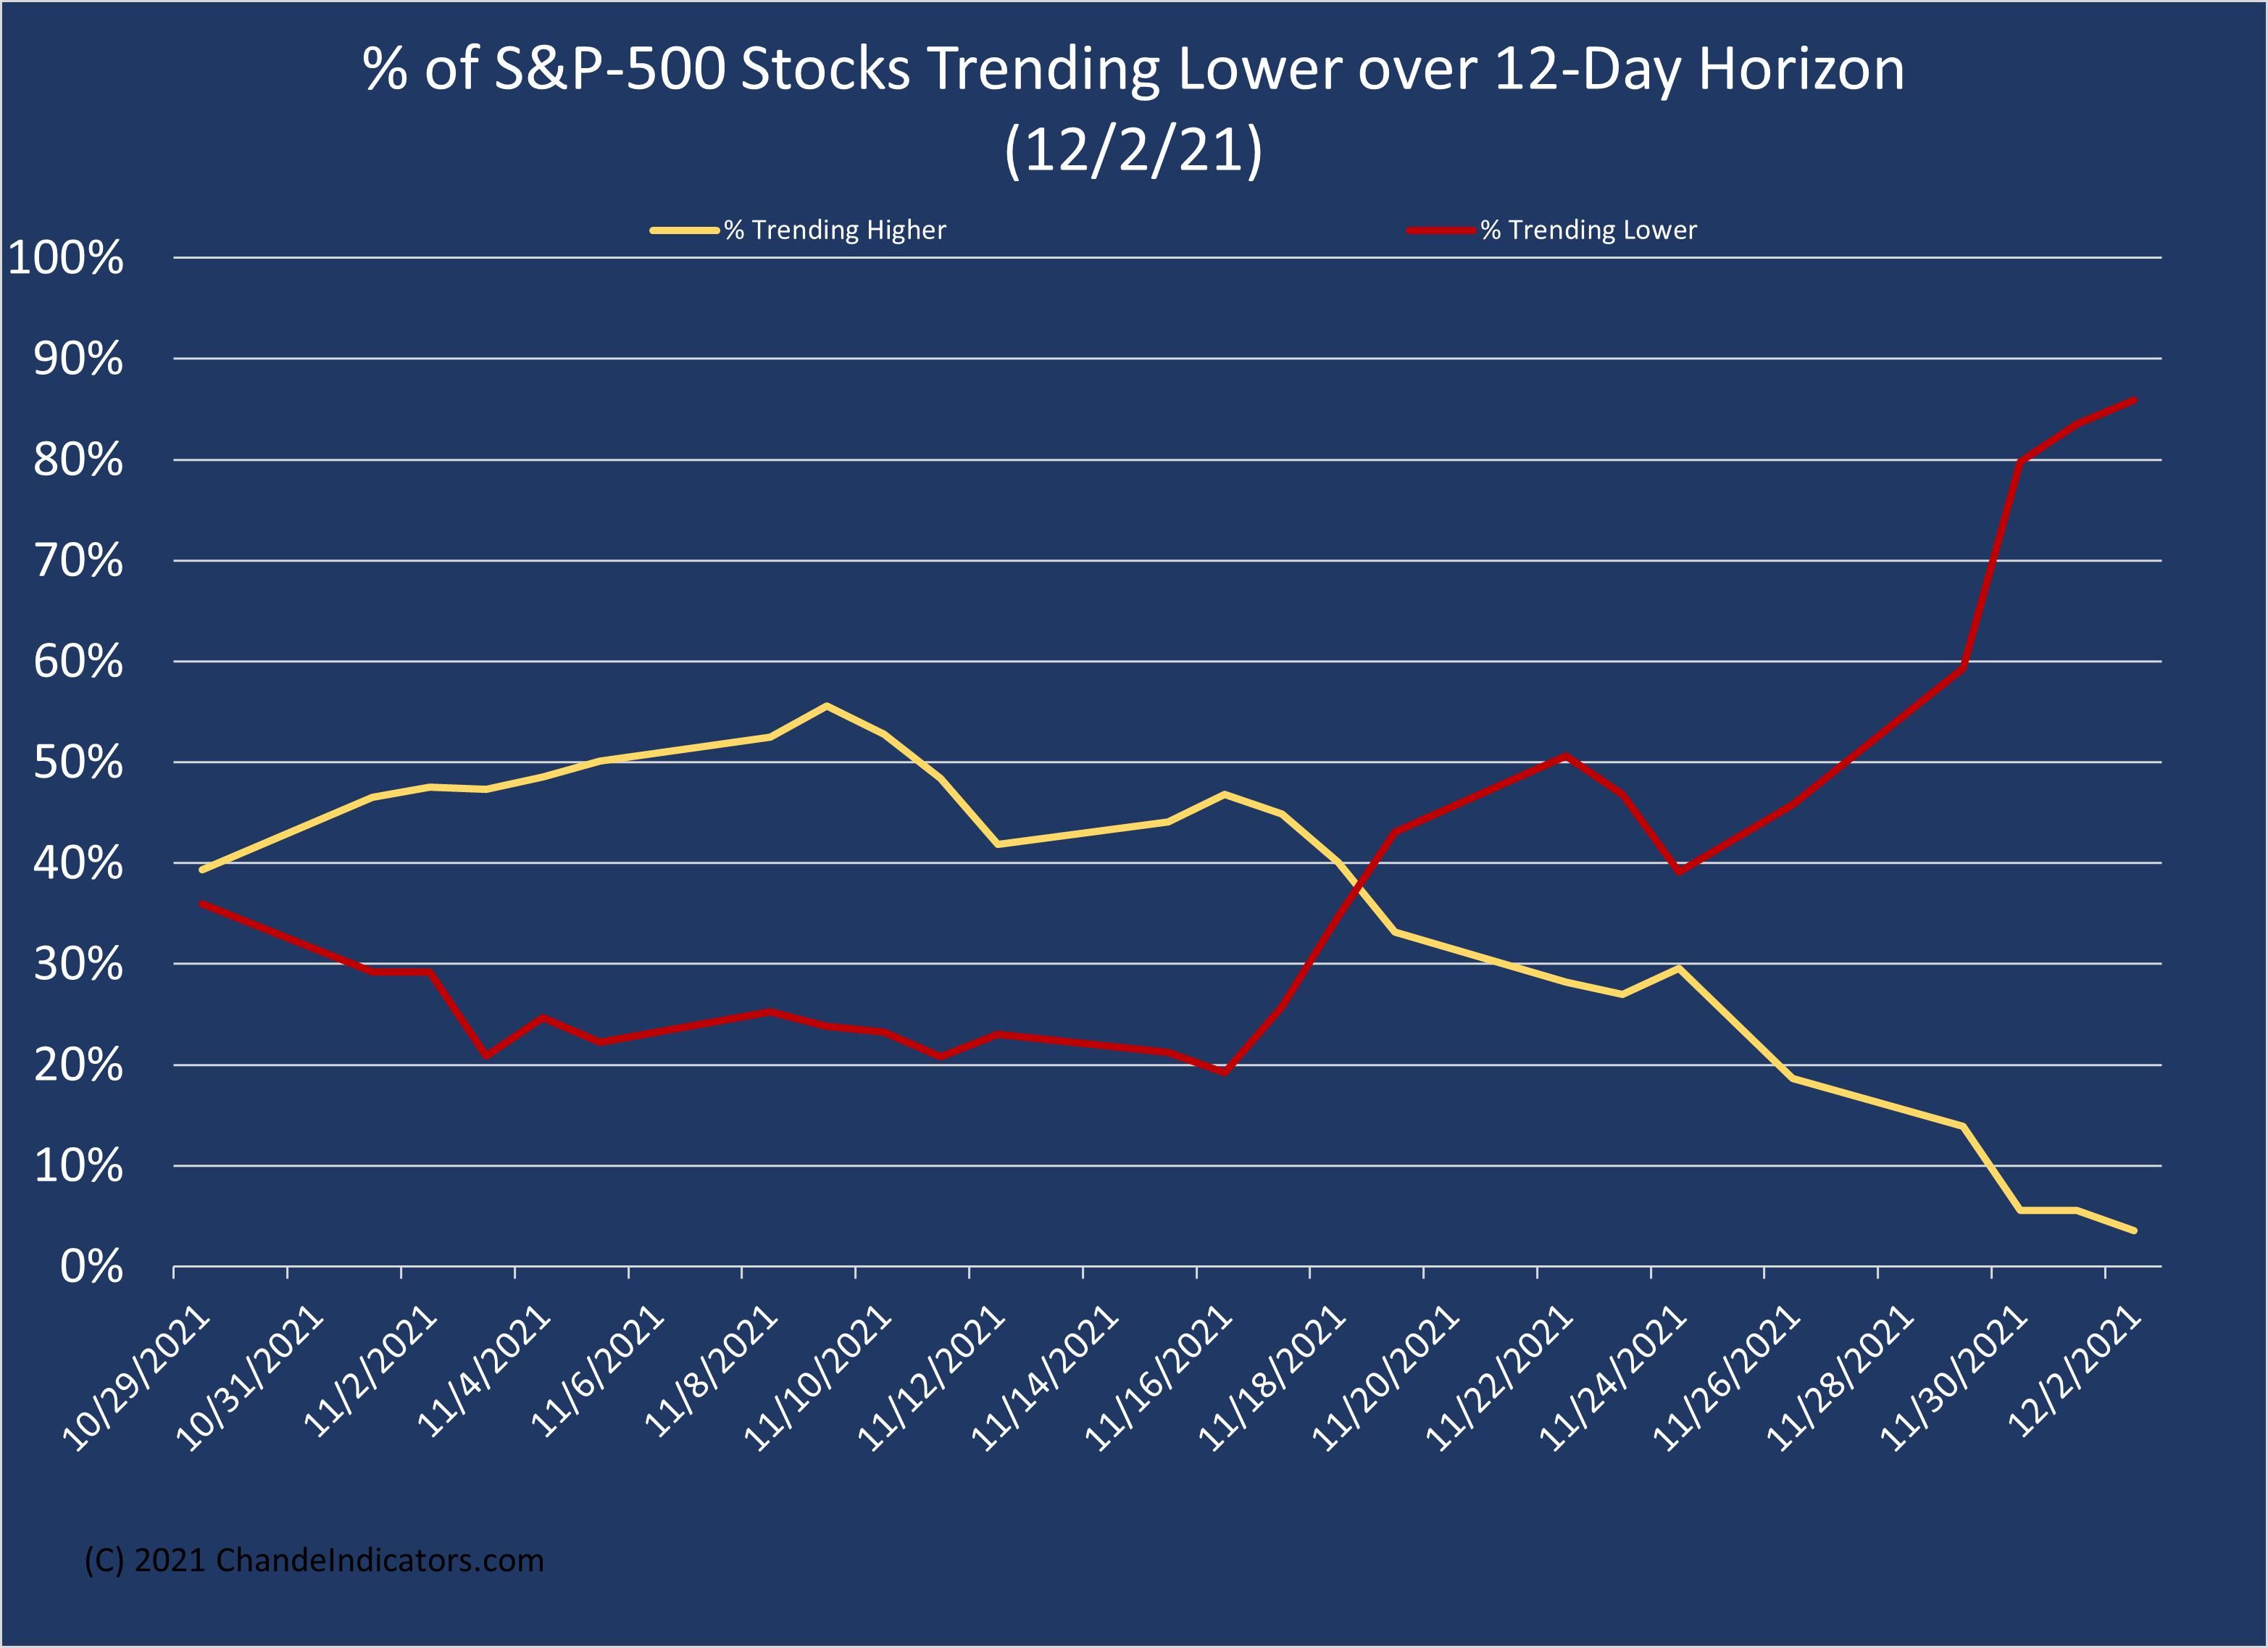

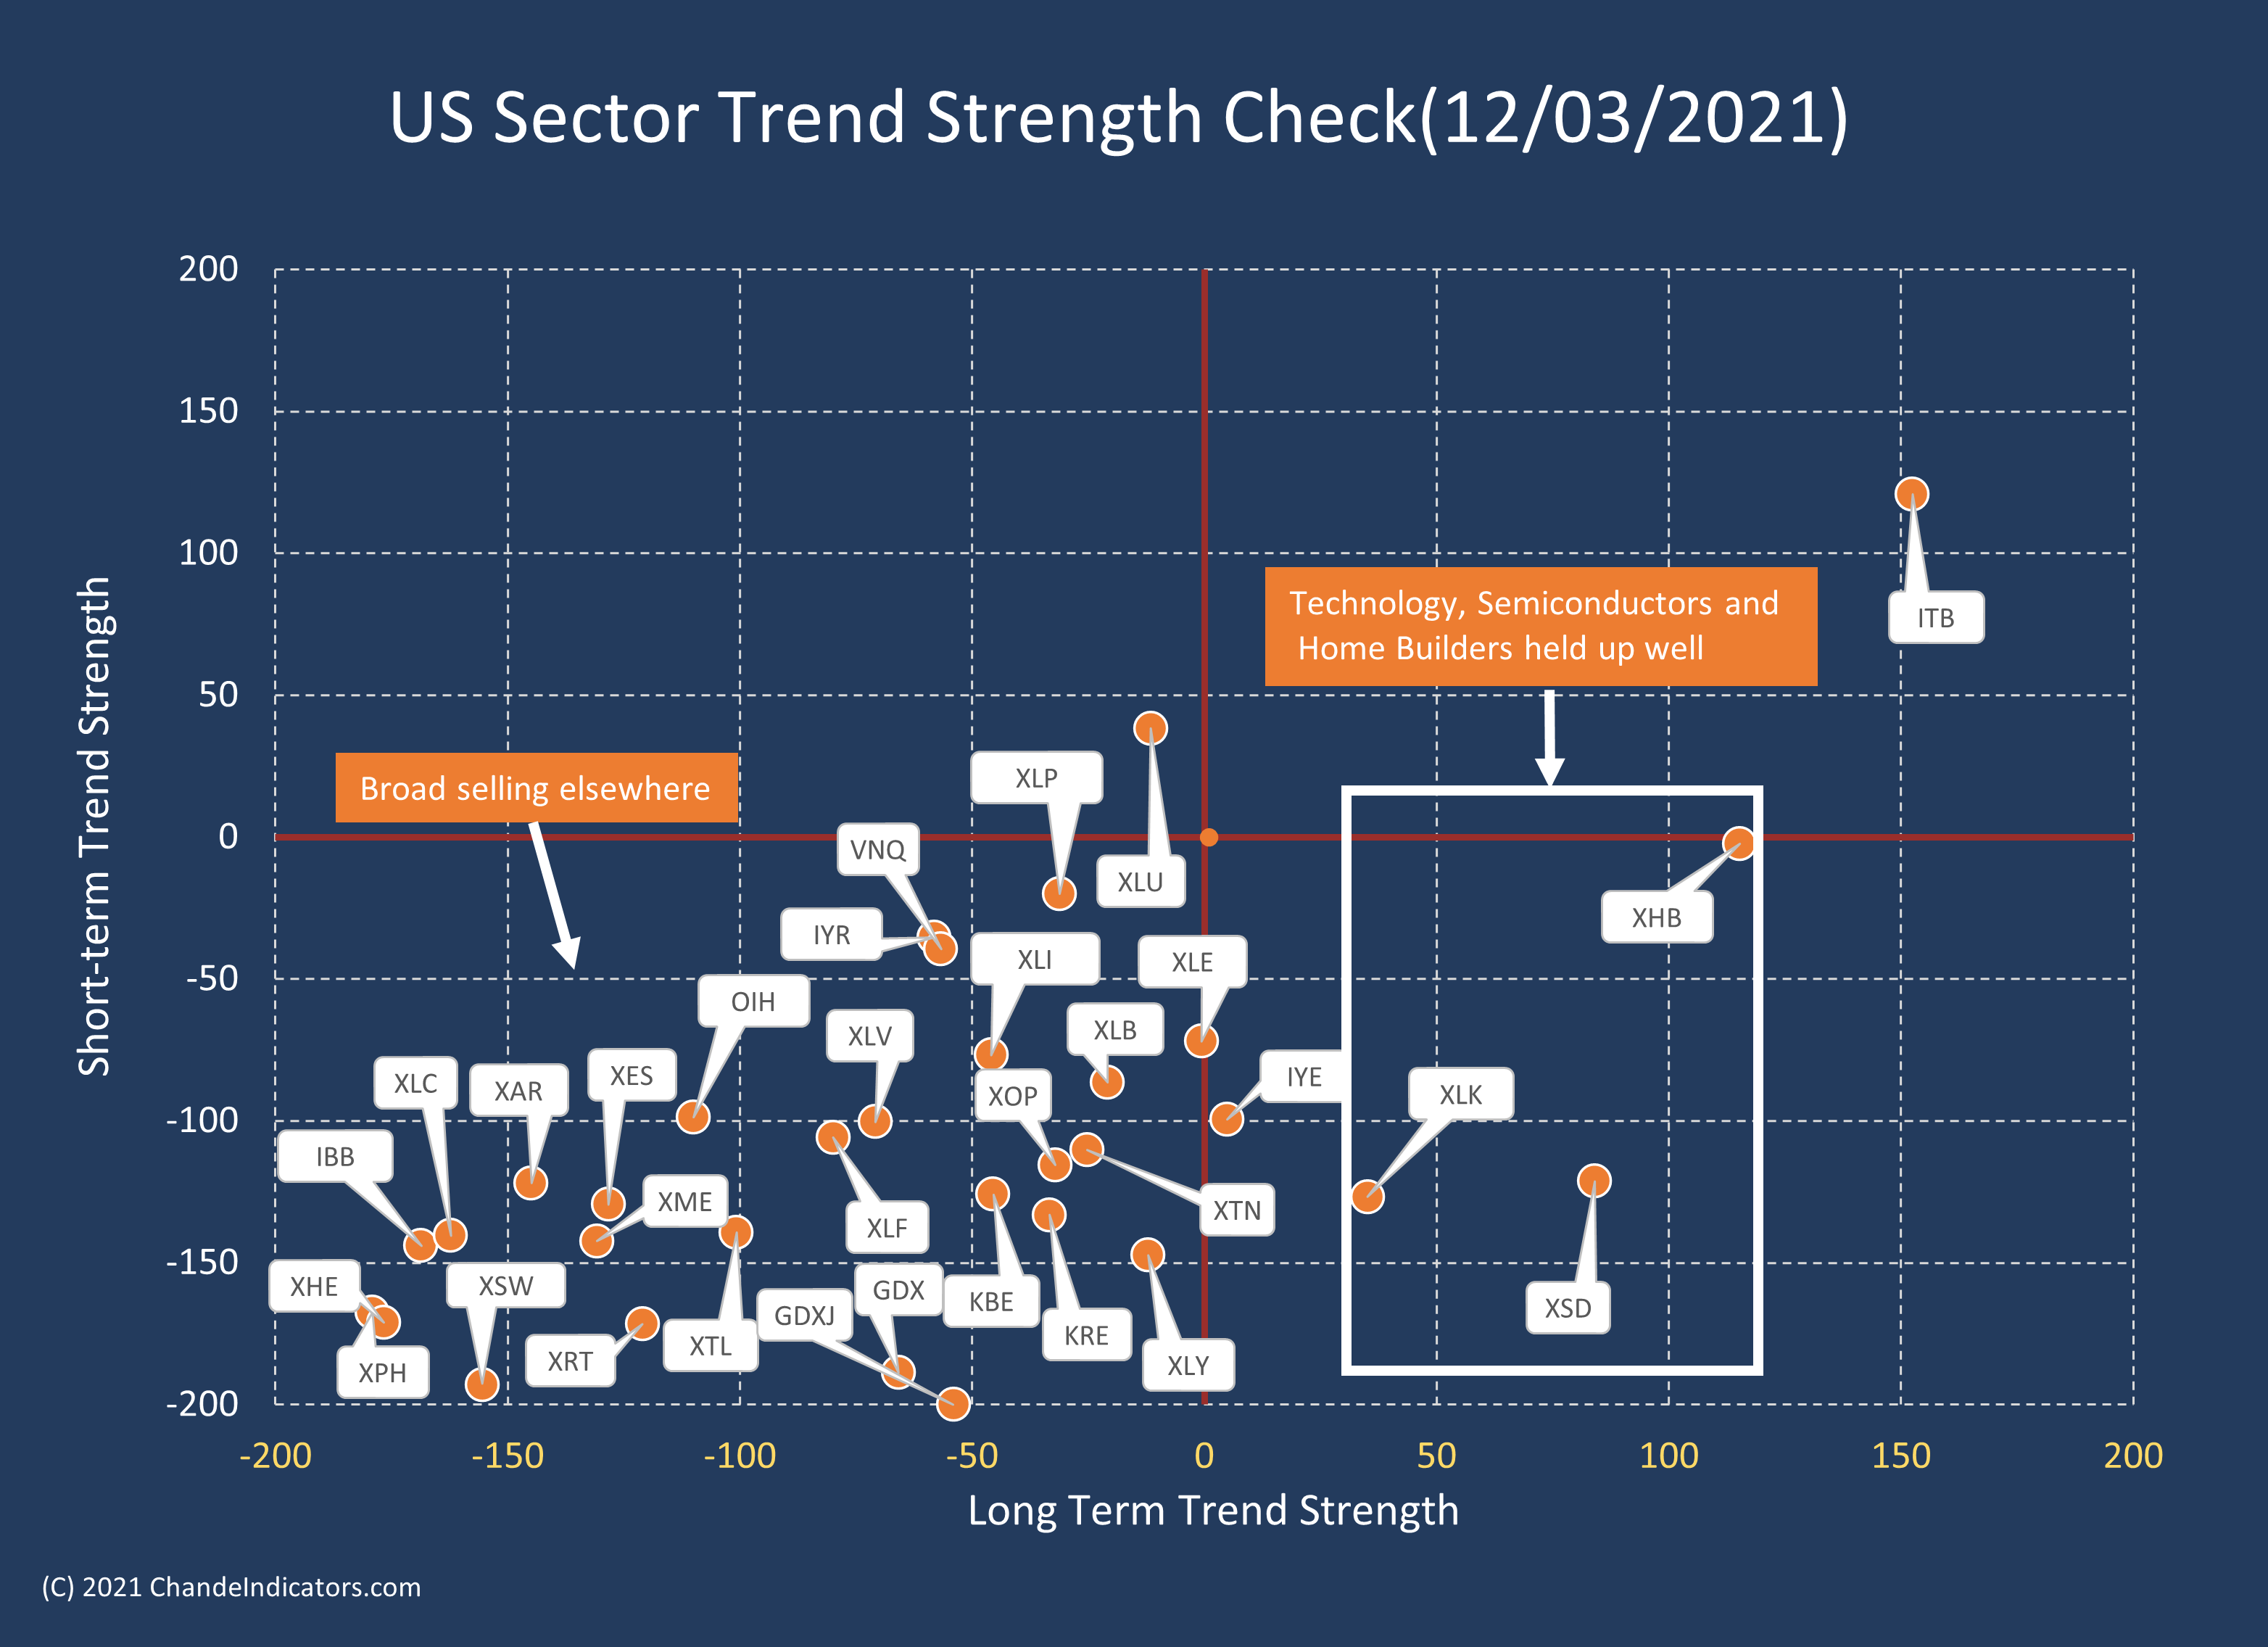
The trend spectrum in the chart above shows heavy selling at the left edge of the chart. At the sector level (see below), the mayhem becomes clear. Virtually all major sectors are in the lower left quadrant below, illustrating the impact of severe selling.
The VIX index, which “measures” the selling intensity, has risen above a downtrend line and broken through several layers of resistance, notably at 25 and 29. The heavy resistance in the 37 to 41 area is within reach. This chart shows that the volatility has expanded rapidly after the announcement of the omicron variant.

For perspective, I returned to the SPY chart in February-March 2020 to remind ourselves of how the charts looked then. Again, the SPY fell below the self-adjusting CHUF bands, and the short-term oscillators in the lower panel were below -50 (or close to -100) during the decline.
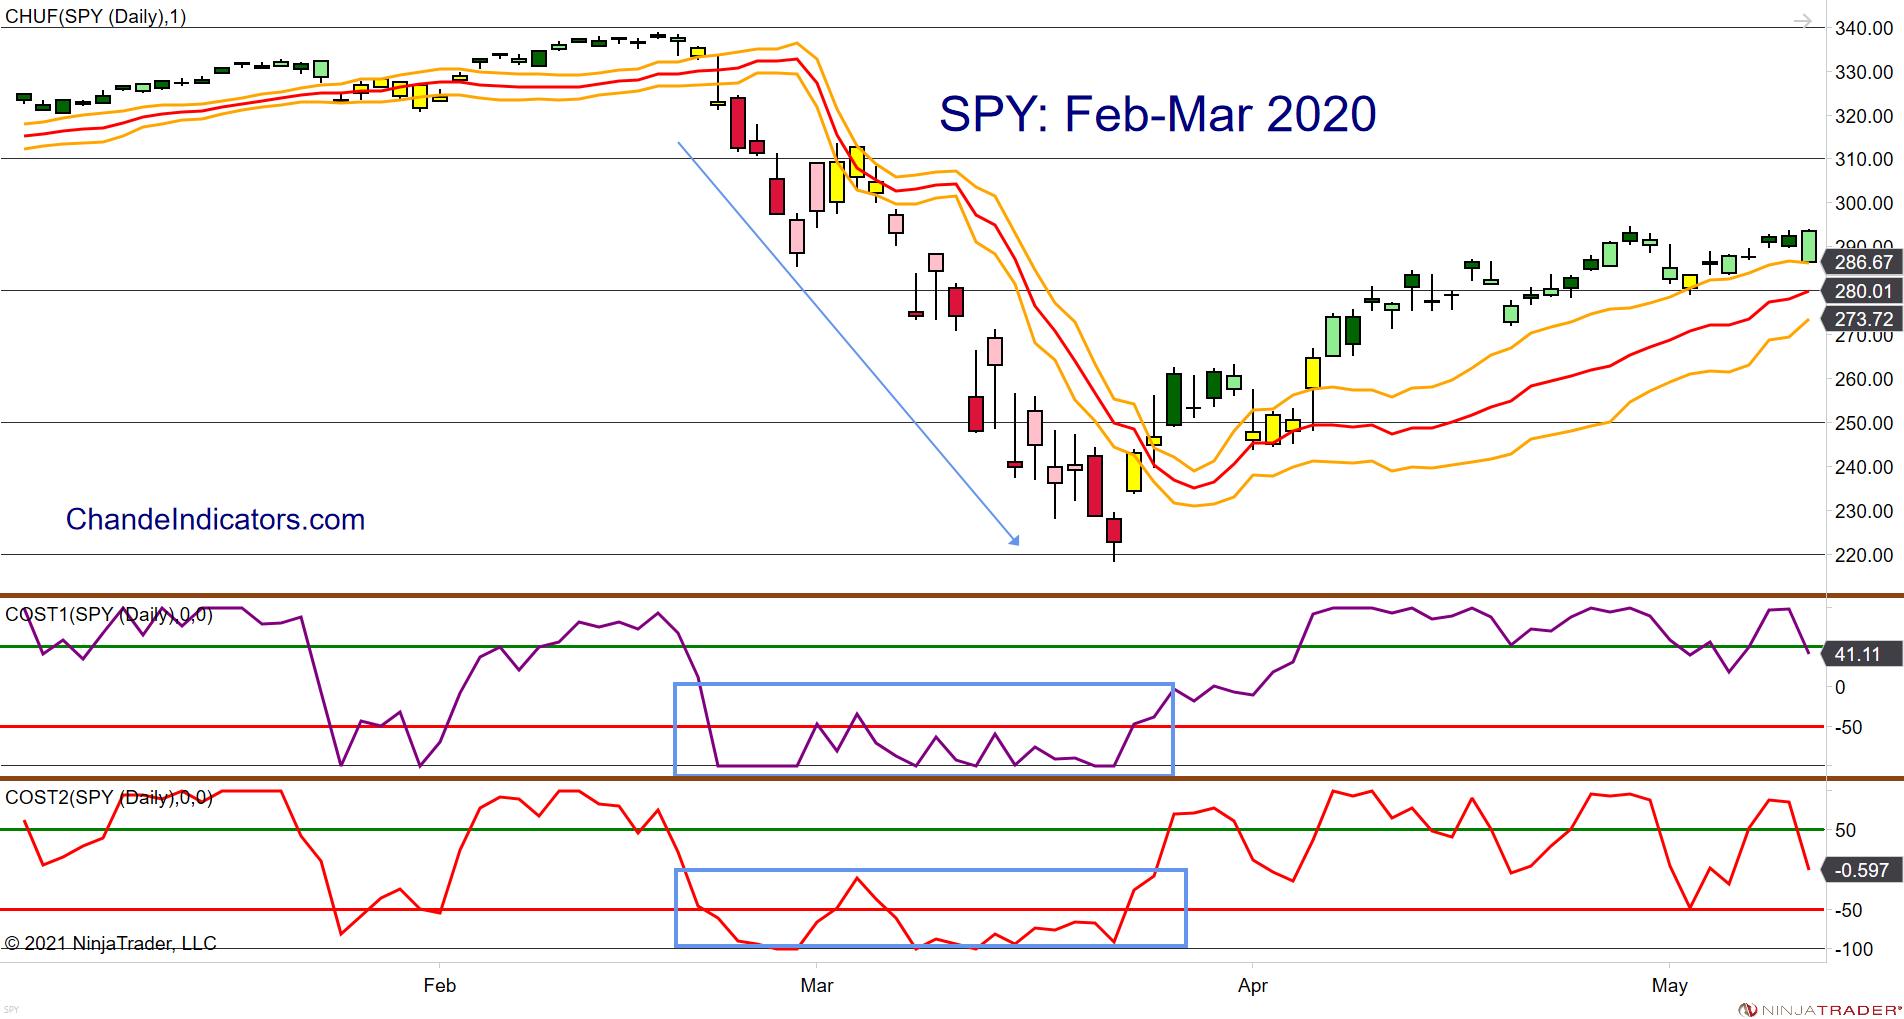
The current SPY chart is similar to the Feb-Mar configuration. Once again, prices are well below CHUF bands, and both short-term oscillators are below -50. If you look to the left of the chart, the configuration was quite similar during that decline.

Traders supported the SPY near the 50% Fibonacci retracement and the 50-day moving average. However, this respite may be temporary since much about the Omicron variant remains unknown.

Protecting Portfolios
The European CDC said on Dec 02 that Omicron was much more powerful than Delta. However, their scientific language puts it in a more balanced way:
“There are a number of uncertainties around Omicron in terms of transmissibility, severity, and immune escape potential, though preliminary data suggests a substantial advantage over the Delta variant. Based on mathematical modelling conducted by ECDC, there are indications that Omicron could cause over half of all SARS-CoV-2 infections in the EU/EEA within the next few months. The greater Omicron's growth advantage over Delta and the greater its circulation in the EU/EEA, the shorter the expected time until Omicron causes most of all SARS-CoV-2 infections.”
We already have a community spread in New York City. Still, as Dr. Ashish Jha (@ashishkjha) of Brown University points out, this is not March 2020 because we have much better detection, testing, tracking, and therapies, in addition to a vaccinated populace. Besides, the economy remains strong, and a worldwide shutdown is unlikely because we now know how to cope with the virus. In other words, this too shall pass, but not before we go through a zone of Confluenza: an overlap of the Delta variant, regular influenza, and the emerging Omicron variant.
We begin by reviewing the performance of bonds, utilities, gold, and bitcoin versus the S&P-500 index during the recent decline, from the Nov 22 high to the Dec 02 low. As we see below, when the S&P-500 declined a bit over -5%, only bonds (+0.78%) and the leveraged inverse small-cap ETF (+33.3%) offered positive returns. The other usual “stores of value” such as gold and bitcoin did not help. (In fact, both gold and bitcoin peaked several days before the S&P-500.) In addition, even though utilities are viewed as a bond proxy, the Vanguard utility ETF (VPU) failed to protect the portfolio. Finally, the huge declines in small-cap stocks (see TNA) led to offsetting gains in their inverse counterpart (TZA), and hence only short positions offer significant benefit during steep declines.
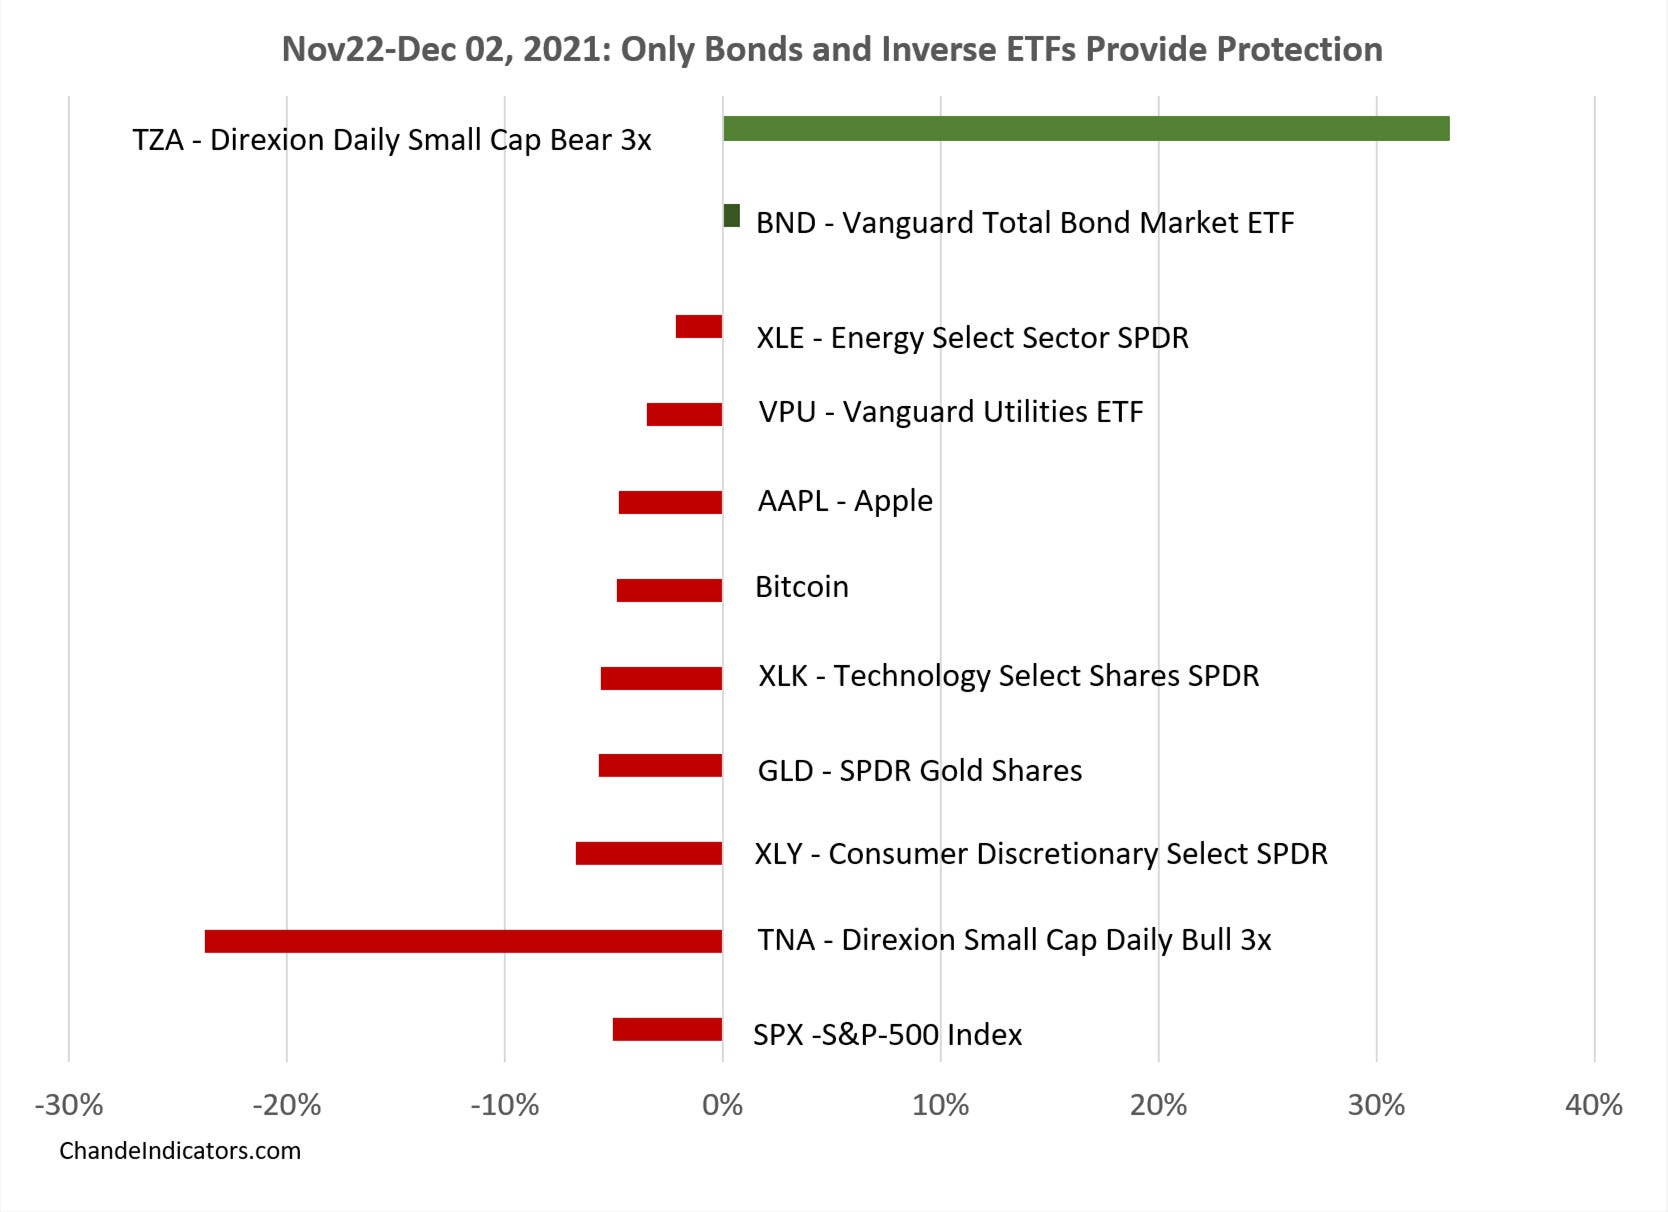
The message from the chart is clear. Portfolio protection comes from cash, long bonds, or a short position in the index during declines. I want to clarify that leveraged and inverse ETFs are not the right choice for everyone because of their volatility and relatively low volumes. Of course, the other option is to ignore all the gyrations and do nothing at all, which makes perfect sense for long-term investors.
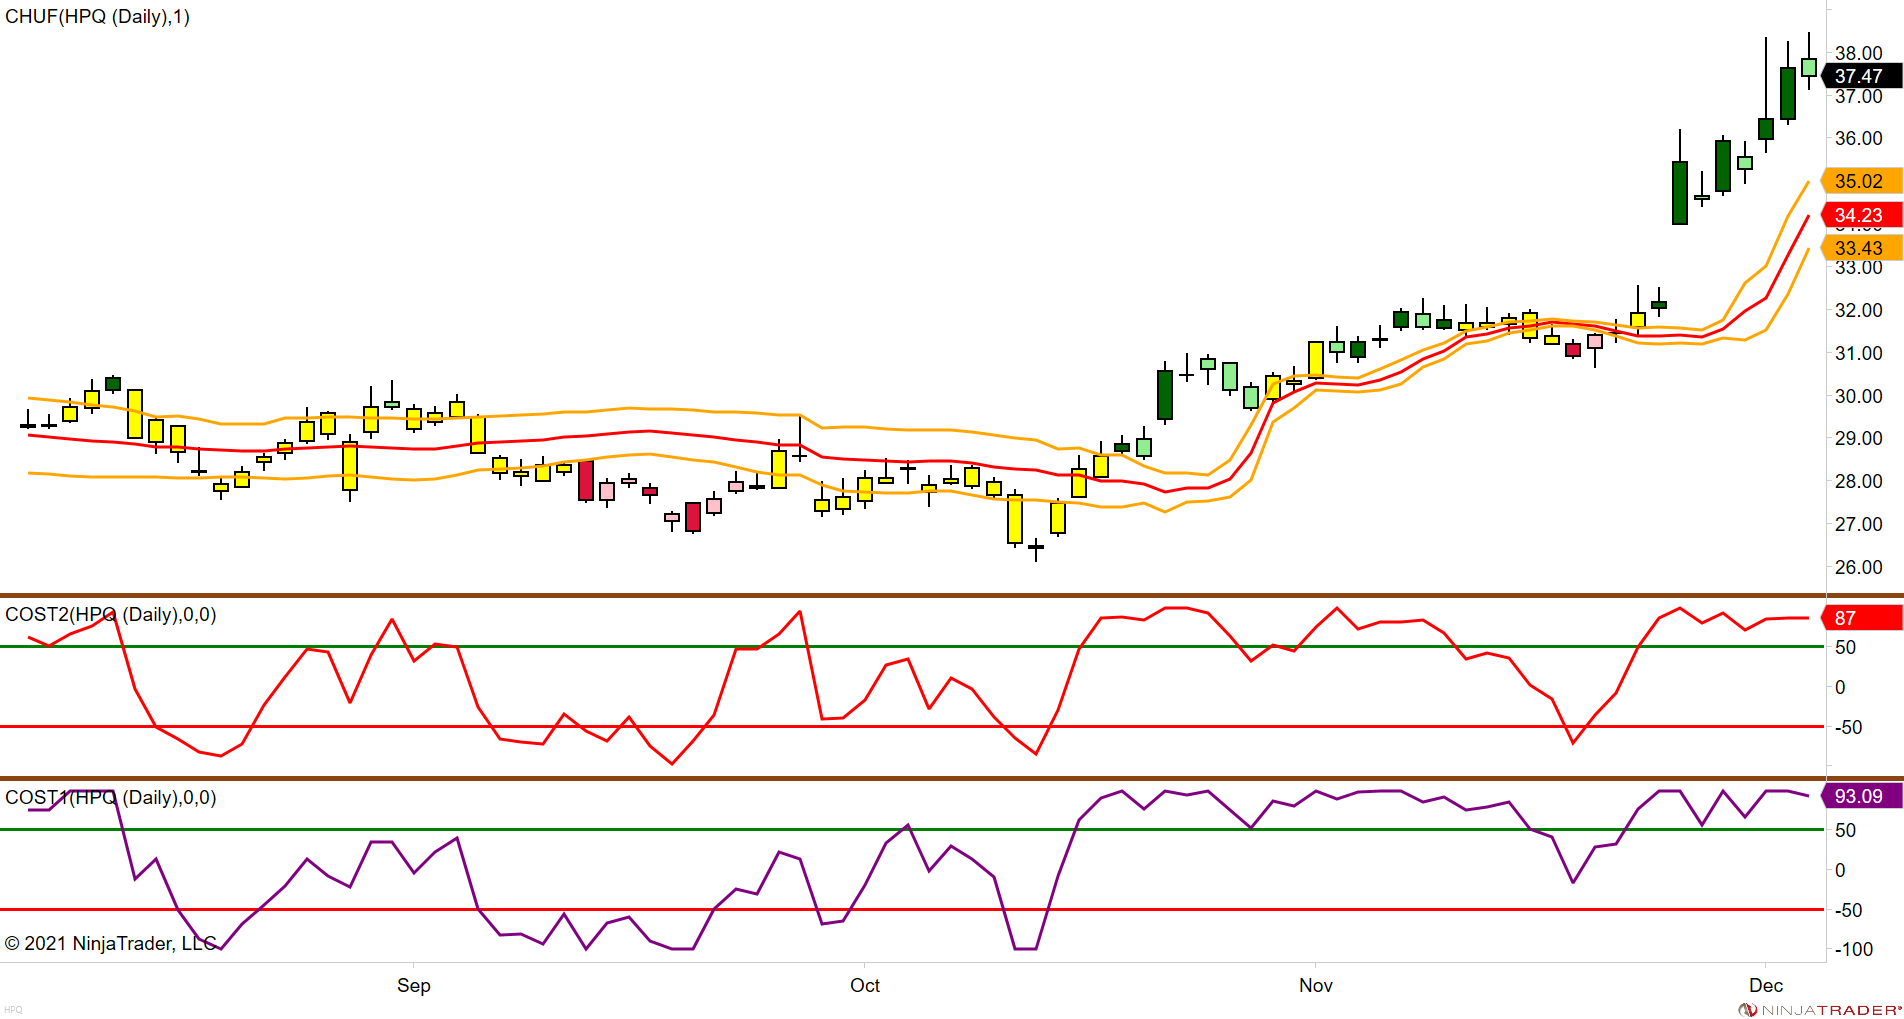
The Stock of the Week
Hewlett Packard (HPQ) rallied all week long, clearly the star of the week.
Wrap-up
If you like to do your own research, my posts should give you a good starting point, with context and suggestions. Then, you can visit my website, chandeindicators.com, for more information and ideas. I hope you stay tuned and help by subscribing and recommending it to your friends and colleagues.
Thank you for spending some time with me.
Disclaimer
And now for some housekeeping. This publication is for “edutainment,” education, information, and entertainment purposes only. It is not to be construed as investment advice. Past performance is not necessarily indicative of future results. Our disclaimer at chandeindicators.com is included herein by reference.