

Prices Inflate, Stocks Deflate
Prices Inflate, Stocks Deflate
We use ETFs to delve into the seemingly short-lived inflation scare.

Overview
US Consumer Prices jumped 4.2%, and stocks deflated.
The Federal Reserve downplayed the inflation statistics, meaning it was likely to have little effect on Federal policies.
In a counter-intuitive move, “inflation” related ETFs and TIPS ETFs also deflated.
Stocks rebounded later in the week. It is possible this is a dead cat bounce after a steep sell off, but we have proof of a live cat bounce.
Key Question
Inflation is expected to rise over the next few months, and then slowly fade back to its long-term level. If that is true, then we should see this expectation reflected in traditional inflation hedges such as gold and TIPS (Treasury Inflation-Protected Securities). We will use ETFs to explore this issue.
Performance Summary
A week of strong selling, particularly in technology stocks. The QQQ index was down -5.44% mid-week, before bouncing to end the week. Small stocks were also weak, as their consolidation continues. The S&P-500 bounced off its 50-day simple moving average, but overhead resistance remains.

The heavy selling in technology started last week, and as we have discussed, the tech giants reported very strong earnings, and were promptly taken to the woodshed. They have met one of the down-side targets from Fibonacci analysis, but risk remains down to the 310 area.

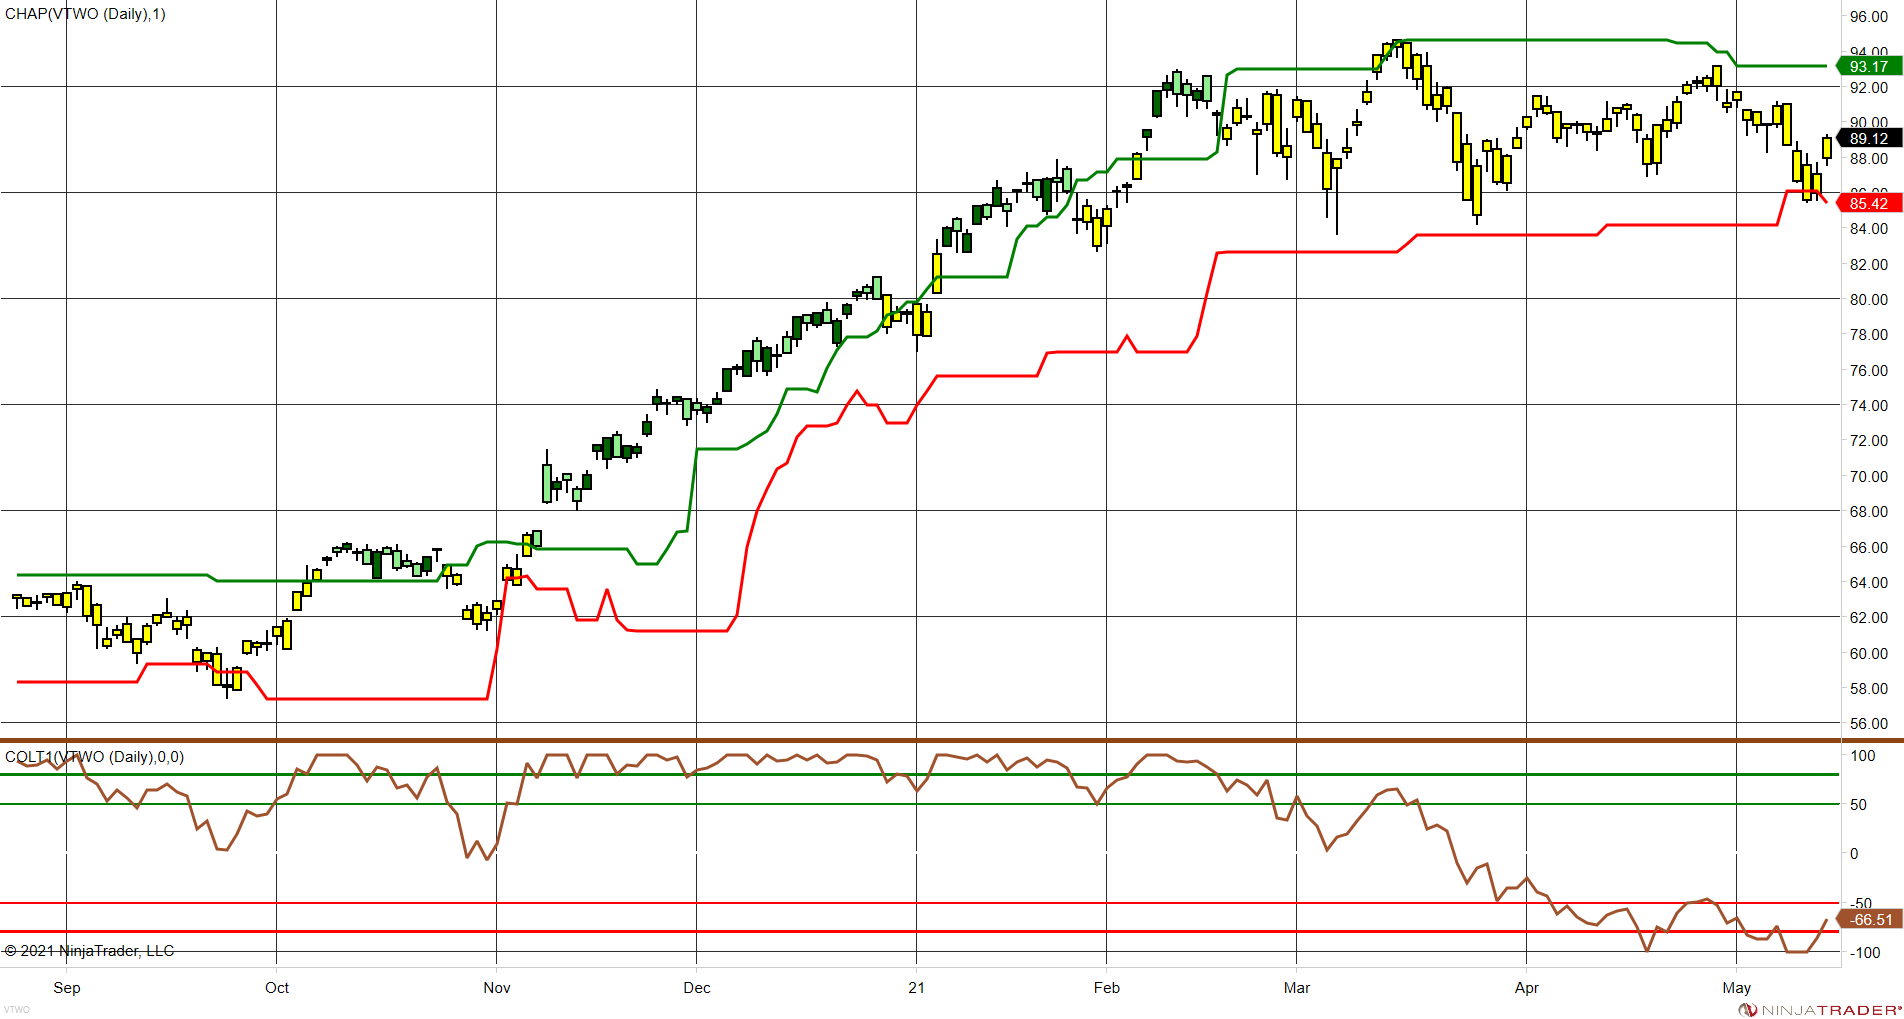
Small stocks were weak again, as their consolidation continues. This week they bounced off support.
Trend Direction from Leveraged ETFs
The balance of leveraged bull ETFs and inverse bear ETFs switched in favor of the bears this week, and ended the week that way, despite the late week bounce. This is a sensitive indicator, that changes direction quickly, but the broader trend spectrum from US Sector ETFs seems to support its bearish tilt.

The trend spectrum is another measure of breadth, using US sectors only.

Sector Vector
We focus on the short-term trend strength (COST1+COST2) versus long-term trend strength (COLT1+COLT3) for the major US sectors. These data are on our website in the “Find ETFs” table. They give us a sense for the intensity of short-term selling. The weakest sectors are in the lower-left quadrant and the strongest sectors are in the upper-right quadrant. The weakest sectors were in the technology area, particularly semiconductors, internet, health care equipment and software and services. Long-term investors can look at these as a value trade or counter-trend buying opportunity. Trend followers will look at the upper right quadrant. The table below the chart is the key to the symbols.


Is there an inflation scare?
We use the “ETF Finder” table to examine the charts of various inflation-related ETFs. We begin with Treasury Inflation Protected Securities (TIPS) ETF, TDTF (Flexshares Trust IBOXX 5-year Target Duration TIPS Index Fund). This ETF peaked on Monday, and trended lower all week, bouncing on Friday in tandem with stocks. It has trended higher since April, but this week it seemed to be looking at the equity market for cues. Perhaps it was a case of buy the rumor and sell the fact kind of trade.

If inflation is a real problem, the Gold market seems to be ignoring it. GLD (SPDR Gold Trust) is down for the year, and like TDTF above, it has drifted higher since April. However, this week it traded in tandem with the equity market, after making mid-week lows.

The CORN ETF dropped some -13% or so this week, almost as if we were paying for the commodity with tech stocks. It too has rallied since April, but the sell-off in stocks must have made some people book profits in CORN to ease their equity pains.

The declines in these markets could be short-lived, but at least this week, they declined rather than going up after the consumer price report. Hence, these markets are not looking at consumer prices as their source of inflation expectations, or it was a case of “buy the rumor, sell the fact”, i.e., traders buying in anticipation, and then taking profits.
Link to my live event with NinjaTrader Ecosystem
I would like to thank the NinjaTrader Ecosystem folks for hosting a discussion on my new technical indicators for NinjaTrader and to everyone who tuned it. A link to the presentation is below should you wish to catch up.
https://ninjatraderecosystem.com/webinar/trade-breakouts-like-a-pro-new-tools-for-day-traders/
New Tools on ChandeIndicators.com
We have put up new tools on the website. We rank hundreds of stocks and ETFs using some of the indicators discussed in the NinjaTrader platform presentation. You can look through the Stock Finder and ETF Finder tables for trading and investing opportunities.
The new Robo-Advisor allows you to estimate allocation to stocks based on your age and sex using two different algorithms. You can play with the allocations to see how a 4-ETF or 10-ETF portfolio might look like. This is a very useful tool, especially for women and those approaching retirement.
Wrap-up
If you like to do your own research, my posts should give you a good starting point, with context and suggestions. You can visit my website, chandeindicators.com, for more information and ideas. I hope you will stay tuned, and help, by subscribing, and recommending it to your friends and colleagues.
Thank you for spending some time with me.
Disclaimer
And now for some housekeeping. This publication is for “edutainment”, education, information, and entertainment purposes only. It is not to be construed as investment advice. Past performance is not necessarily indicative of future results. Our disclaimer at chandeindicators.com is included herein by reference.