
No Cause for Pause
Can the Fed contain inflation? We travel back to the 1970s.

Overview
The market rally stalled at resistance under an onslaught of Fed Governor’s warning of a resolute rate-raising regime to conquer inflation.
The May jobs report estimated 390,000 new jobs, with the unemployment rate steady at 3.6%. The markets interpreted this as sufficient to support three 50-bp rate hikes through September.
The upcoming CPI report (6/10) will likely be the trader’s focus next week.
Key Question
What can the Fed do when events beyond its control drive inflation? We try to answer this question by analyzing data from the 1970s.
Performance Review
The market bulls lacked confidence during a shortened week. On Thursday, the action was positive as the market ignored initial weakness to close higher. But Friday’s relatively strong jobs report raised fears of higher rates, and the market closed lower.

The sensitive net bull/bear balance is still above +60, pointing to a continuation of the rebound from last week.

Taming Inflation
Fed Vice Chair Lael Brainard reiterated that “Right now, it’s very hard to see the cause for a pause,” she told CNBC. “We’ve still got a lot of work to do to get inflation down to our 2% target”. Earlier, Treasury Secretary Yellen admitted she was wrong last year about inflation risks. Other Fed Governors also chimed in (here, here, and here) that they will keep raising rates until inflation is “under control”? What does this even mean?
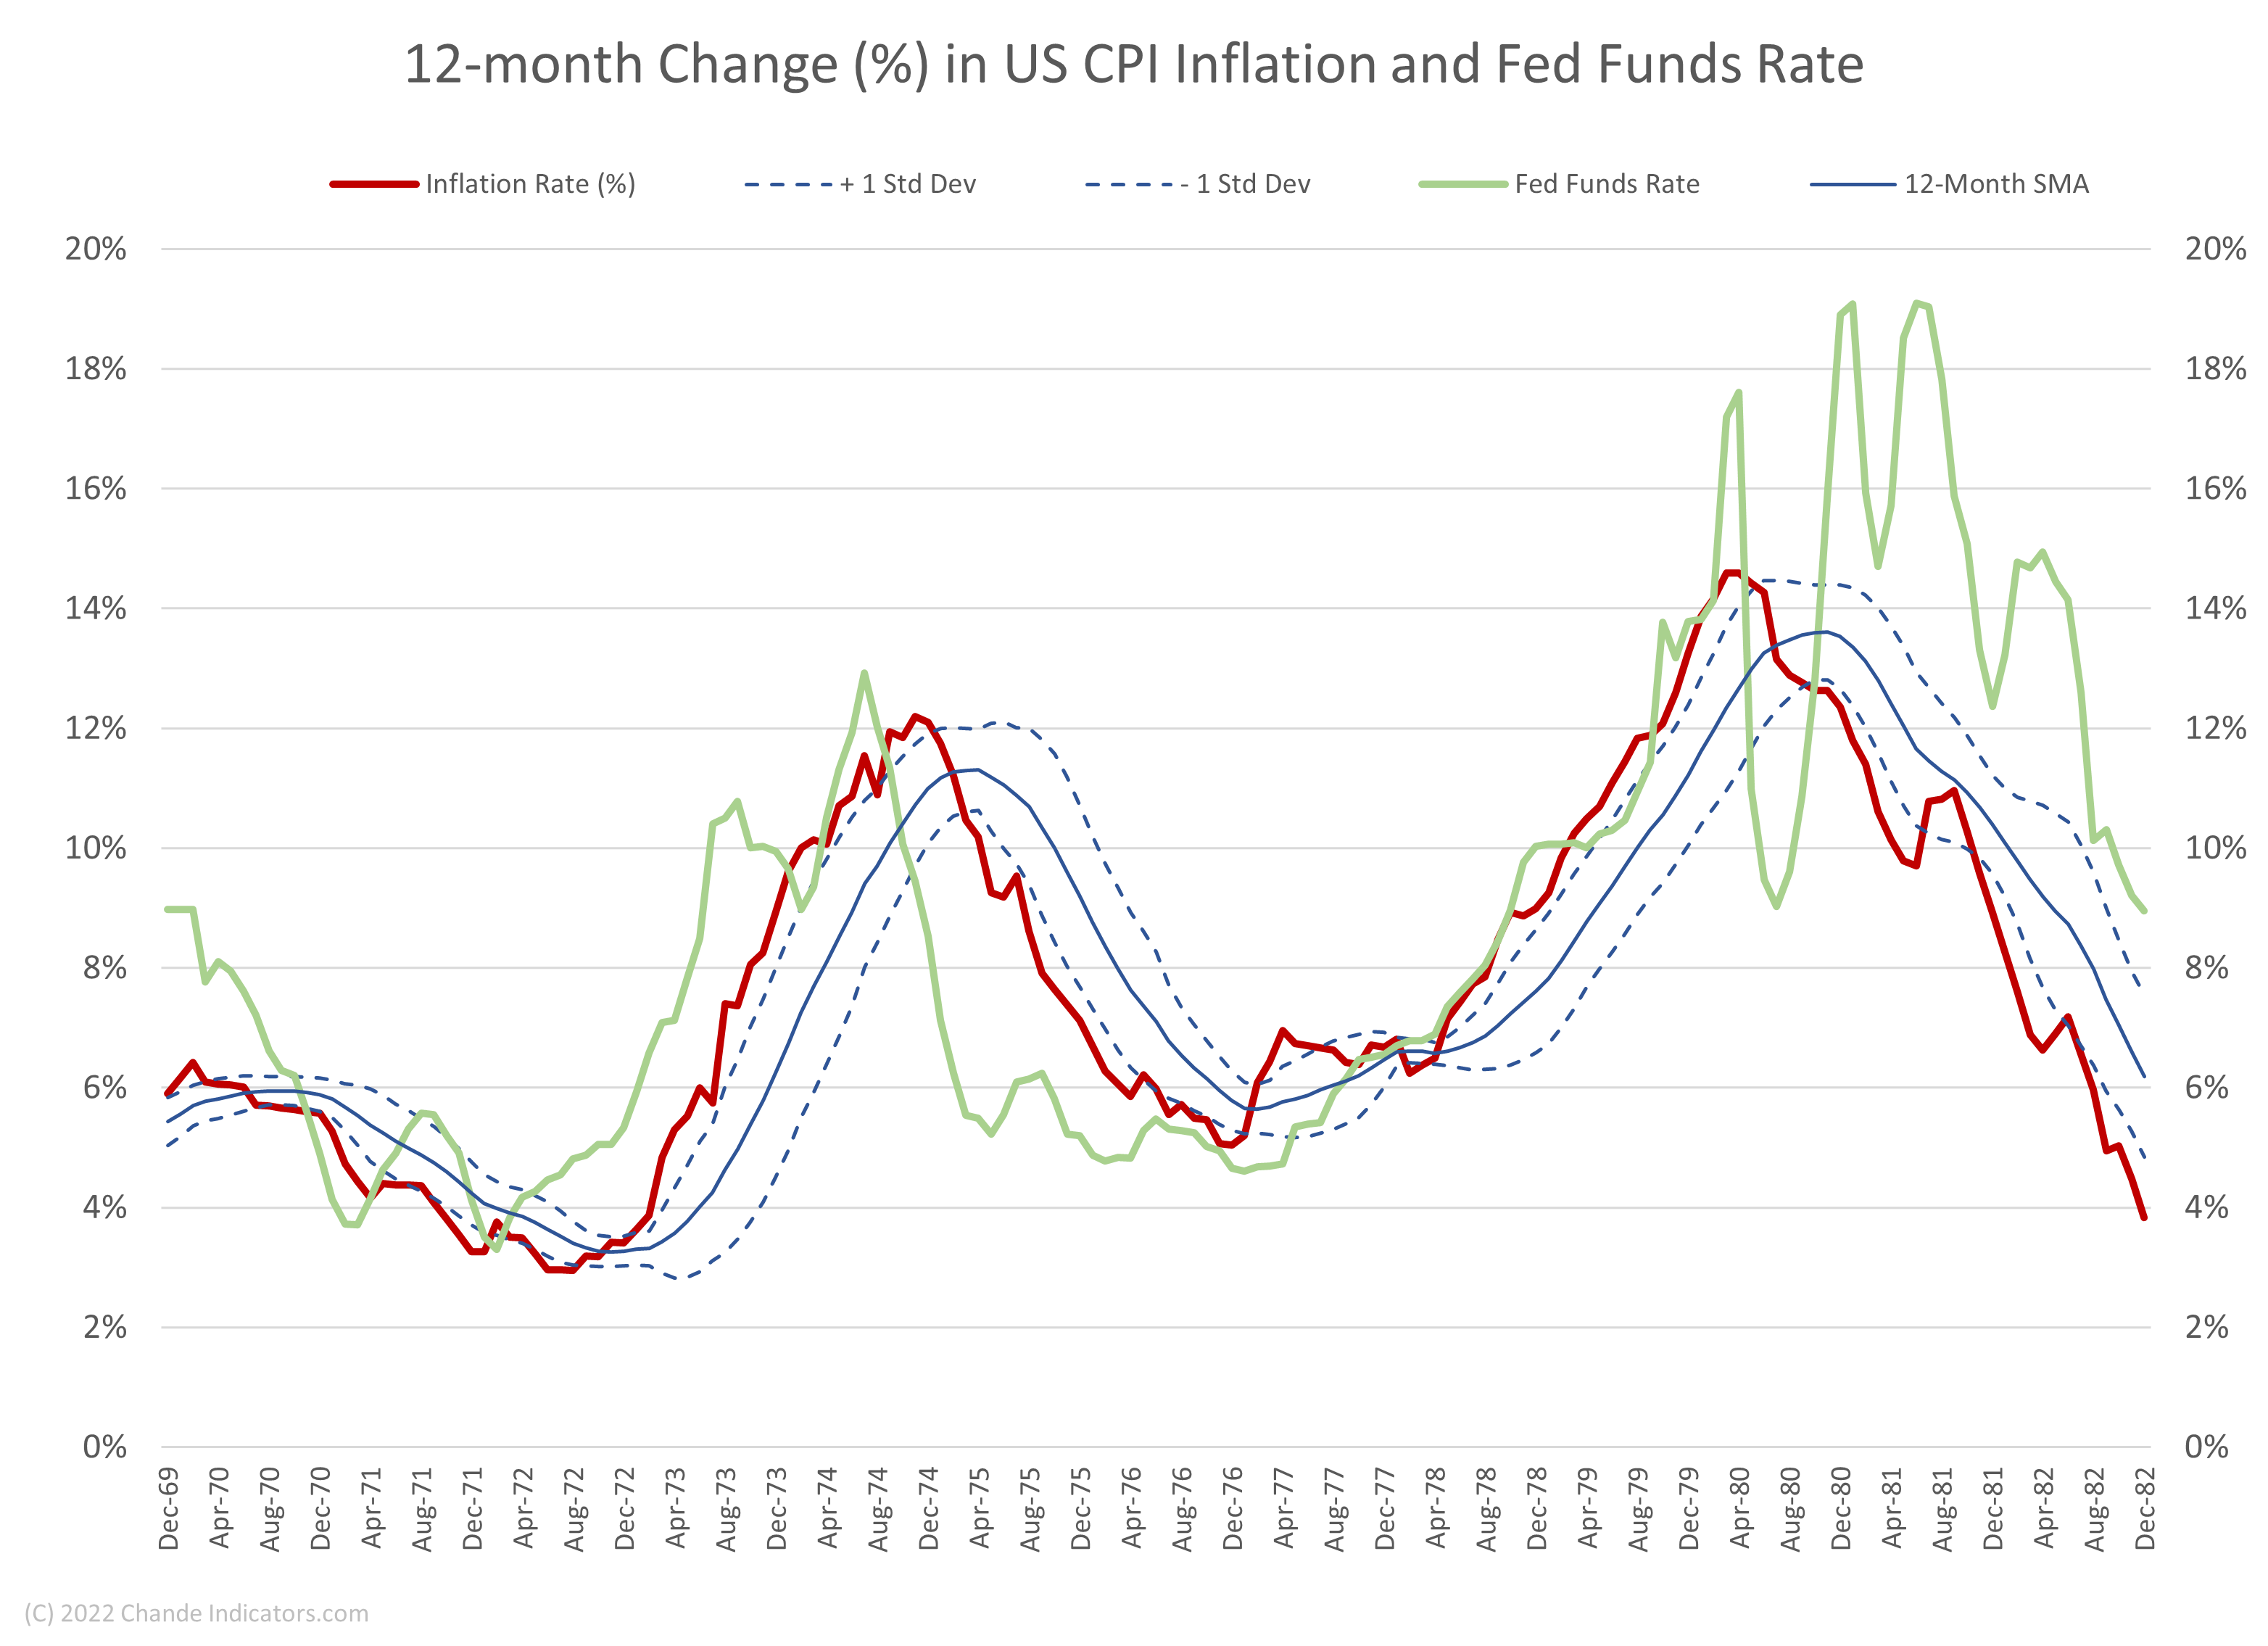
I used data from the Federal Reserve on CPI Inflation, average effective Fed Funds rate, and seasonally adjusted monthly US GDP data to construct the following charts. I focused on the 1970s because factors outside the Fed’s control, such as abandoning the dollar’s convertibility into gold, wage and price controls, the OPEC Oil Embargo, and the Iranian Revolution, drove inflation for years. In addition, I extended the analysis through December 1982 because the Volcker Fed eventually raised rates to nose-bleed levels to crush inflation.
Figure 1 below shows the percentage change in US CPI Inflation over the previous twelve months (red line). I have plotted a 12-month simple moving average (SMA - solid blue line) and 1-standard deviation (SD) band above and below the SMA using the 12-month standard deviation. This chart is helpful because it allows us to quantify the dynamics of inflation. First, we recognize that the inflationary trend has changed when the 12-month percentage change in CPI closes above the upper band or below the lower band. Second, inflation can defy all attempts at control and persist for months.

Here is the current picture. Once again, factors outside the Fed’s control, such as Federal spending, new waves of COVID-19 variants, China’s “Zero Covid” policy and its effect on supply chains, and Russia’s Ukraine invasion and its impact on energy and grain prices have pushed inflation above the upper SD band around the 12-month SMA.

We next check how the Fed policy interacts with inflation via its Fed Funds rate. In Figure 3 below, the lime green line is the average effective Fed Funds rate reported monthly by the St. Louis Fed. The 12-month change in CPI inflation data are the same as in Figure 1. Note that once the 12-month CPI percentage change accelerated above the upper 1 SD band from the 12-month SMA, merely increasing the Fed Funds rate was insufficient to restrain rapid increases in the inflation rate. For example, even though the Fed Funds rate started rising in early 1972, it could not stop the acceleration in inflation between 1972-74. This period included the effects of moving the dollar off the gold standard and the OPEC oil embargo. Inflation again raged outside the Fed’s control due to Iranian oil leaving the market after the Revolution in 1978-79. The Fed’s policies worked (as in the early 1980s) only after the external factors driving inflation had weakened or dissipated. Thus, the main lesson from Figure 3 is that when factors outside the Fed’s control influence inflation (as they are doing now), increasing the Fed Funds rate barely affects inflationary trends.
Naturally, inflation and rising rates help slow the US economy, but only a severe economic contraction could drive down inflation rates (see Figure 4). For example, the economy contracted for more than a year in 1973-74 before inflation began to decline. Similarly, the contraction in 1979 did little to dampen inflation.

My calculations have used CPI inflation data, and the FOMC prefers to use the Personal Consumption Expenditures (PCE) series without food and energy. However, the two series are closely correlated, so my analysis is acceptable. Here is the Fed’s current inflation picture based on PCE data. The latest PCE reading is well above the lower standard deviation band (4.19%).

Using Figure 5, we can say the trend in PCE has declined only when it drops below the lower band, which appears unlikely for many months. For example, I simulated what might happen if the PCE drops by 0.1% every two months for the rest of the year. Note how it would fall below the band towards November or December this year.

Conclusion
We note for completeness that futures on Wheat and Corn have declined recently, and Soybean futures have mostly moved sideways since February. Crude oil futures prices have only recently exceeded their February highs, but a slight market imbalance could quickly push them even higher. Remember that the global oil market has little spare capacity to adjust supply-demand imbalances structurally. Moreover, the Fed does not control how the Chinese economy will evolve in the months ahead, nor how Russia might manipulate oil and natural gas supplies or grain exports from Ukraine. So the Fed will indeed affect perceptions on Wall Street and slow US economic activity by raising rates, but factors beyond the Fed’s control could limit their effect on the precise path of the PCE. In conclusion, until external factors dissipate, the Fed can only play a limited role in reducing inflation.
Wrap-up
My posts should give you a good starting point, with context and suggestions if you like to research. Then, you can visit my website, chandeindicators.com, for more information and ideas. I hope you stay tuned and help by subscribing and recommending it to your friends and colleagues.
Thank you for spending some time with me.
Disclaimer
And now for some housekeeping. This publication is for “edutainment,” education, and entertainment, not for investment advice. Past performance is not necessarily indicative of future results. Our disclaimer at chandeindicators.com is included herein by reference.