

LNG Bubbles Up
LNG Bubbles Up
We highlight the rally in LNG and steel stocks.

Overview
Ukrainian resistance won the first phase of the war, as the Russian invasion stalled badly after heavy losses. But, the awful bombardment of civilians and infrastructure continues. The market has moved on to other worries, but keep your eye on Ukraine.
FOMC Chair Powell opened the door to 50-bp steps in a bid to front-load rate increases. This led to a surge in bond yields and slowed tech-stock gains.
NATO met to add even more sanctions, marking the start of a New Cold War. EU nations agreed to buy more LNG from the US.
The market’s rally continued, with volatility declining rapidly and the S&P-500 within sight of resistance at 4600. Again, however, small-cap stocks lagged. (The chart below is updated from last week.)
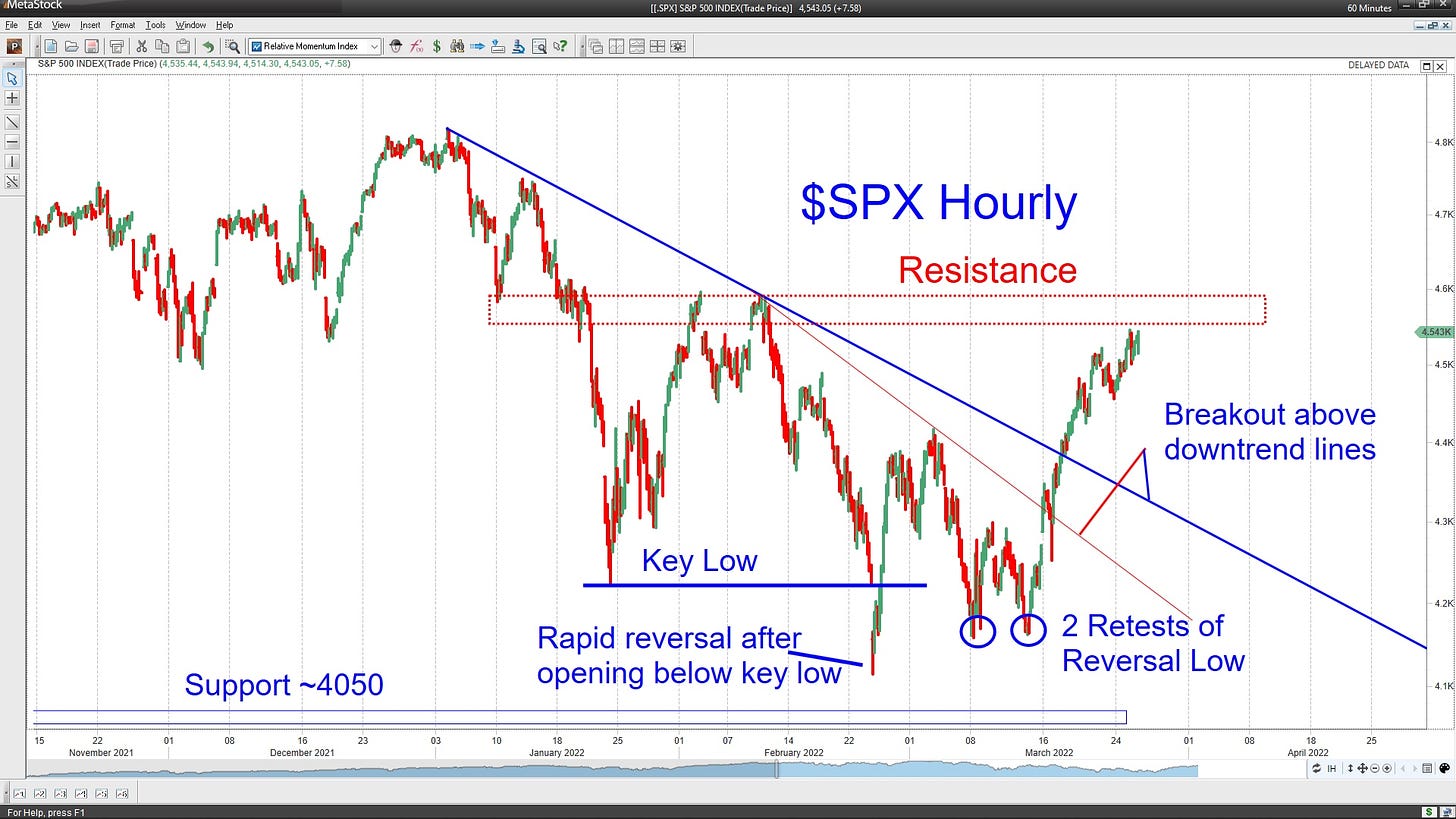
The rally in the S&P-500 index is approaching resistance near 4600. (Chart courtesy MetaStock.)

Key Question
As part of the many layers of sanctions on Russia, European nations have agreed to reduce their LNG imports from the US. Can we identify stocks to trade this news? We also look at steel industry stocks.
Performance Overview
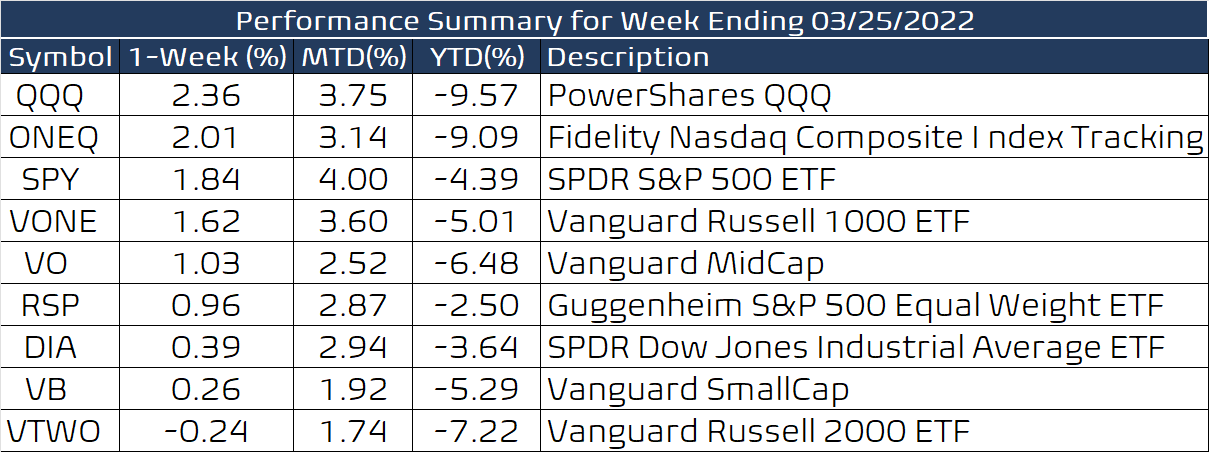
The market rallied for the second consecutive week. Large-cap tech stocks did well, despite the surge in rates this week. Small-cap stocks lagged a bit.
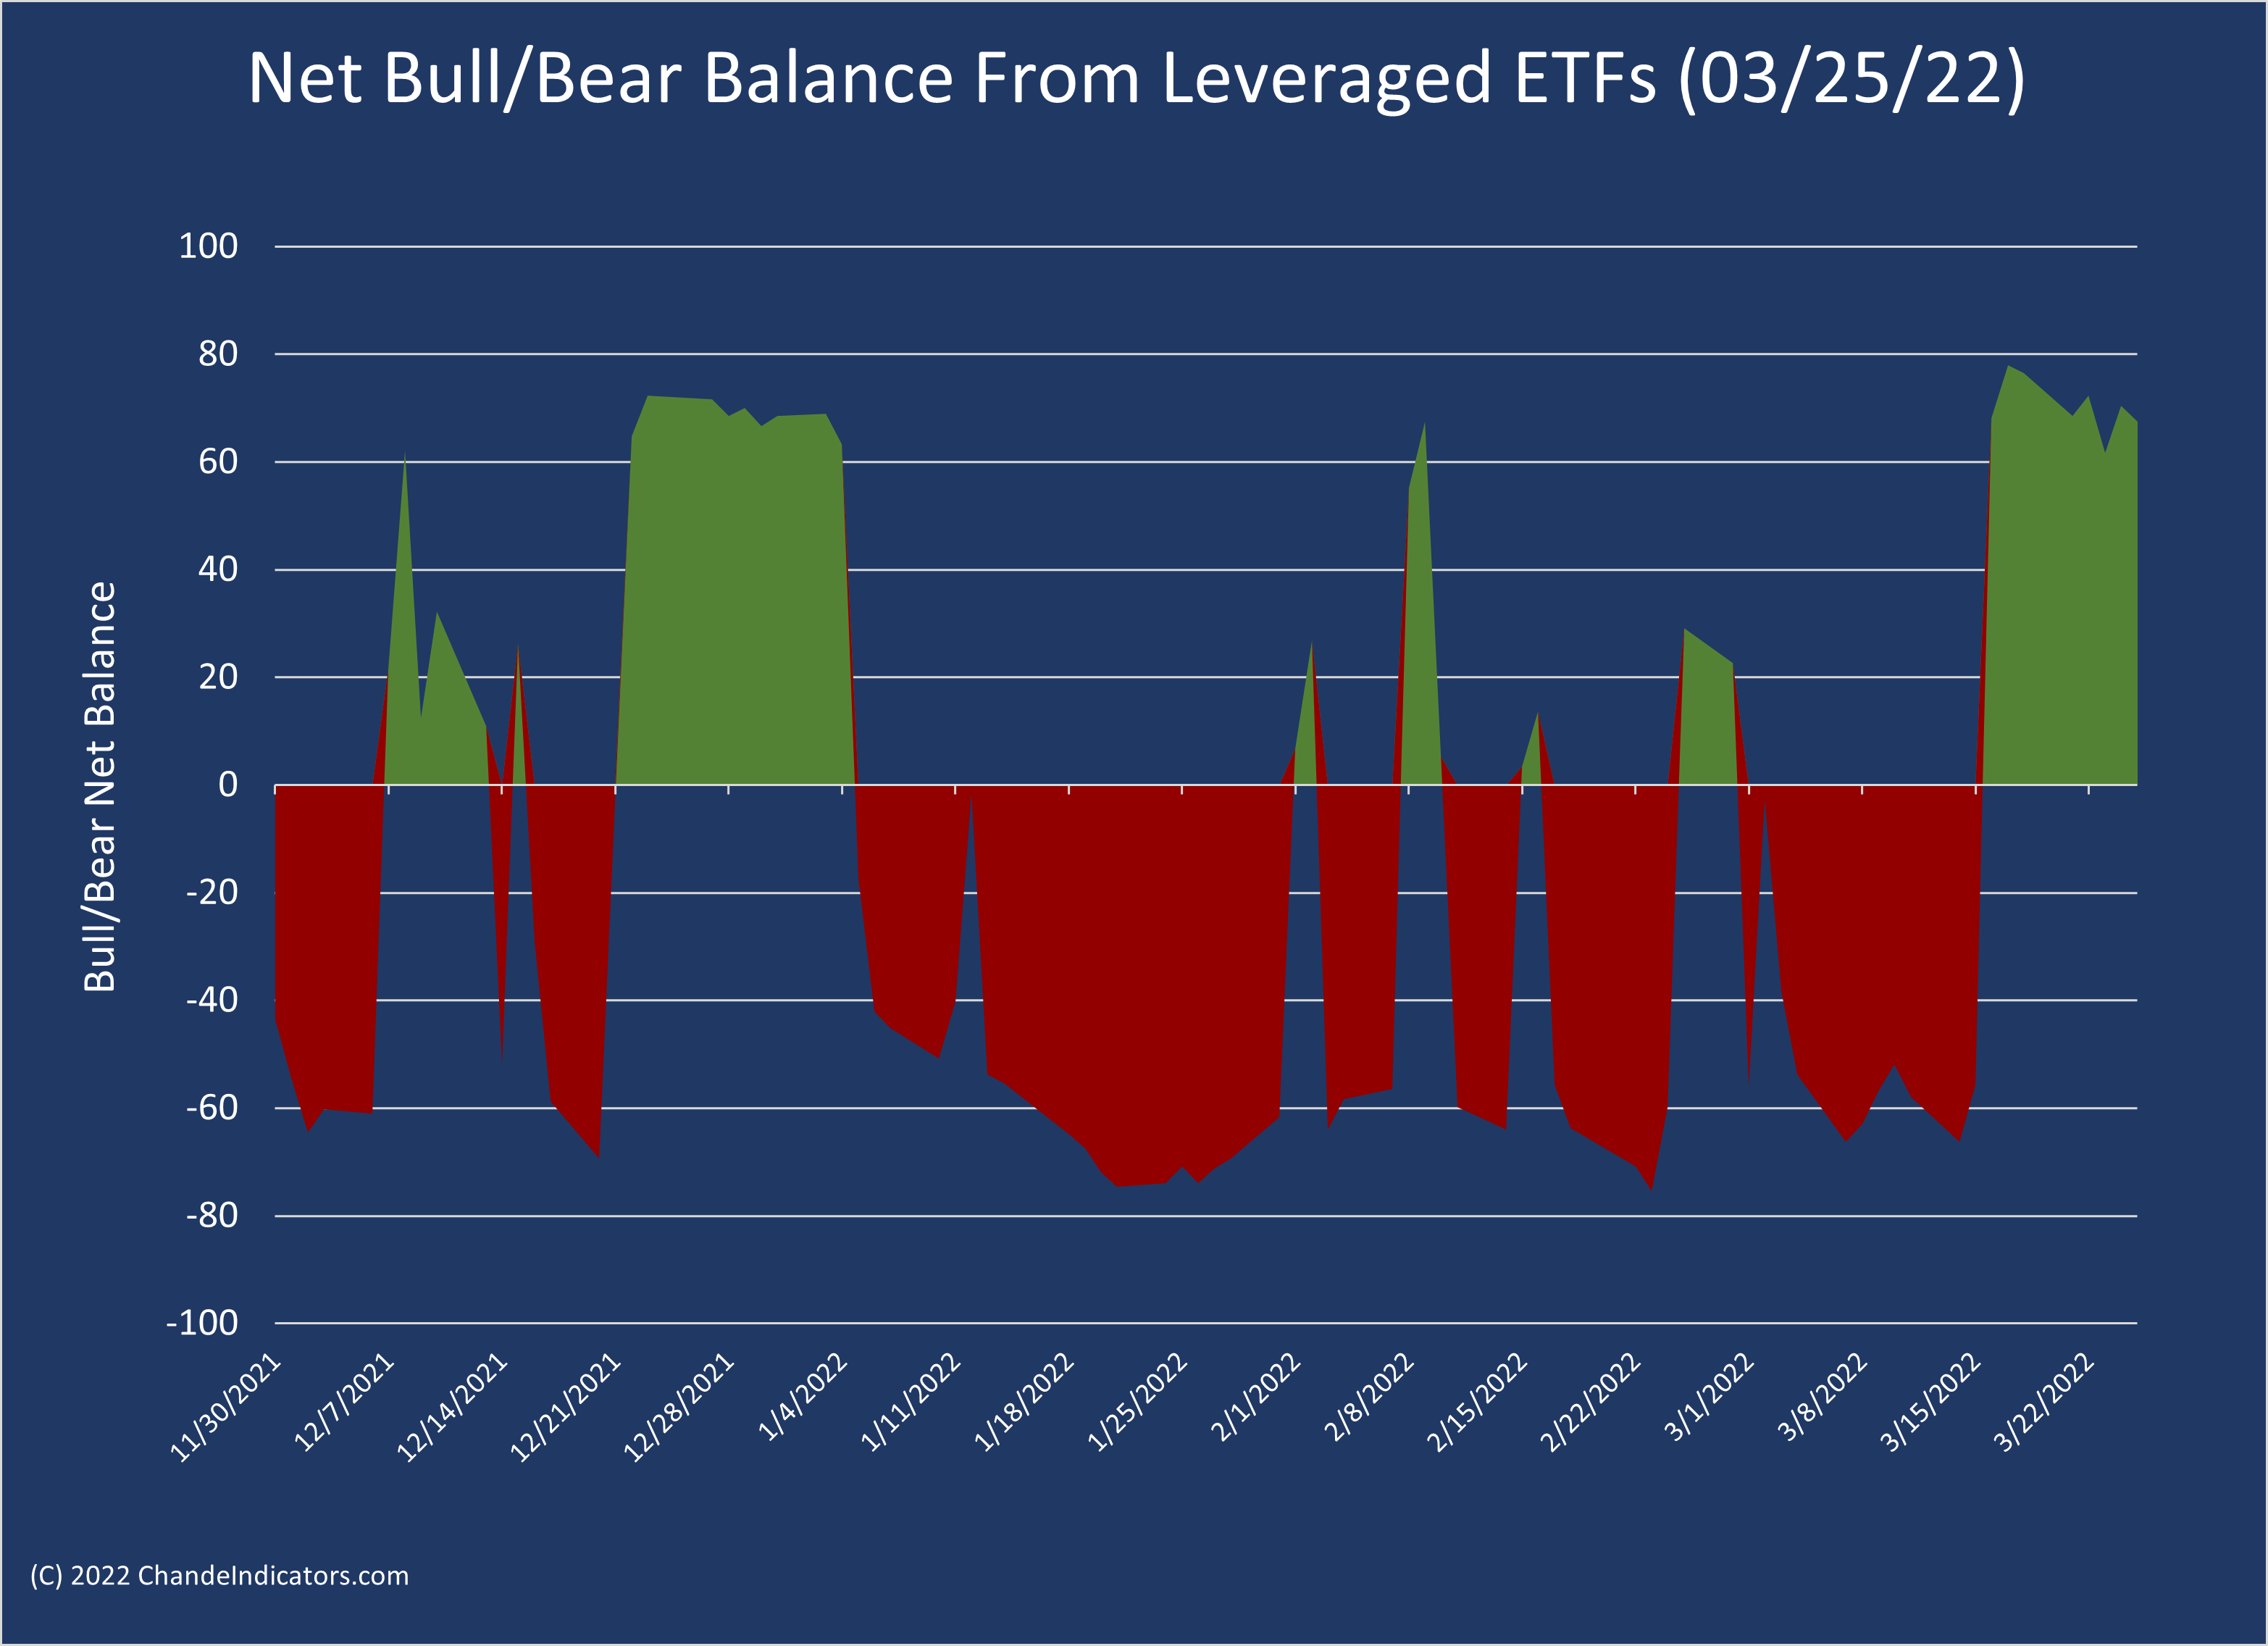
As we observed last week, the net bull-bear balance suggested the rally would continue. This week this indicator also closed at a strong level, so absent more worrying headlines, we should expect the market to keep trending higher.
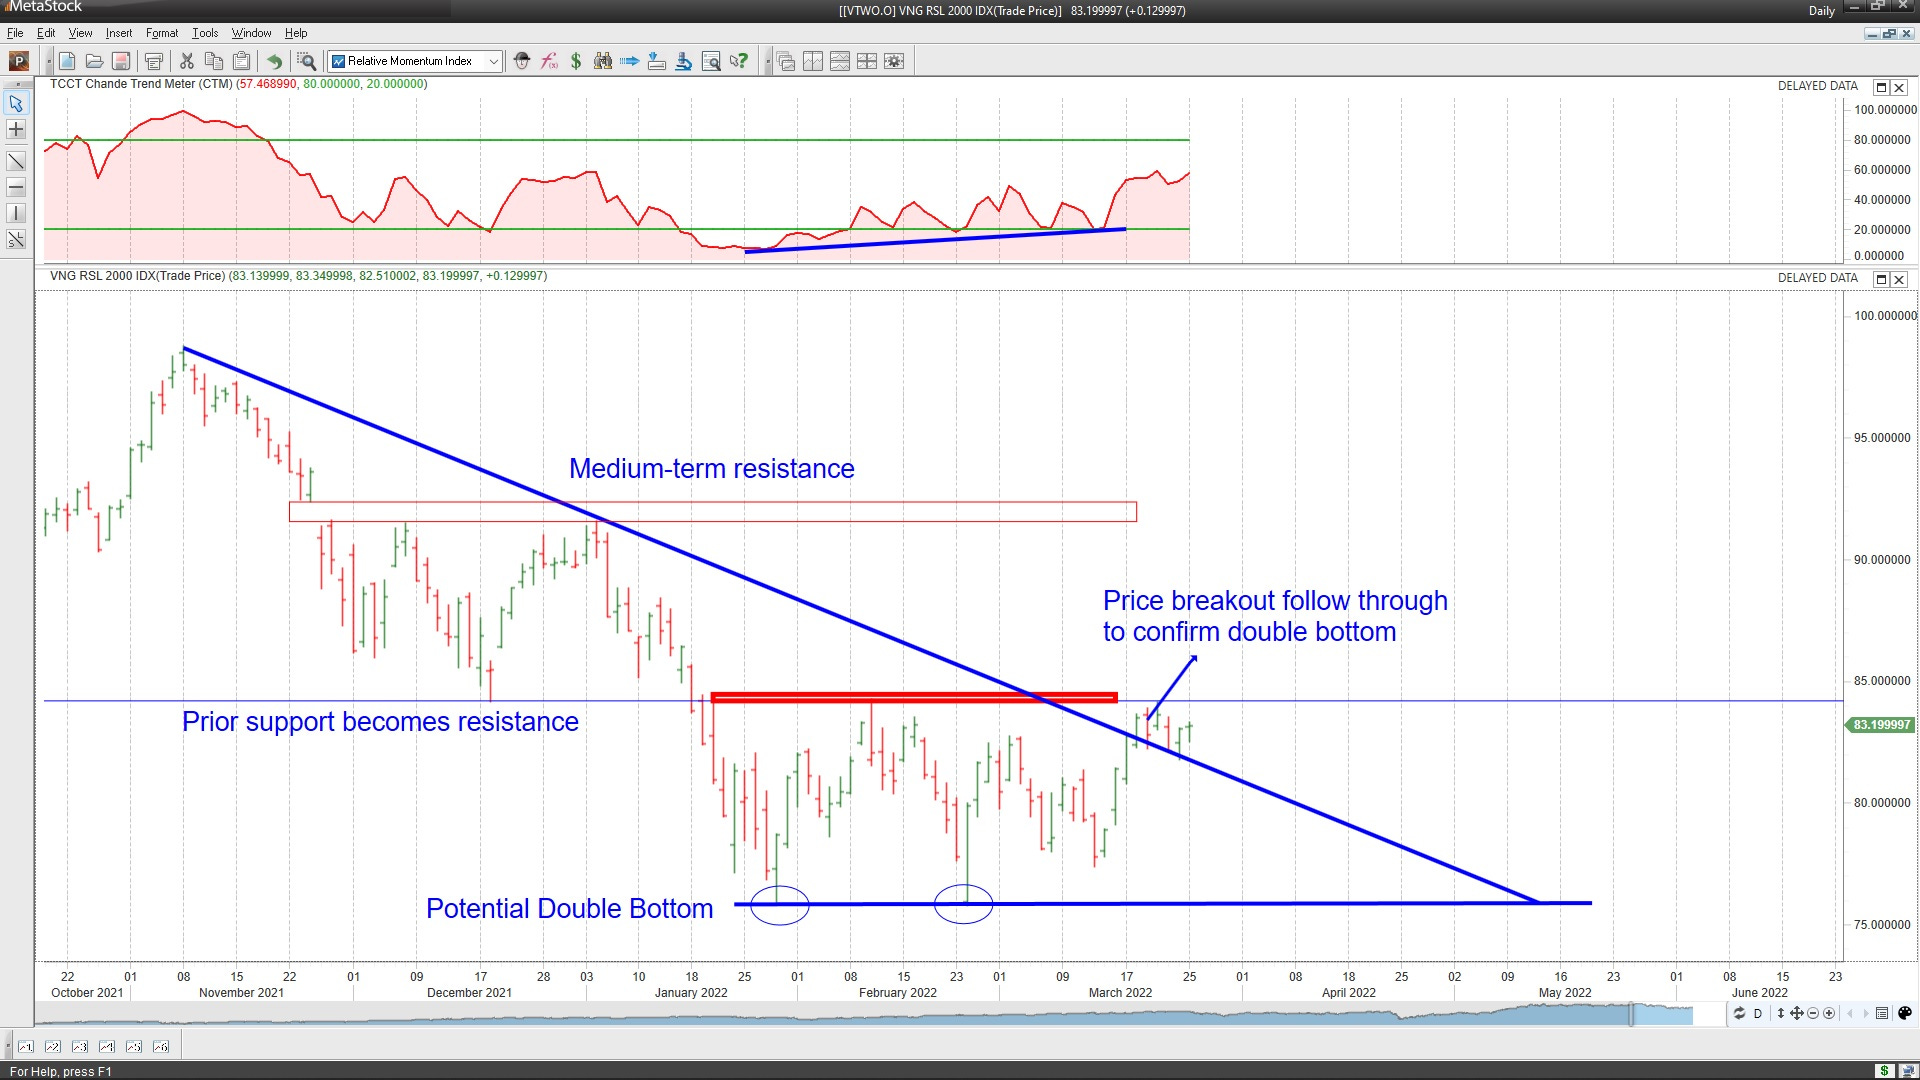
We look back at the VTWO (Vanguard Russell 2000 index) chart that we have relied on for the past month as a proxy for the trends in the broader market. This week, VTWO stalled at the resistance we marked a month ago, but this could be the pause that refreshes. We await a decisive follow-through as a sign of a broadening in the rally (it had a down week, as you see from the weekly performance summary.)
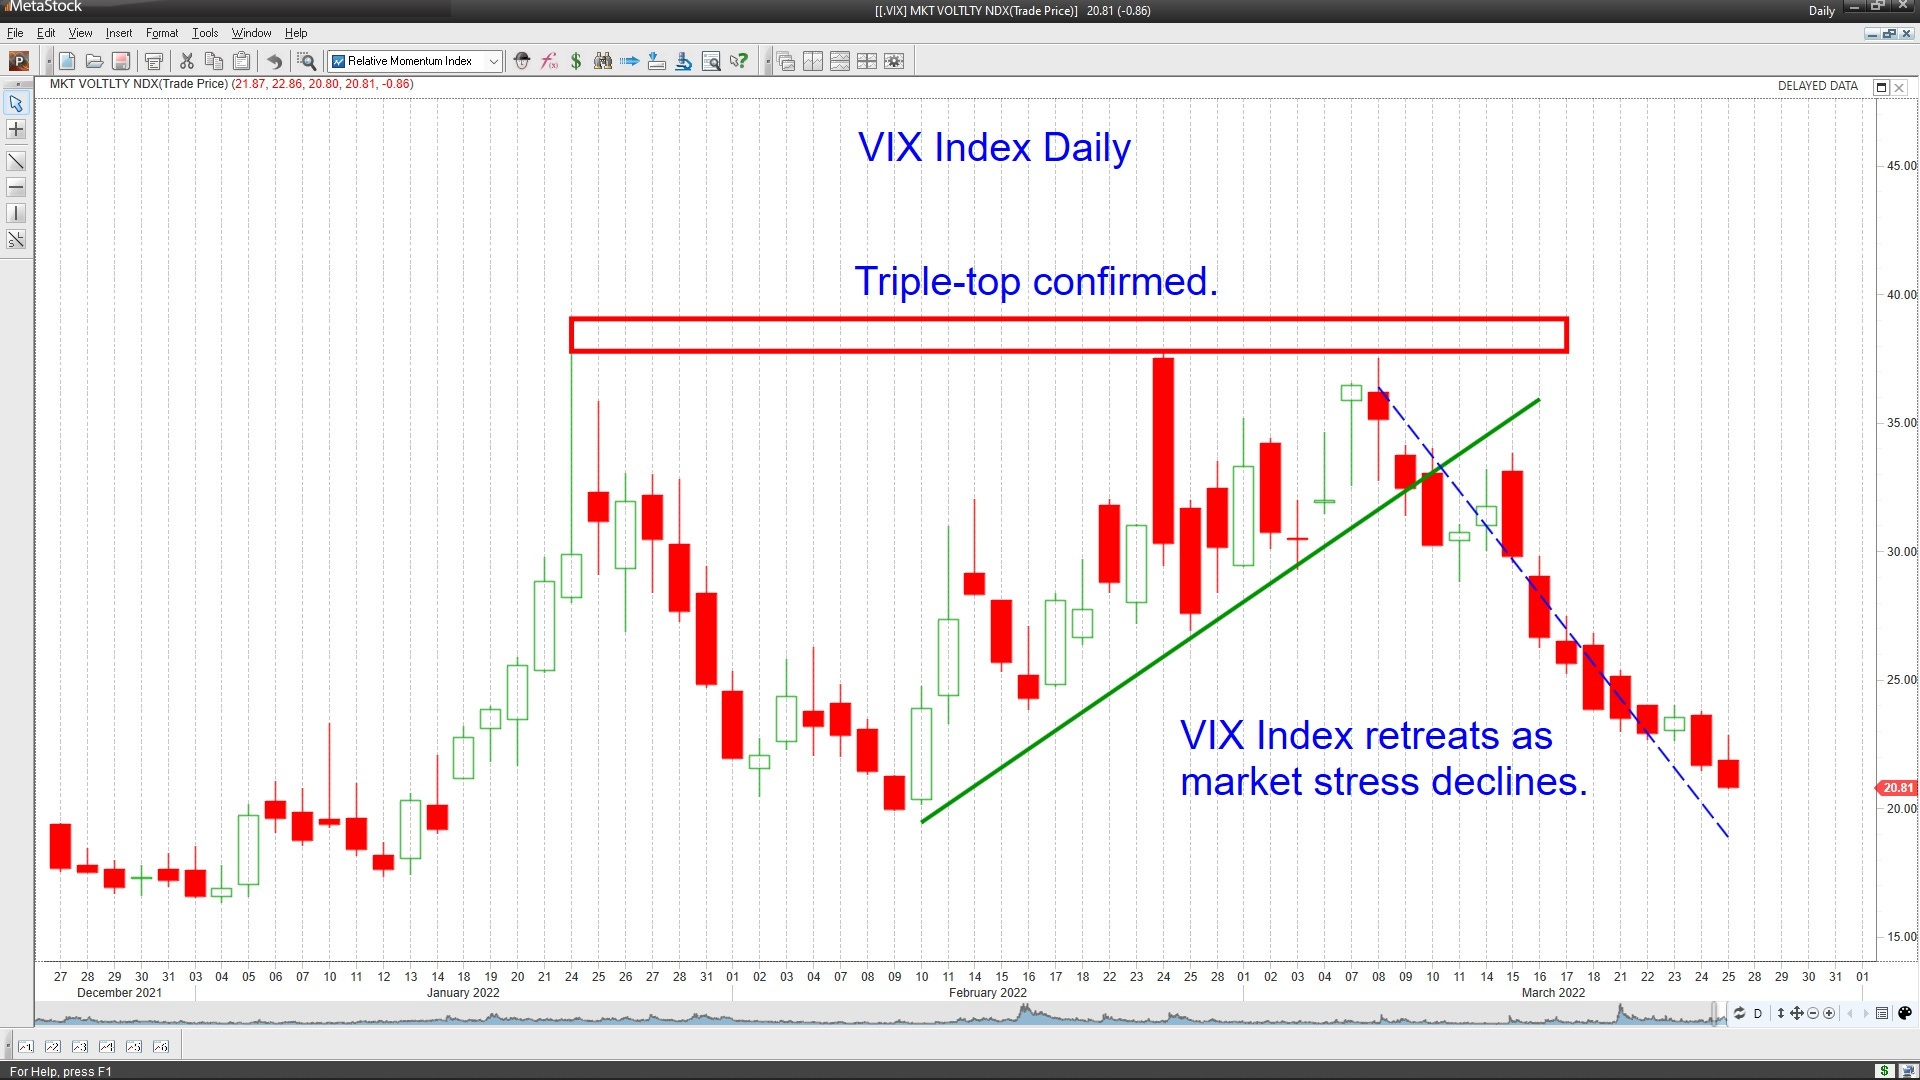
The decline in the VIX index is a welcome relief for bulls and perhaps will help pull in more institutional support as the rally climbs a wall of worry.
LNG and Steel Stocks
The agreement to send more LNG from the US to Europe was a boon to several companies. We used the MetaStock explorer engine with the Chande Trend Meter to scan the Energy sector (121 stocks) to find the ones with the strongest trends (see scan image below.) The sector is enjoying strong trends, with more than 64% of the stocks reporting CTM values greater than 80.
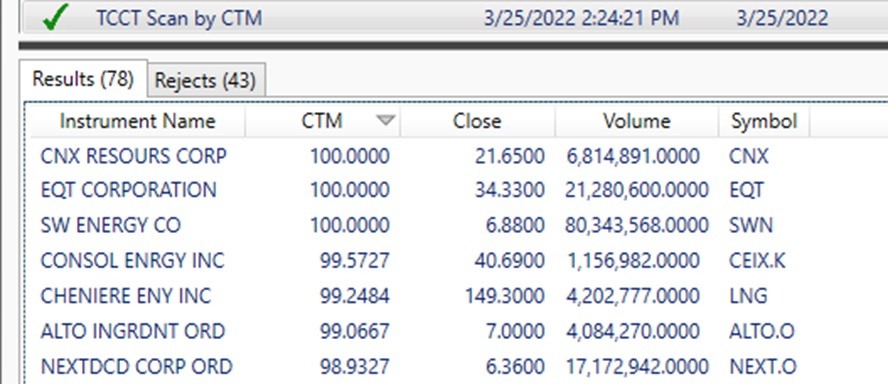
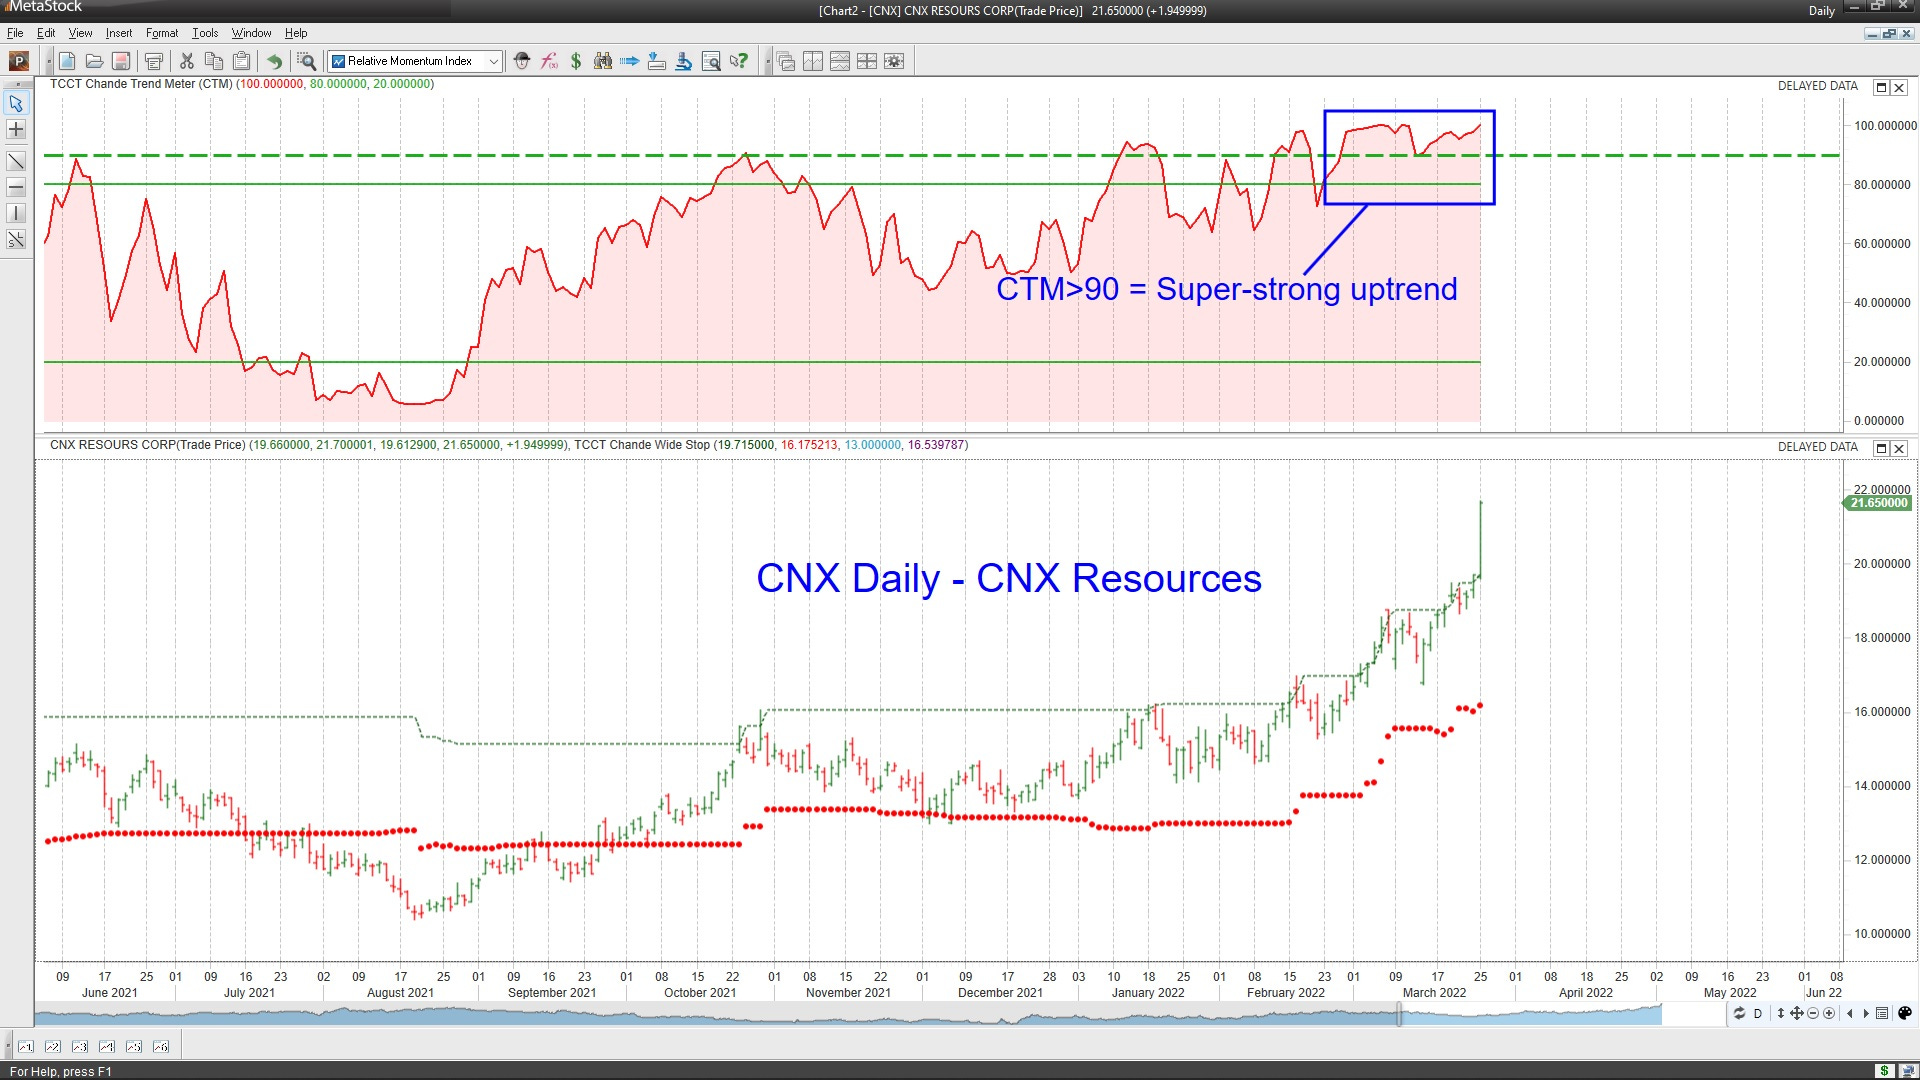
The top stock in the list is CNX, and its chart is quite similar to the big moves in all of the LNG-related stocks today, such as EQT, SWN, and CTRA.
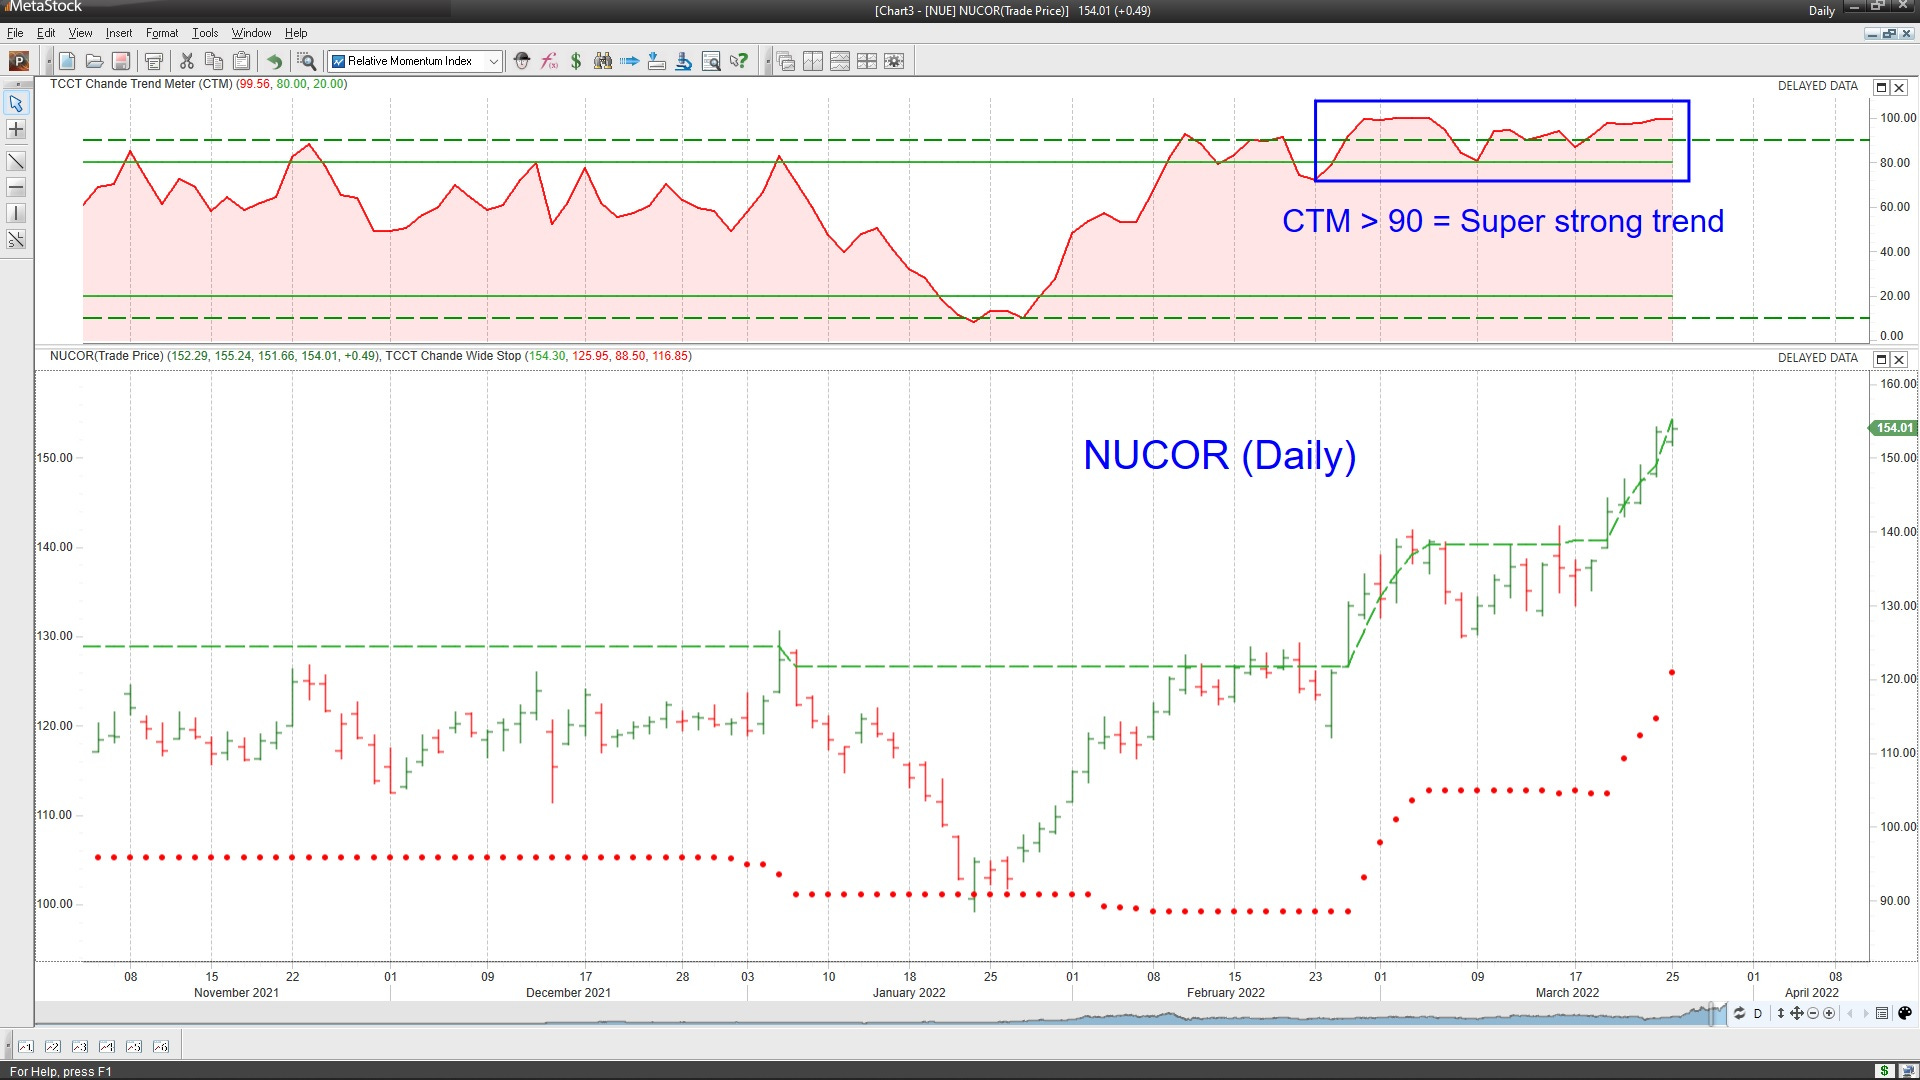
Two weeks ago, we observed that even though the oil rally had broken its uptrend, the XME SPDR Metals and Mining ETF had not. This ETF has since moved to new highs this week, as you can see below. Steel stocks, such as Nucor and Steel Dynamics, are among its ten largest holdings.
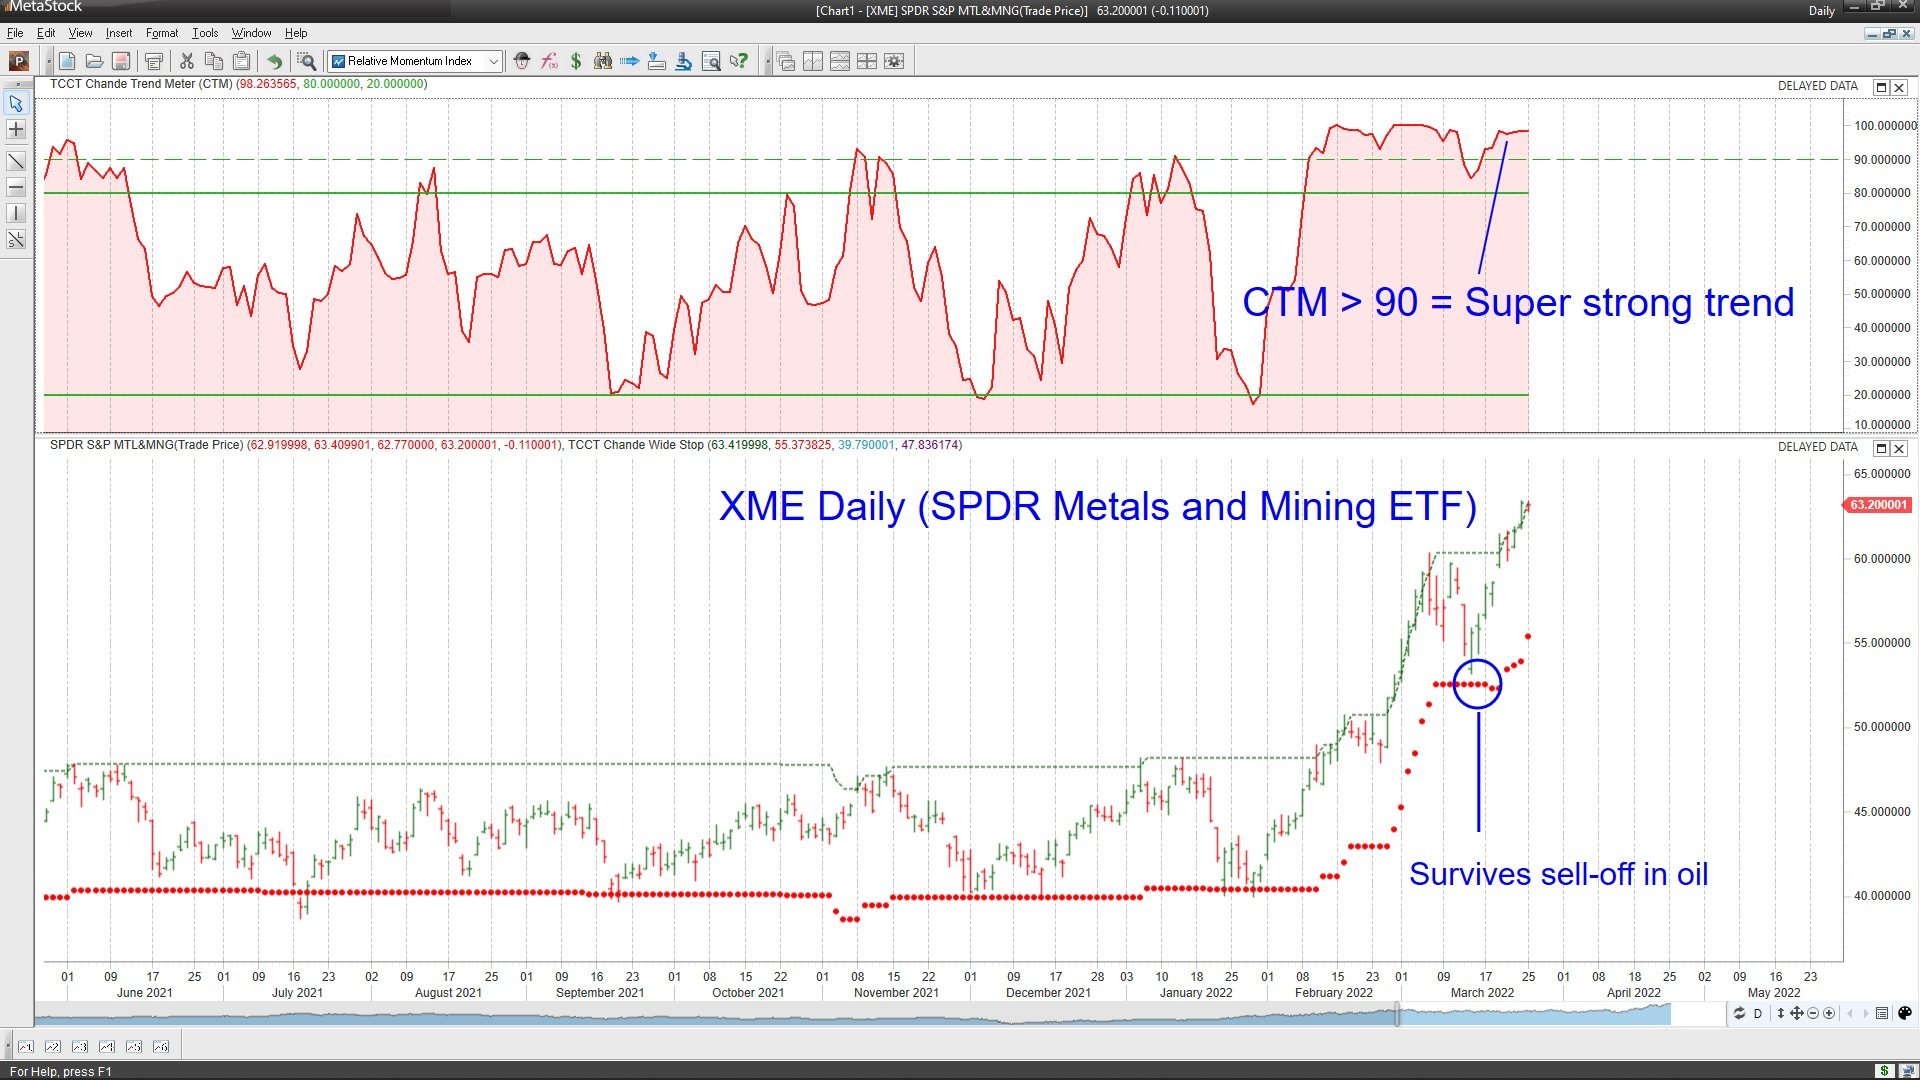
One of the most diversified steel manufacturers in the US, Nucor has enjoyed a nice rally and did not stall much after oil fell dramatically two weeks ago. Steel Dynamics (STLD) is yet another steelmaker showing trend strength. If you wish for a more diversified basket of stocks, then consider the Van Eck Steel ETF (SLX).
Navigating Today’s Volatile Markets using CTM
I have several charts and scans to show that you can trade these volatile markets using the Chande Trend Meter in this Metastock presentation. So it’s worth looking if you think this may be a good time to add to your portfolios.
Wrap-up
My posts should give you a good starting point, with context and suggestions if you like to research. Then, you can visit my website, chandeindicators.com, for more information and ideas. I hope you stay tuned and help by subscribing and recommending it to your friends and colleagues.
Thank you for spending some time with me.
Disclaimer
And now for some housekeeping. This publication is for “edutainment,” education, information, and entertainment purposes only. It is not to be construed as investment advice. Past performance is not necessarily indicative of future results. Our disclaimer at chandeindicators.com is included herein by reference.