

Overview
The FOMC has morphed into a fierce inflation fighter as it signaled 50-bp rate hikes and a $95 billion roll-off from its portfolio of bonds.
Tech stocks took a drubbing as the market adjusted to the new Fed plans. As a result, the S&P-500 paused, and small-cap stocks retreated.
The consumer-staples sector is now trending, as the market expects consumers to pare-back spending plans. See, for example, the Walmart stock chart below.

Key Question
Which sectors are gaining strength as the FOMC gears up to fight inflation? We use the CTM to suggest some answers.
Performance Review
The S&P-500 rally stalled just above previously marked resistance. Since then, it has been in a modest down-trend channel. However, we have marked two support areas, and until these are broken, the low is safe.

It was a negative week in the market, particularly for tech stocks. Traders quickly forgot their last week’s rally. Notice that the RSP (equal weight S&P-500 index) held up better than the SPY because large-cap tech stocks dominate the SPY.
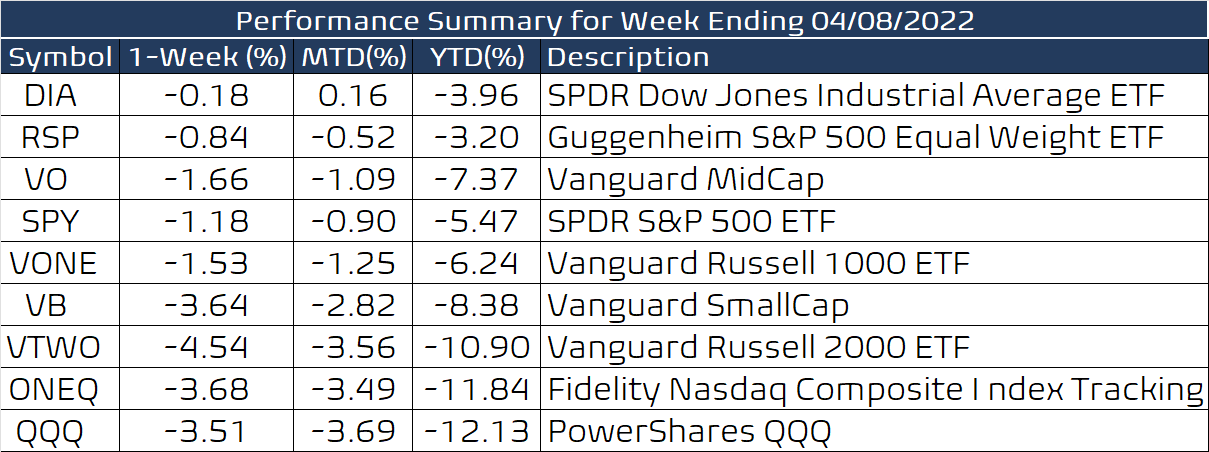
Our sensitive net bull/bear balance tipped towards bears, as the index performance in the above table suggests. However, the levels do not yet indicate the onset of major weakness.

We have observed the relative weakness in the small-cap space via the Vanguard Russell 2000 ETF (VTWO). As we have marked, we are still looking for a decisive break above 84. The breakdown in VTWO implies weakness in the broader market, though it is well within its broader consolidation.

Consumer Staples Sector Strengthens
We scanned the major sectors in the S&P-500 index to find that only four had Chande Trend Meter (CTM) values greater than 80. We identified the breakout in XLE at the beginning of January, and it has held up well. We pointed to Utilities last week. Today we will run a detailed scan for the XLP or Consumer Staples sectors.

We illustrate the forces of sector rotation within the S&P-500 index using the relative CTM ranks for the XLE (Energy), XLU (Utilities), and XLP (Consumer Staples) ETFs. (The ranks are rescaled so that the highest CTM value each week is 100.) The XLE came into the new year with the highest relative CTM rank and has only started to weaken a bit recently. Utilities have been strong for the past few weeks. The white line for XLP has climbed above the XLE line, showing that it is rising towards the top of the relative CTM sector ranks.

Here are the top trending stocks within the XLP universe. As you should expect, there are household names. We showed the chart for WMT at the top of this post.

Hershey is the top stock on the list, and the chart below shows a steady uptrend.

Other retailers such as Costco (COST) have also rallied in tandem with Walmart.

Wrap-up
My posts should give you a good starting point, with context and suggestions if you like to research. Then, you can visit my website, chandeindicators.com, for more information and ideas. I hope you stay tuned and help by subscribing and recommending it to your friends and colleagues.
Thank you for spending some time with me.
Disclaimer
And now for some housekeeping. This publication is for “edutainment,” education, information, and entertainment purposes only. It is not to be construed as investment advice. Past performance is not necessarily indicative of future results. Our disclaimer at chandeindicators.com is included herein by reference.