

Fast Train on Platform #5
Fast Train on Platform #5
We examine country ETFs, focus on India, and scan BSE listings

Overview
We review country-focused ETFs in general, with a focus on India and scan for stocks on the BSE.
There was strong selling this week, and plenty of churning at the sector-level.
Market seems focused on rising COVID-19 cases and fluctuating interest rates.
Home Depot is breaking higher out of a long base.
End-of quarter re-balancing of institutional portfolios may affect trading next week.
Key Question
The bull market that began in March 2020 is a year old. Year Two returns tend to under perform Year One returns (see CNBC story here). As the market searches for new leadership, where will the S&P 500 be at the end of the year?
Performance Snapshot
Markets rebounded after making key lows on Thursday. The small caps bore the brunt of the selling this week (see Trend Spectrum discussion below).
Trend Spectrum: Strong Selling This Week
We use iShares US-Equity ETFs to look at the selling this week. These ETFs represent virtually all the major sectors within the US market. We looked at the trend status in five time periods, from very short-term to long-term and categorized the trends as long, short, or neutral. After the close on Thursday, 03/25/21, the trend spectrum was a line from lower-left to upper-right. At the very short-term, nearly 83% were trending lower, and the rest were neutral, a sure sign of heavy selling. The selling dragged down the number trending lower across the time intervals. At the very long-term end, all the sectors were trending higher. Thus, the picture is one of churning at the sector- level within a long-term uptrend.

The Direxion 3x Small Cap Bull leveraged ETF (TNA) shows perfectly how the market traded. TNA sold right into support and then bounced. Naturally, the question is whether the bounce can last. It might for at least a few days, as portfolio rebalancing at the end of the first quarter brings a bid to stocks.

Trend Direction from Leveraged ETFs
We saw yet another whipsaw this week, as the bear ETFs rallied the first part of the week, only to be eclipsed by the bulls on Thursday and Friday.

We look at eight bullish leveraged ETFs, and eight bearish or inverse ETFs, in a group of 34 total ETFs to gauge market direction. In either case, the lines rise when they are strong, and fall when they are weak. When markets are rising, the bullish ETFs rise. Conversely, when markets are falling, the bearish ETFs rise. In this group, the strongest performance gets a score of 100, the weakest performer gets a score of 0. So, when trends are strong, whether up or down, that group of ETFs gets high scores, and their average score will rise above 75. Conversely, when a group is weak, their average score will drop below 25.
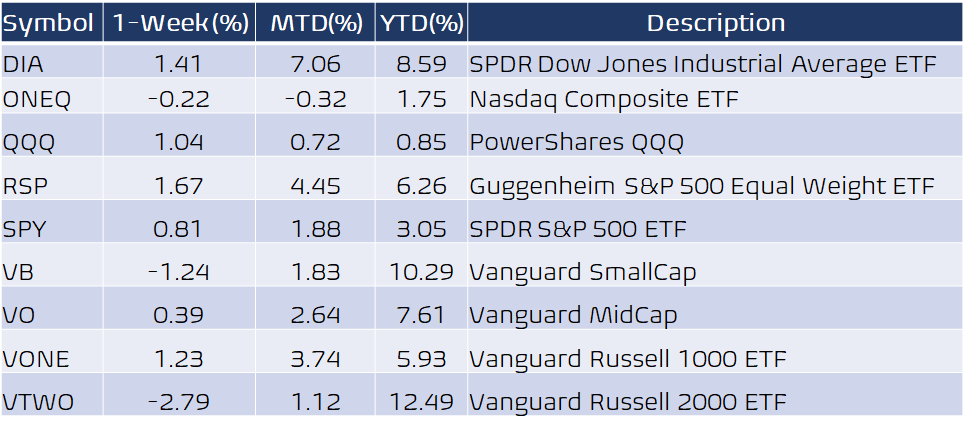
Market Cap Trends: Mega Cap Value (MGV) Soars
The Vanguard market capitalization weighted ETFs showed a key improvement: the Mega Cap Value (MGV) was the ETF with the strongest trend strength. MGV held up well during the sell-off and rallied strongly Thursday and Friday. Value ETFs are still stronger than growth ETFs as shown below.
Key to symbols: IVOG (MidCap 400 Growth ETF), IVOO (MidCap 400 ETF), IVOV (MidCap 400 Value ETF), MGC (MegaCap ETF), MGK (MegaCap Growth ETF), MGV (MegaCap Value ETF), VIOG (Small Cap Growth ETF), VIOO (Small Cap ETF), VIOV (Small Cap Value ETF), VOO (S&P 500 ETF), VOOG (S&P 500 Growth ETF), VOOV (S&P 500 Value ETF)
We show a chart of MGV as it powered to a new high. Both of our long term oscillators are above 75, confirming the breakout.

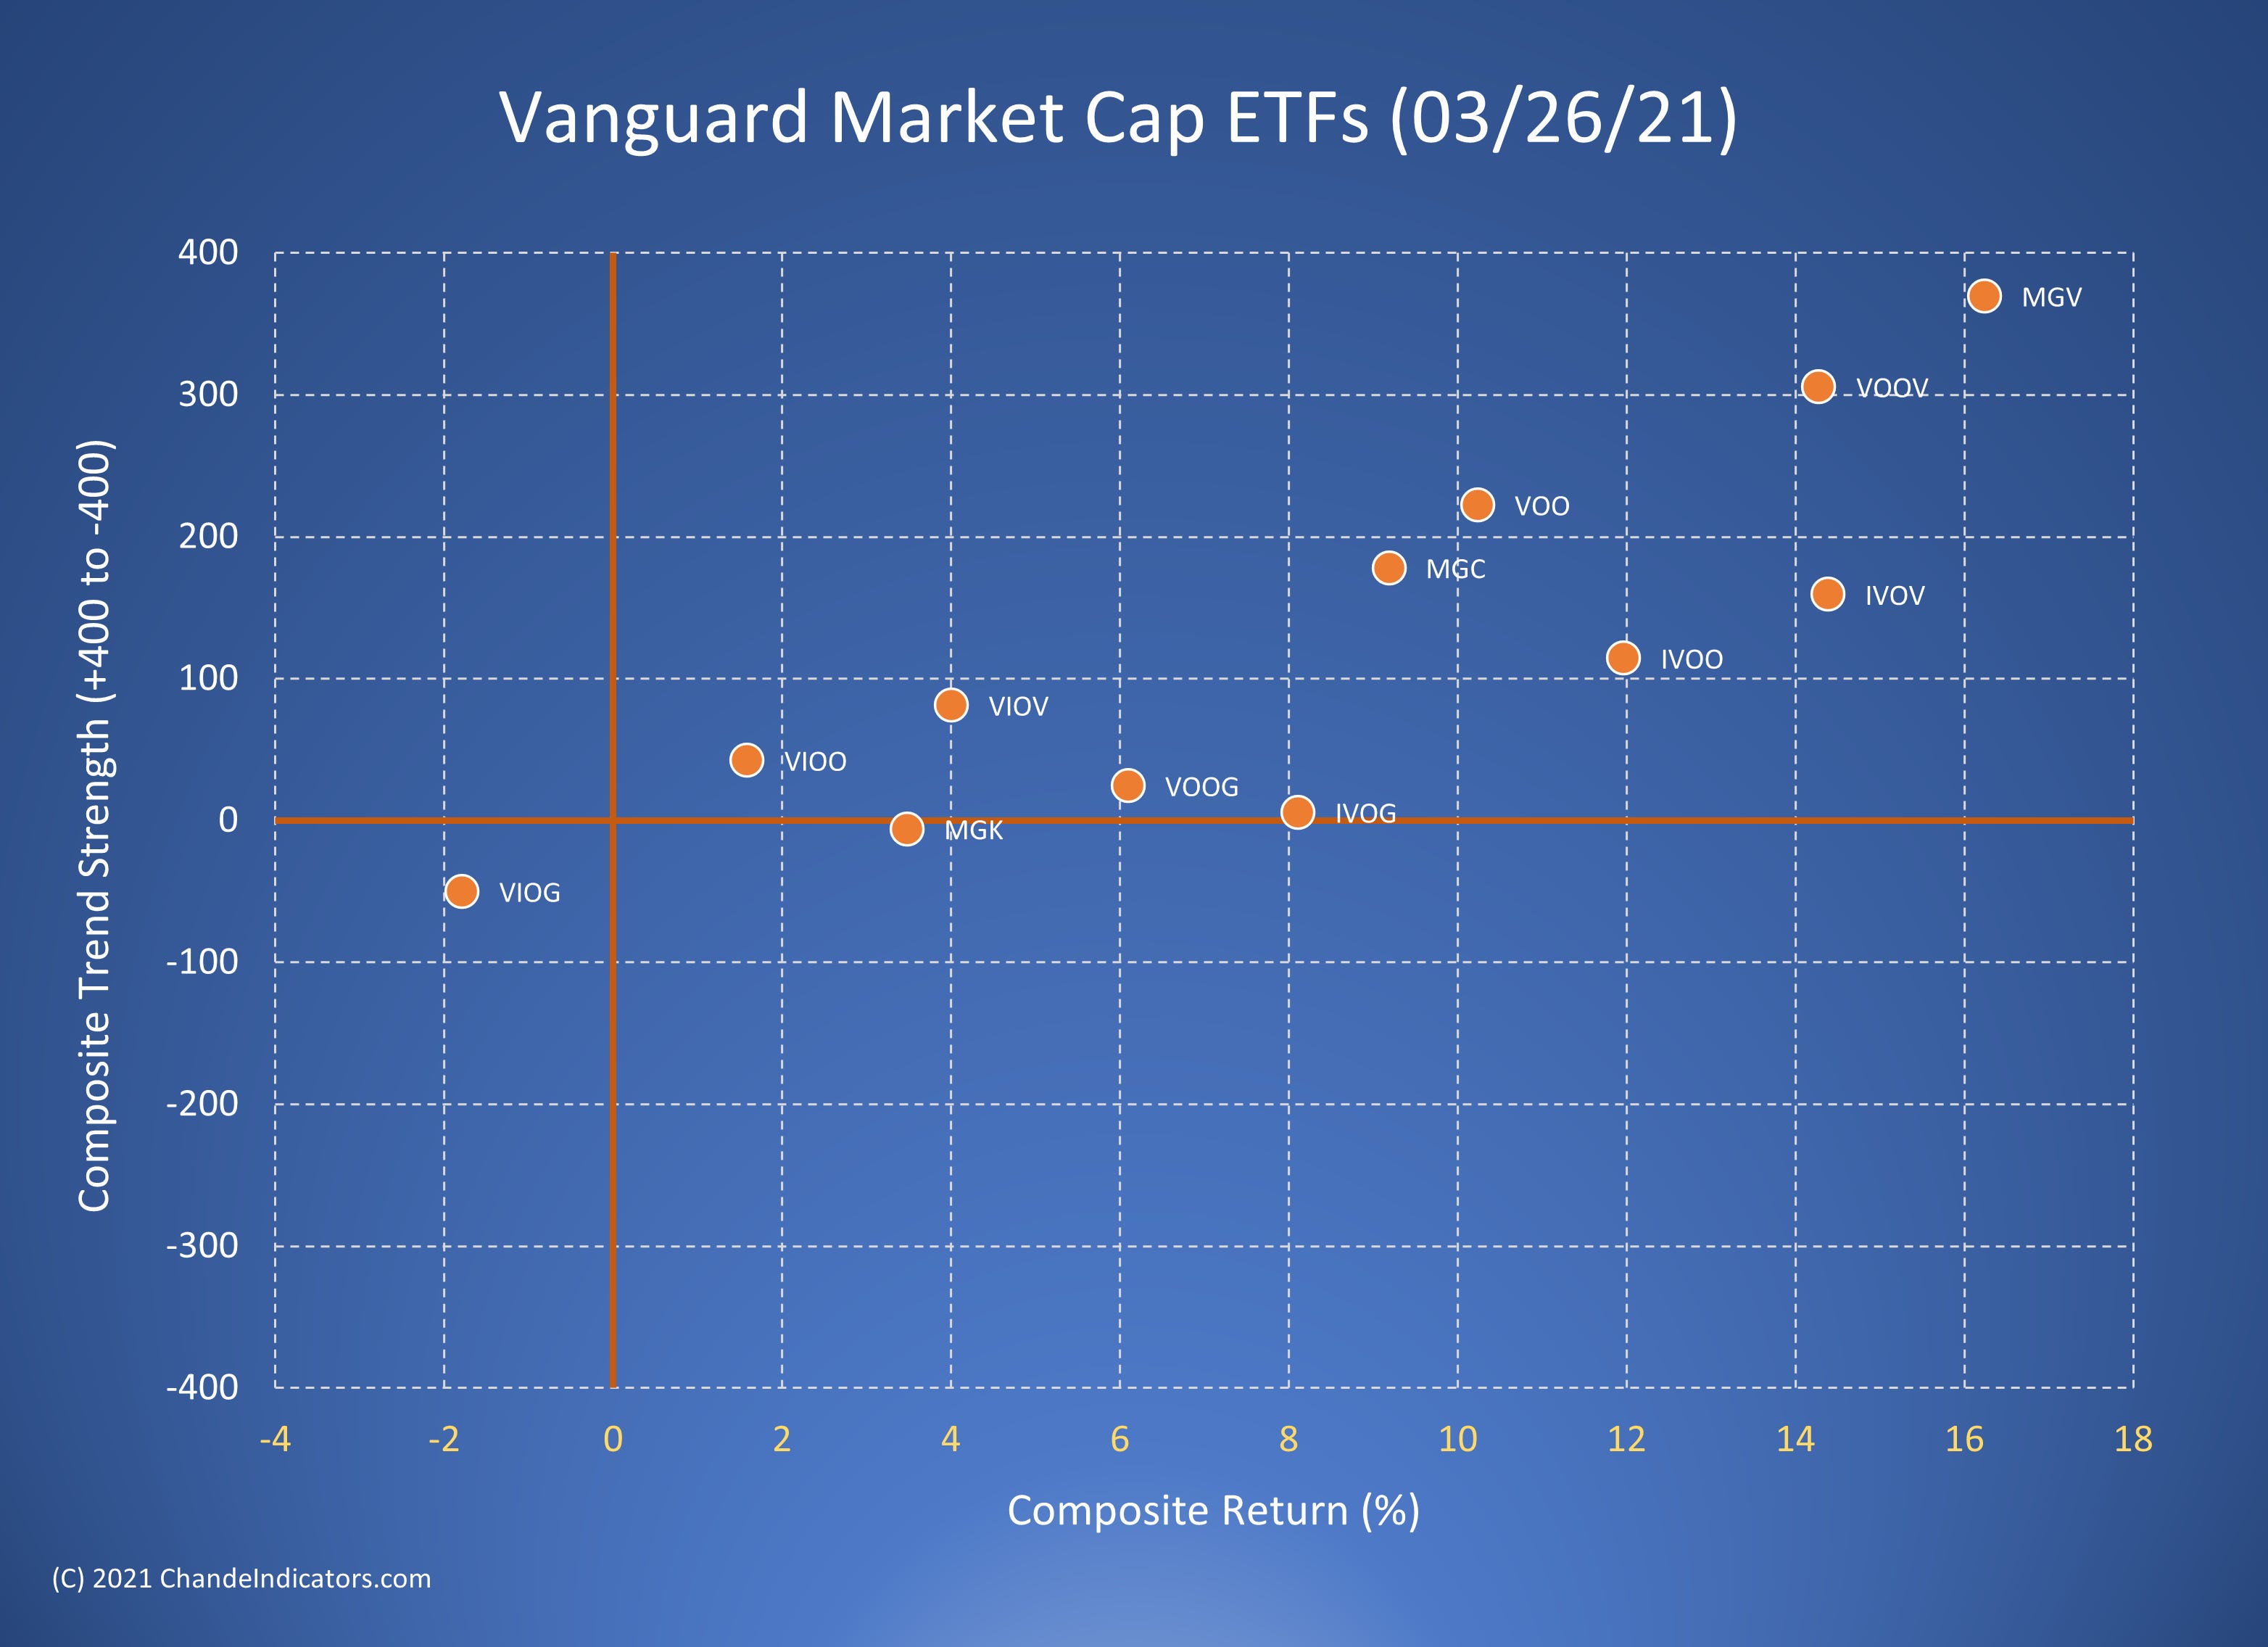
Country ETFs
The US equity markets tend to blaze the path for foreign markets as well, more so since 2008. The only difference seems to be beta, the multiplier estimating, on average, a foreign market’s potential move for each percentage move in US benchmarks. So, it’s hard to find an uncorrelated foreign markets. Nevertheless, we examined the major country focused ETFs, and found most of them to be in technical consolidations. Japan (via DXJ - WisdomTree Japan Hedged Equity Fund), India (via EPI - WisdomTree India Earnings Fund) and Singapore (via EWS - iShares MSCI Singapore ETF) are standouts at the moment.
Fast Train on Platform #5
You are probably wondering what trains have to do with stocks. Well, we all learned to jump off and climb onto moving trains. Buying or selling a stock is like jumping onto or off a train that is moving, with the possible exception that the ultimate destination is unknown. Like a train, it takes a lot of energy to overcome frictions and get a stock to start moving, but once it is trending, it will keep on rolling, with or without you. My research is directed towards finding stocks that are moving, i.e., have a life of their own. So, take a hard look, do your own research, and hop aboard, if you like the destination.
One of my indelible memories of Mumbai is listening to the bored overhead announcer as we traversed the amazing train network in Mumbai. The larger junctions had assigned platform #5 to fast trains, (that skipped the smaller stations, much to my relief), and the static-laden, mechanical voice announcing “Platform number paanch per aane wali gaadi tez gaadi hogi” sounded like God lifting an obstacle from my path.
We use the iShares MSCI India ETF (INDA) to set the big picture. This ETF has also been trading in a shallow, up-trending channel, like the SPY chart further below. The two proprietary oscillators plotted below show the long-term (orange line) and short-term (black line) as measures of trend strength. Prices are testing the lower boundary of the price channel, and so the short-term trend is at -100 (strong down trend) and the long-term orange line is in the neutral zone, near -25. The assumption I will make is that the prices will continue to trade within the channel, until they break out decisively.

MetaStock has a fantastic engine and data feed for scanning stocks and ETFs from all over the world. I applied it to the India’s BSE (Bombay Stock Exchange) universe, and the stocks that stood out were Hindustan Organic Chemicals (HOCL), JCT Limited (JCTL), Mysore Paper (MPAP), Odyssey Tech (ODTH), and Sumeet Industries (SUIN). I have not actively screened for trading volume, so some of these may be thinly traded. Nevertheless, it shows the power of technical analysis, in terms of narrowing the list you have to focus on.

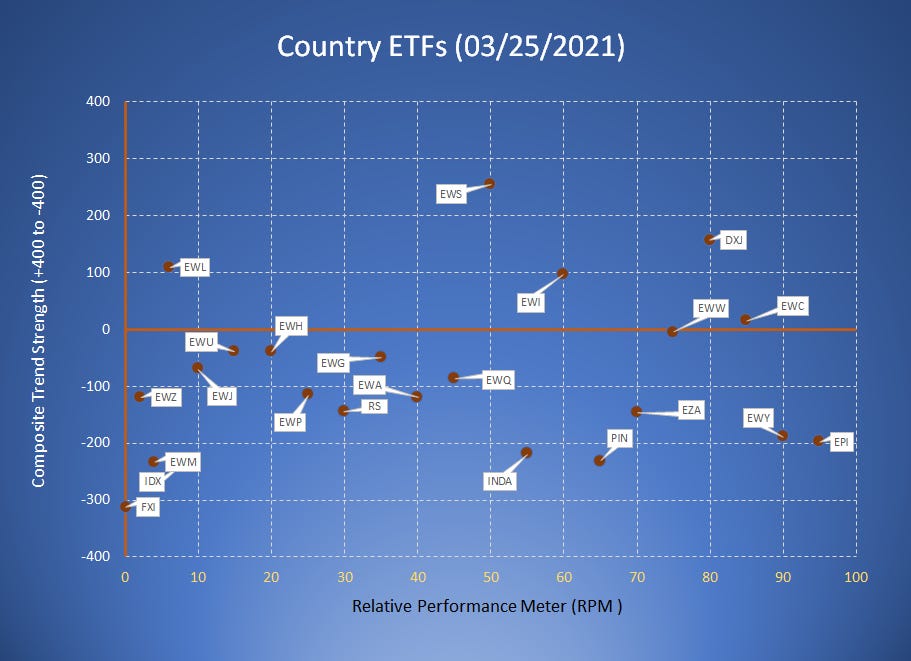
The Home Depot Breakout
Home Depot (HD) rose out of a long consolidation. It rallied strongly in a week when market sentiment was negative, making it worthy of further attention. The breakout has carried both my long-term trend strength oscillators above 80, which implies a strong trend. In the past, sustainable trends have borne this signature. Observe the long parade of yellow bars during the consolidation, and the brief breakouts beyond the channel which were not confirmed by the long-term oscillators.
Key Question: S&P-500 Year End Forecast Range

We observed that the SPY has been trading within a shallow, uptrend channel. We used linear-regression analysis to define that channel (see red lines above), using 30 days of data as of Thursday’s close. We next extended the lines through the end of the year. The year-end range is between 392 and 418, so that from here, we would be approximately flat to up about 8% through year end. Naturally, there is no guarantee that the S&P-500 will achieve this year-end target or target range. The market is perfectly capable of dropping out of the projected price channel.
The CNBC Market Strategist Survey projects a year end S&P-500 target of 4099, or around 410 on the SPY, which is a bit above the midpoint of my projected range. The equivalent range of possible outcomes varies from approximately 380-440 on the SPY. CNBC had a nice review of the past year, and what to expect from here.
Wrap-up
If you like to do your own research, my posts should give you a good starting point, with context and suggestions. You can visit my website, chandeindicators.com, for more information and ideas. I hope you will stay tuned, and also help, by subscribing, and recommending it to your friends and colleagues.
Thank you for spending some time with me.
Disclaimer
And now for some housekeeping. This publication is for “edutainment”, education, information, and entertainment purposes only. It is not to be construed as investment advice. Past performance is not necessarily indicative of future results. Our disclaimer at chandeindicators.com is included herein by reference.