


Expect Positive Returns in April
(No, this is not an April Fool's joke.)

Overview
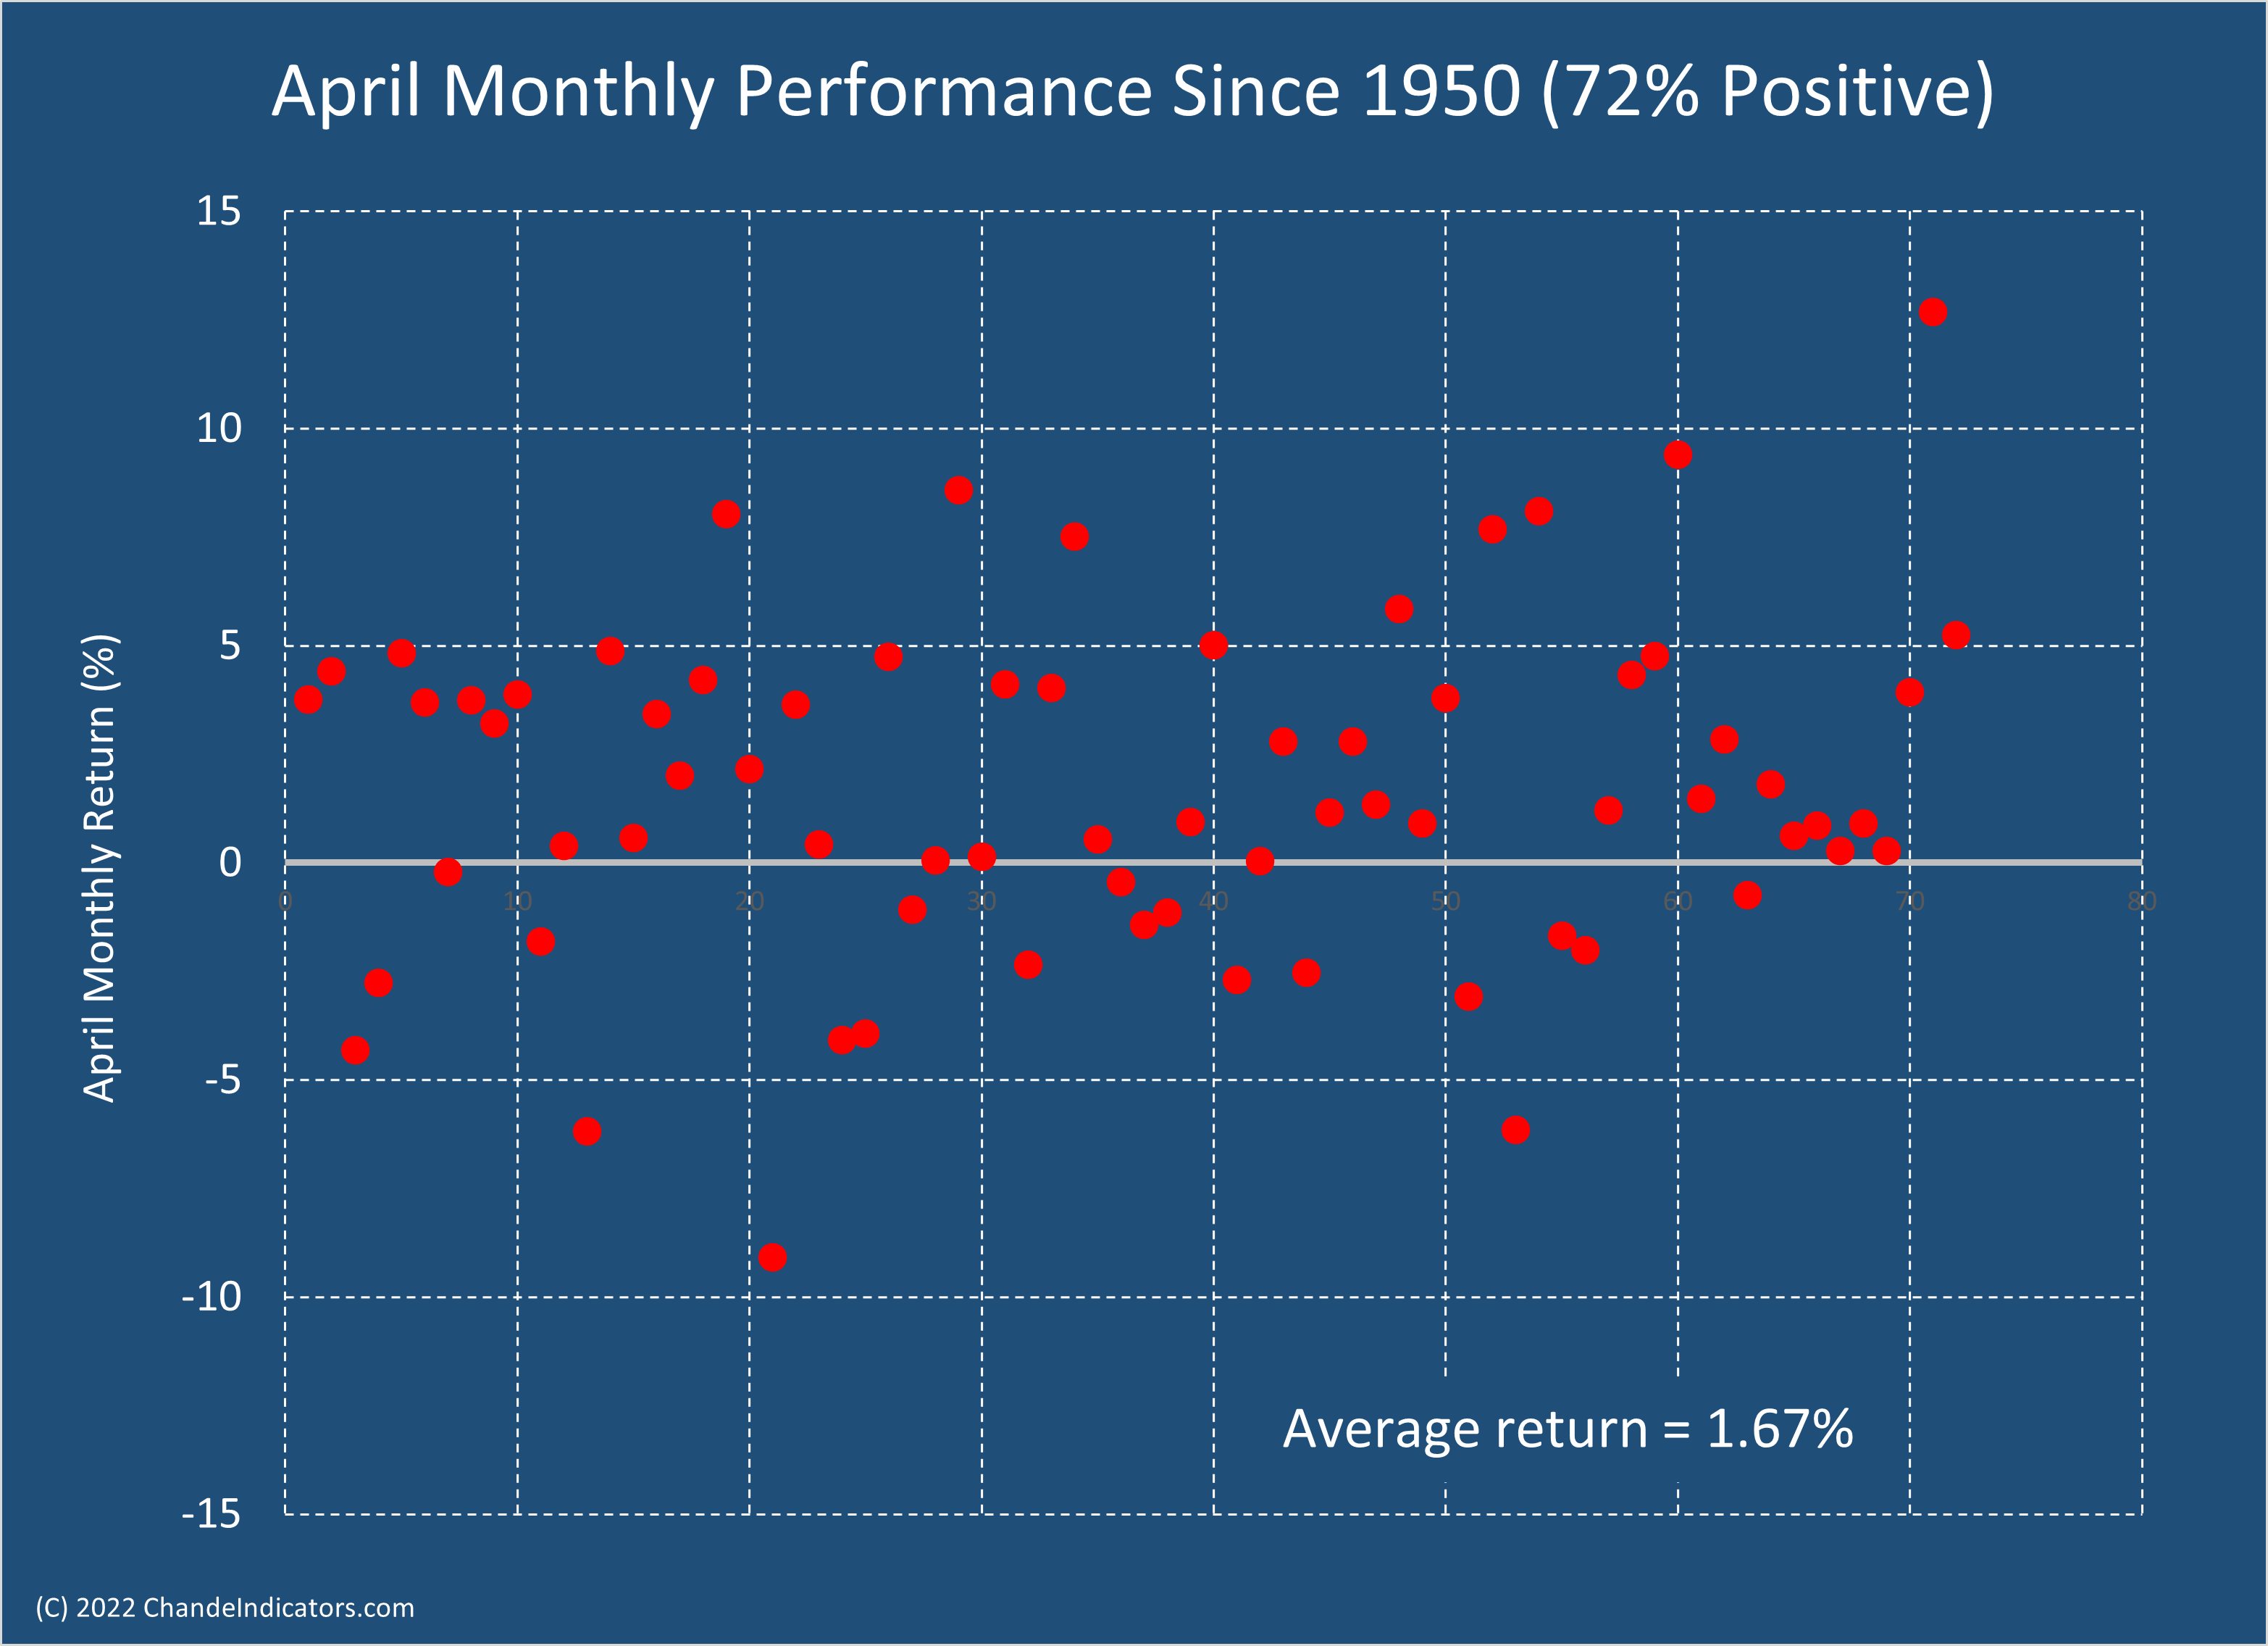
April, historically since 1950, has been positive about 72% of the time, and the average return is 1.67 percent, which makes it among the most consistently profitable months.
The economy continued to create jobs in March (+431,000 estimated), with upward revisions to the estimates for January and February.
This week, the bond market inverted, i.e., shorter-term rates rose above longer-term rates. This “guarantees” a recession in the next two years (yawn!), but this time, there are too many moving parts for such a simple indicator.
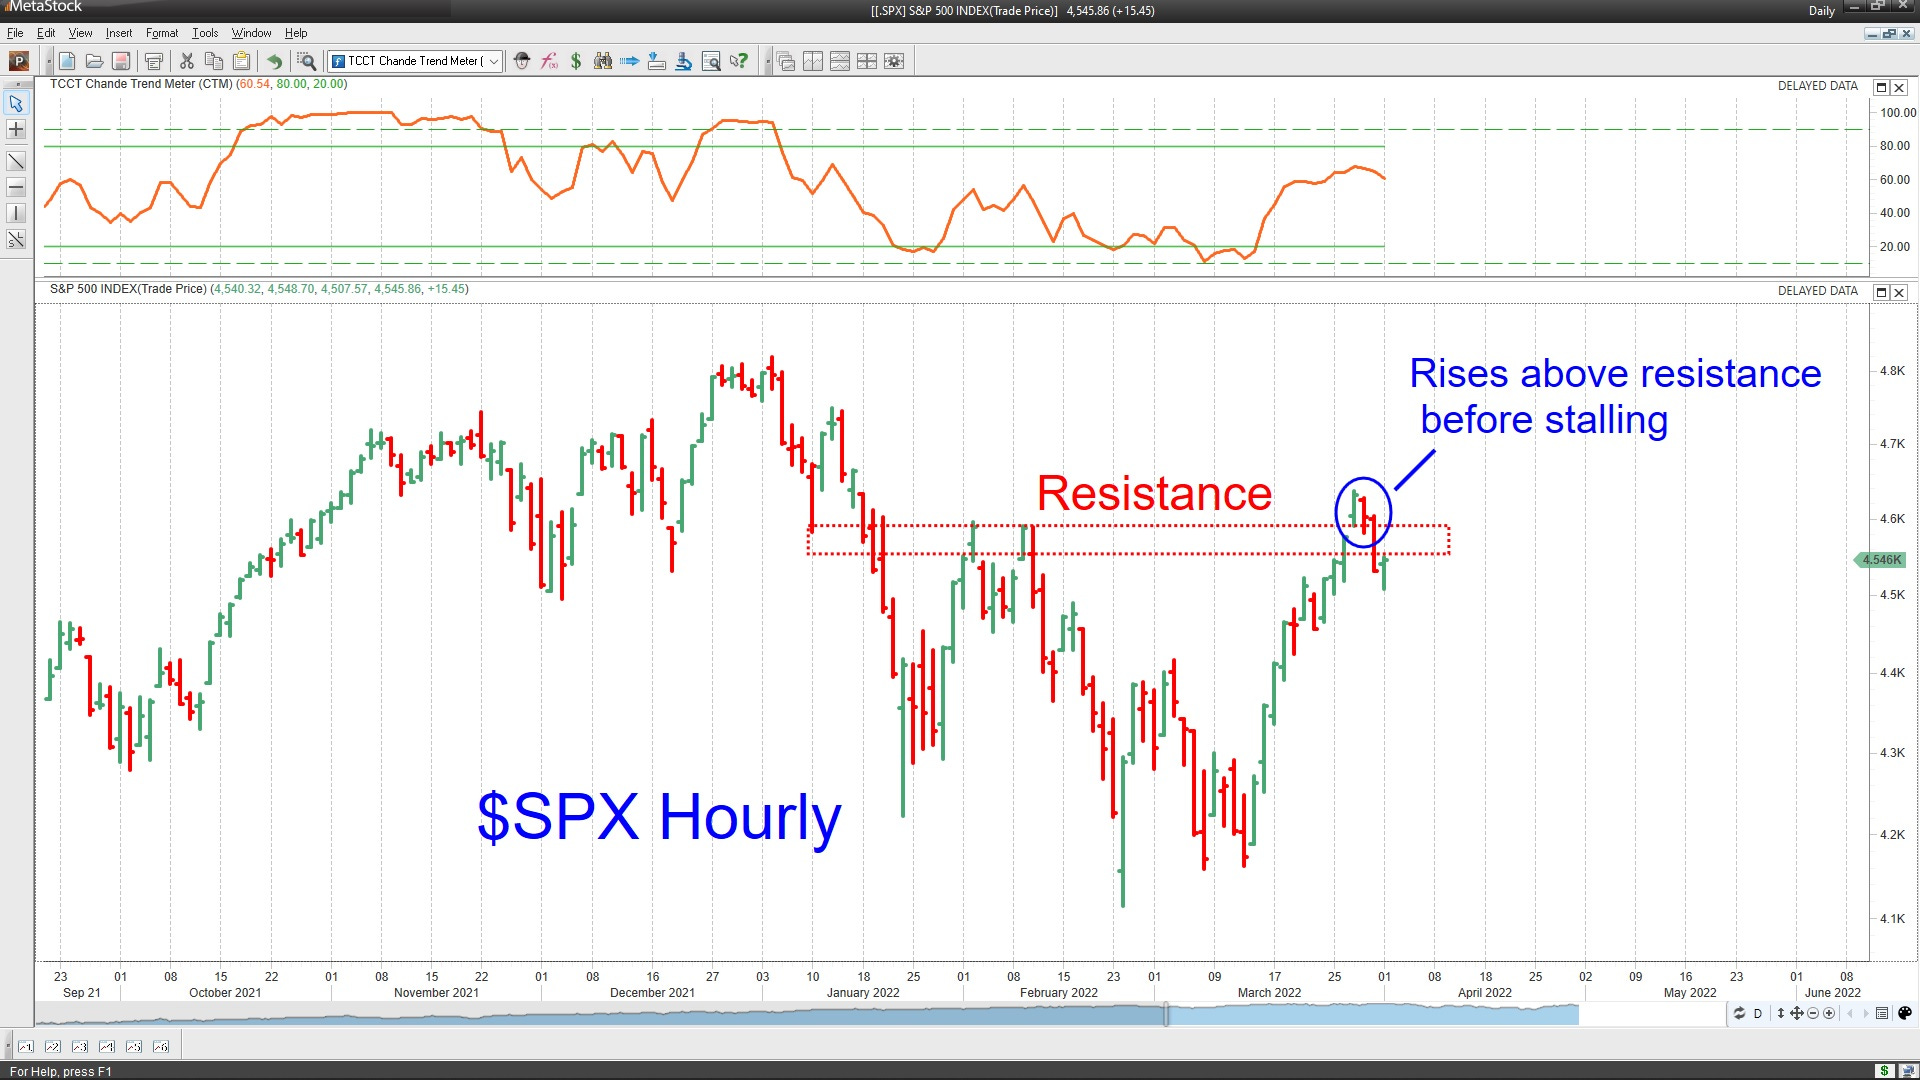
The rally in the S&P-500 index rose to just above the resistance zone we marked three weeks ago and pulled back a bit.
The broader Russell 2000 universe broke out above key resistance but has yet to follow through with conviction.
Key Question
This week, utilities powered up, and many utility stocks have had a strong run. So what are some of the stand-out stocks in this sector?
Performance Summary
The week was flat-to-down for the major index performance, but the rally reached out to the small-cap stocks. The technology stocks also continued their rally, led by mega-caps such as Apple, and hence the QQQ did well.

The S&P-500 index rose above the resistance we marked three weeks ago before stalling and ending essentially unchanged for the week. So the little pullback is to be expected. The institutions are still wondering whether this is the low for the year (but we are not), even as they grapple with the fears of rising rates and complications from the Ukraine war (higher commodity prices and black-swan events).
The break in the screaming uptrends in Wheat and Crude Oil (that we identified during the week of Mar 11th) has been an important insight since that marked the bottoming process for equities. Note below how neither of them has resumed their uptrends after dropping through their volatility-based trailing stop, illustrating the value of these stops.
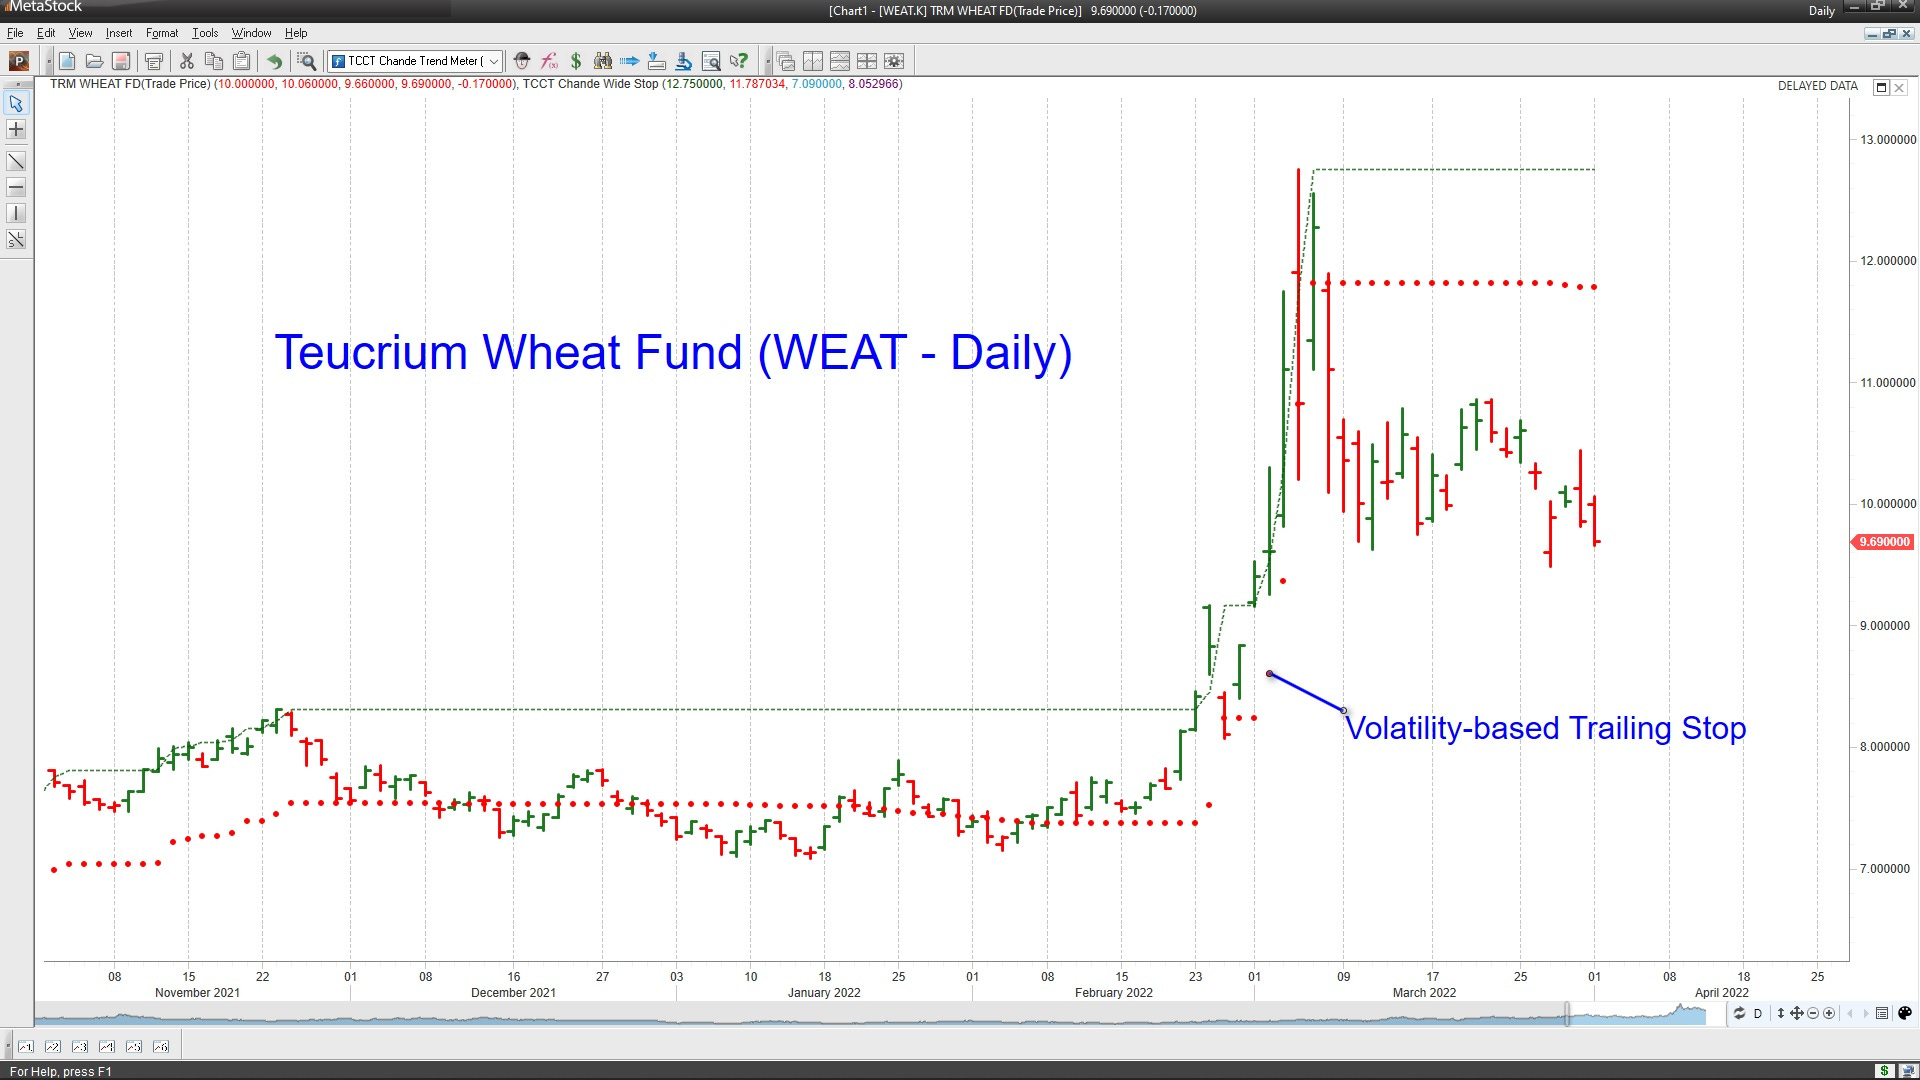
Oil bounced a bit, but as is often the case after a price spike, this is just a weak retest of the prior highs (or, at least, let us hope so for now).

For those who point to cryptocurrencies as a “store of value,” the chart below is scant comfort. Cryptocurrencies weakened well before equity prices, a sign of the risk-off period to come, followed them down into a double bottom and rally, which means they were correlated to equities. The rolling 20-day correlation exceeded +0.75 during this period. This is not what you want from a “store of value.”

Utilities Power Up
This is a broad sector, with sub-sectors such as electric, gas, and water utilities. The relative performance of this sector has been strong, as we can see below by comparing its composite performance to other key sectors in the S&P-500 index and key indexes. XLU, the Utilities Select Sector SPDR ETF, has been much stronger than all other sectors within the S&P-50 and even key market index ETFs (SPY, DIA, QQQ).

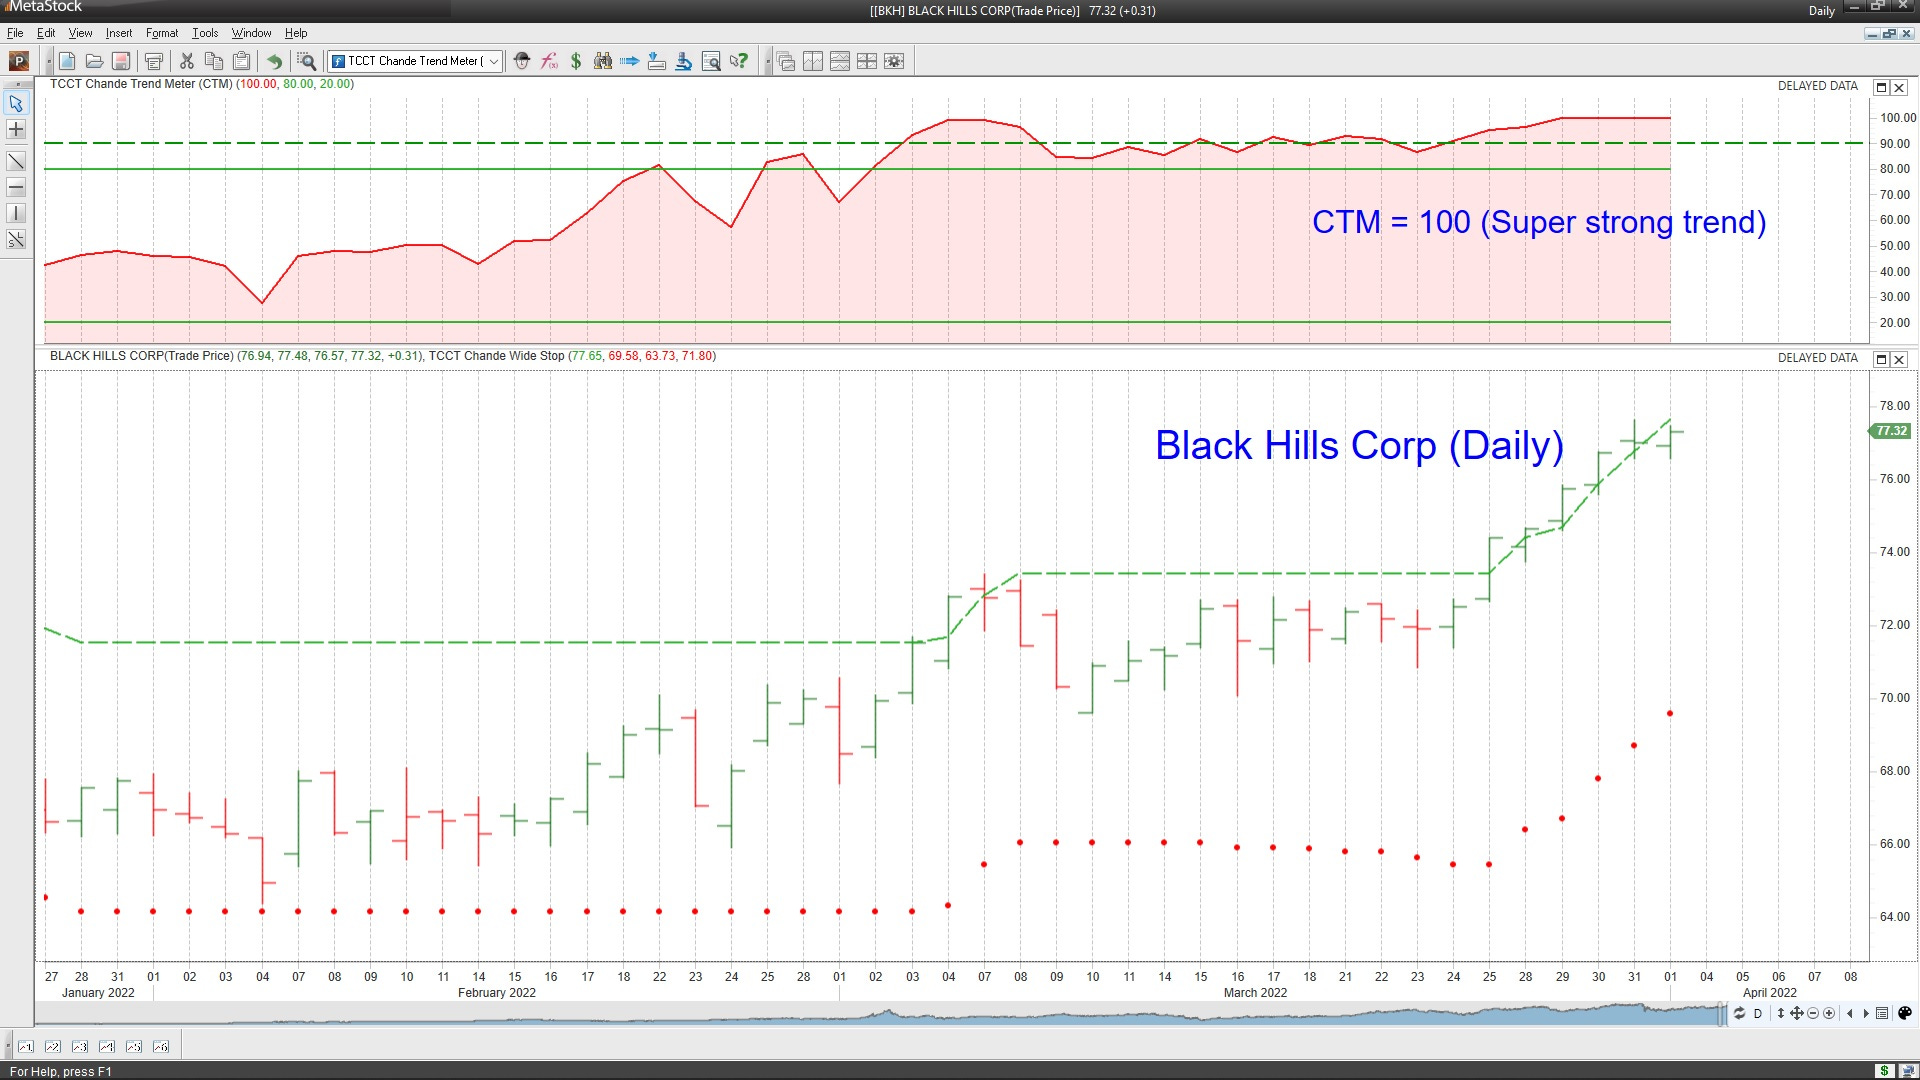
We used MetaStock to scan for trend strength in the sector using the Chande Trend Meter. For calibration purposes, 40/70 (~57%) had CTM values greater than 80, which means they were trending very strongly. Therefore, I have only shown the top 20 symbols below for clarity.
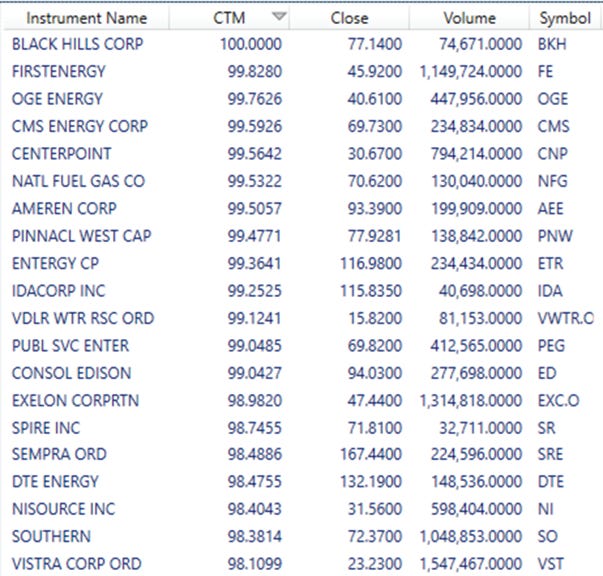
We illustrate the typical chart using the first name on the list, Black Hills Corp. The CTM has been above 80 since the breakout in early March, and the move this past week has been steady.
Trend-followers Delight
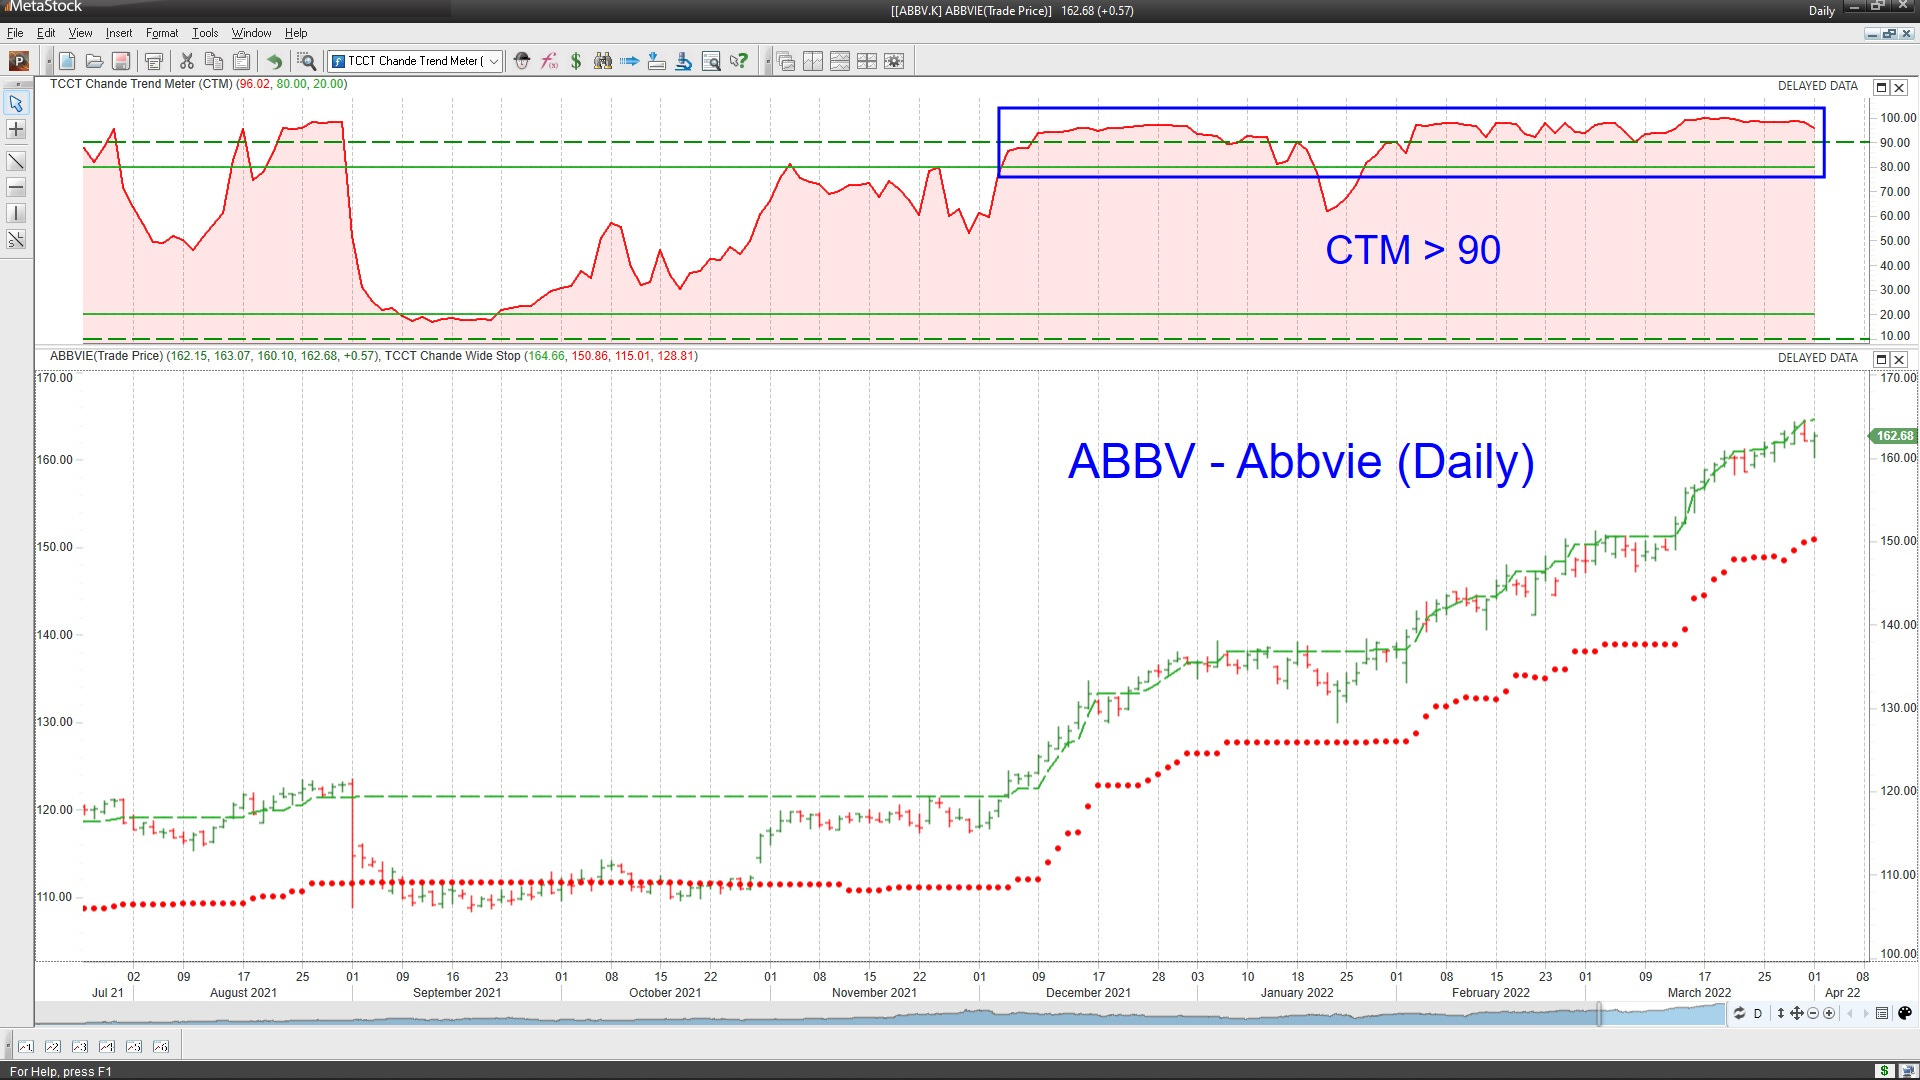
The Abbvie (ABBV) chart below shows the power of trend-following and the value of the CTM indicator. ABBV has been steaming steadily higher, with a few minor pullbacks that stayed above the volatility-based trailing stop (red dots on the chart). Observe how the CTM indicator has mostly stayed above 90 (upper green dashed line in the upper panel) for the uptrend. This is a trend-followers dream: once you discovered this trend in ABBV, you just had to climb onto the train and adjust the trailing stop as needed. A MetaStock explorer scan is the only tool you need to discover this (and hopefully other) trend-following opportunities.
Wrap-up
My posts should give you a good starting point, with context and suggestions if you like to research. Then, you can visit my website, chandeindicators.com, for more information and ideas. I hope you stay tuned and help by subscribing and recommending it to your friends and colleagues.
Thank you for spending some time with me.
Disclaimer
And now for some housekeeping. This publication is for “edutainment,” education, information, and entertainment purposes only. It is not to be construed as investment advice. Past performance is not necessarily indicative of future results. Our disclaimer at chandeindicators.com is included herein by reference.