


Conflict Enters A High-Risk Period
The invasion of Ukraine enters a critical 3-week period.

Overview
The war in Ukraine enters a critical 2~3 week period, with an increased risk of inflammatory events that could lead to a further escalation from all sides.
For now, “all” the bad news seems to be in the market. We know the contours of the sanctions regime, the plan for FOMC actions, and commodity markets have retreated from their recent peaks.
The broader Russell 2000 index continues its consolidation above a tentative double bottom.
US inflation data remain high as we go into the FOMC meeting next week when they are likely to initiate the move to higher interest rates. So this could be another source of volatility next week.
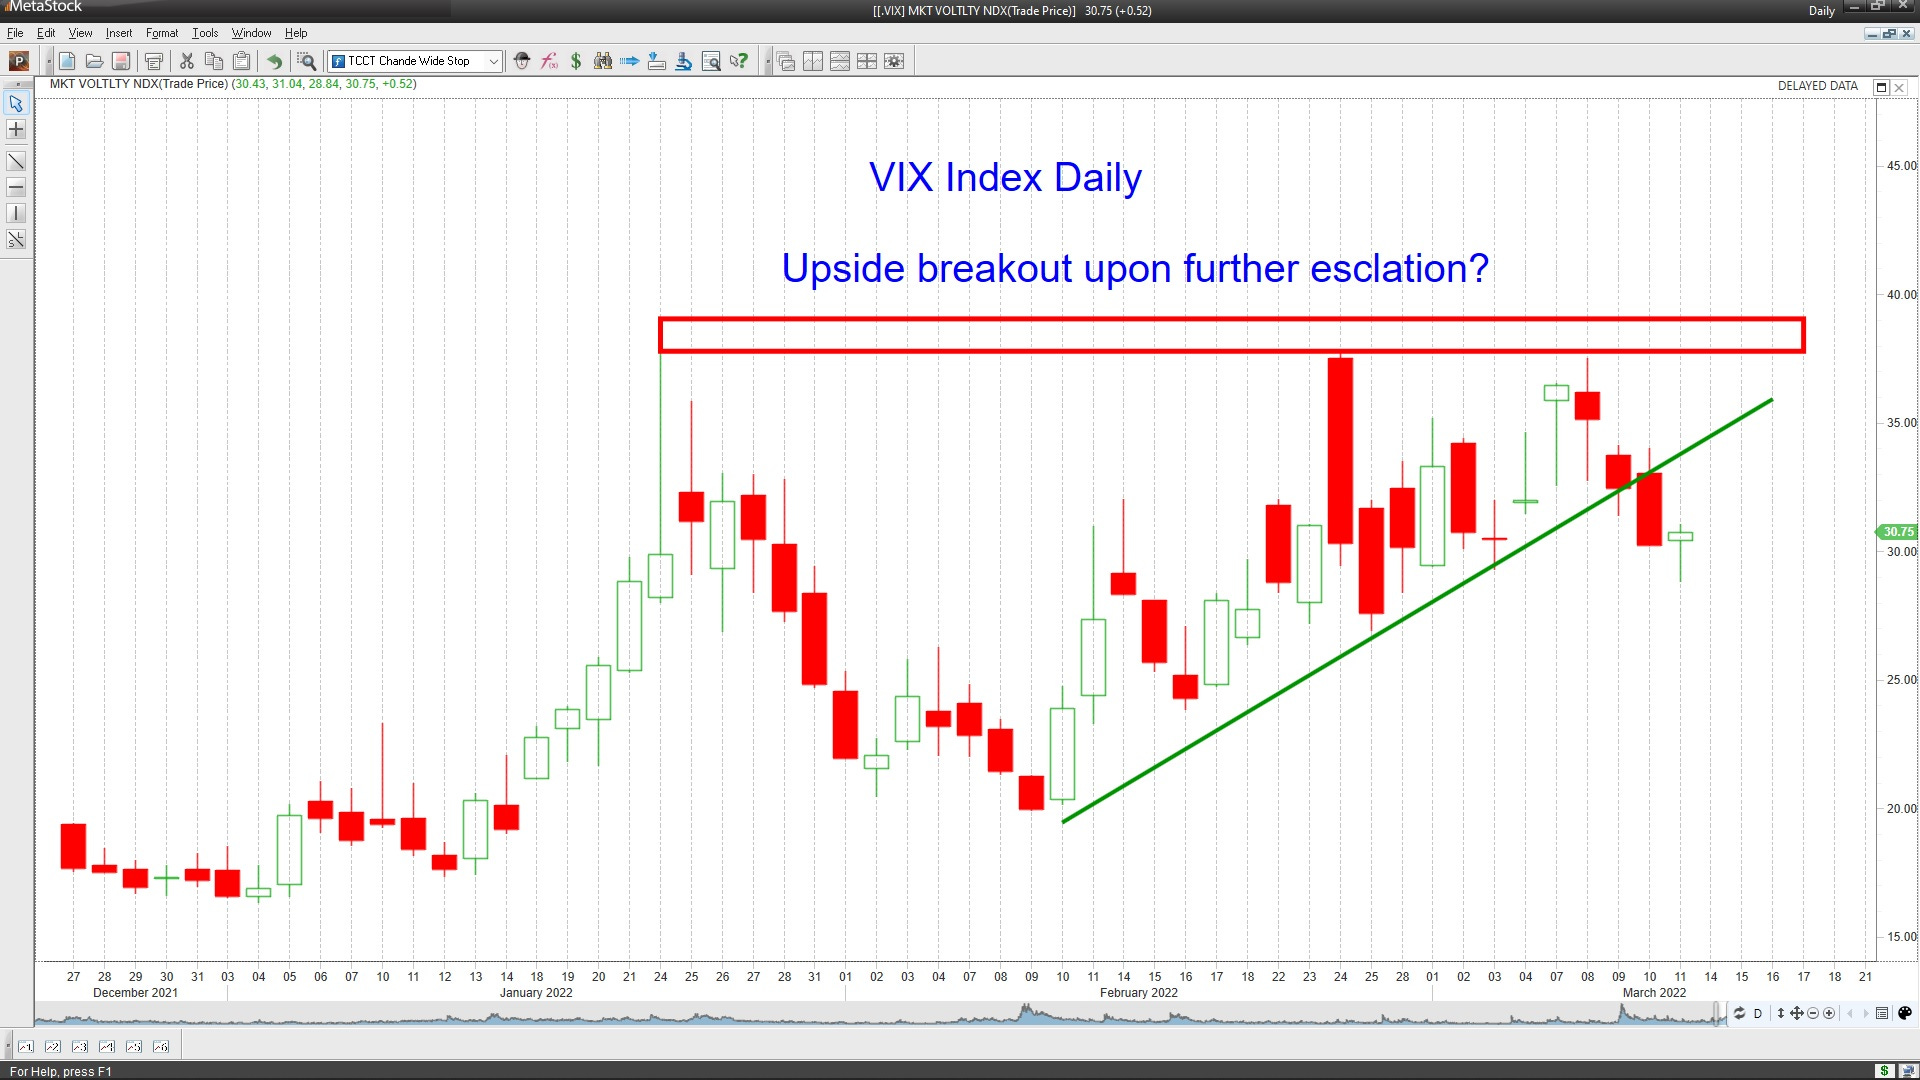
I will change the format this week since the market is now focused on the Ukraine invasion, and none of the usual metrics matter right now.
First, the energy markets eased as the scope and timing of the sanctions became clear. For example, Europe would cut its Russian energy imports more gradually than the United States.
Second, Wheat, the other key commodity most vulnerable to supply disruptions from Ukraine and Russia, also eased. The chart for the WEAT ETF below shows it also fell below a volatility-driven trailing stop, which usually indicates at least a short-term break in the uptrend.

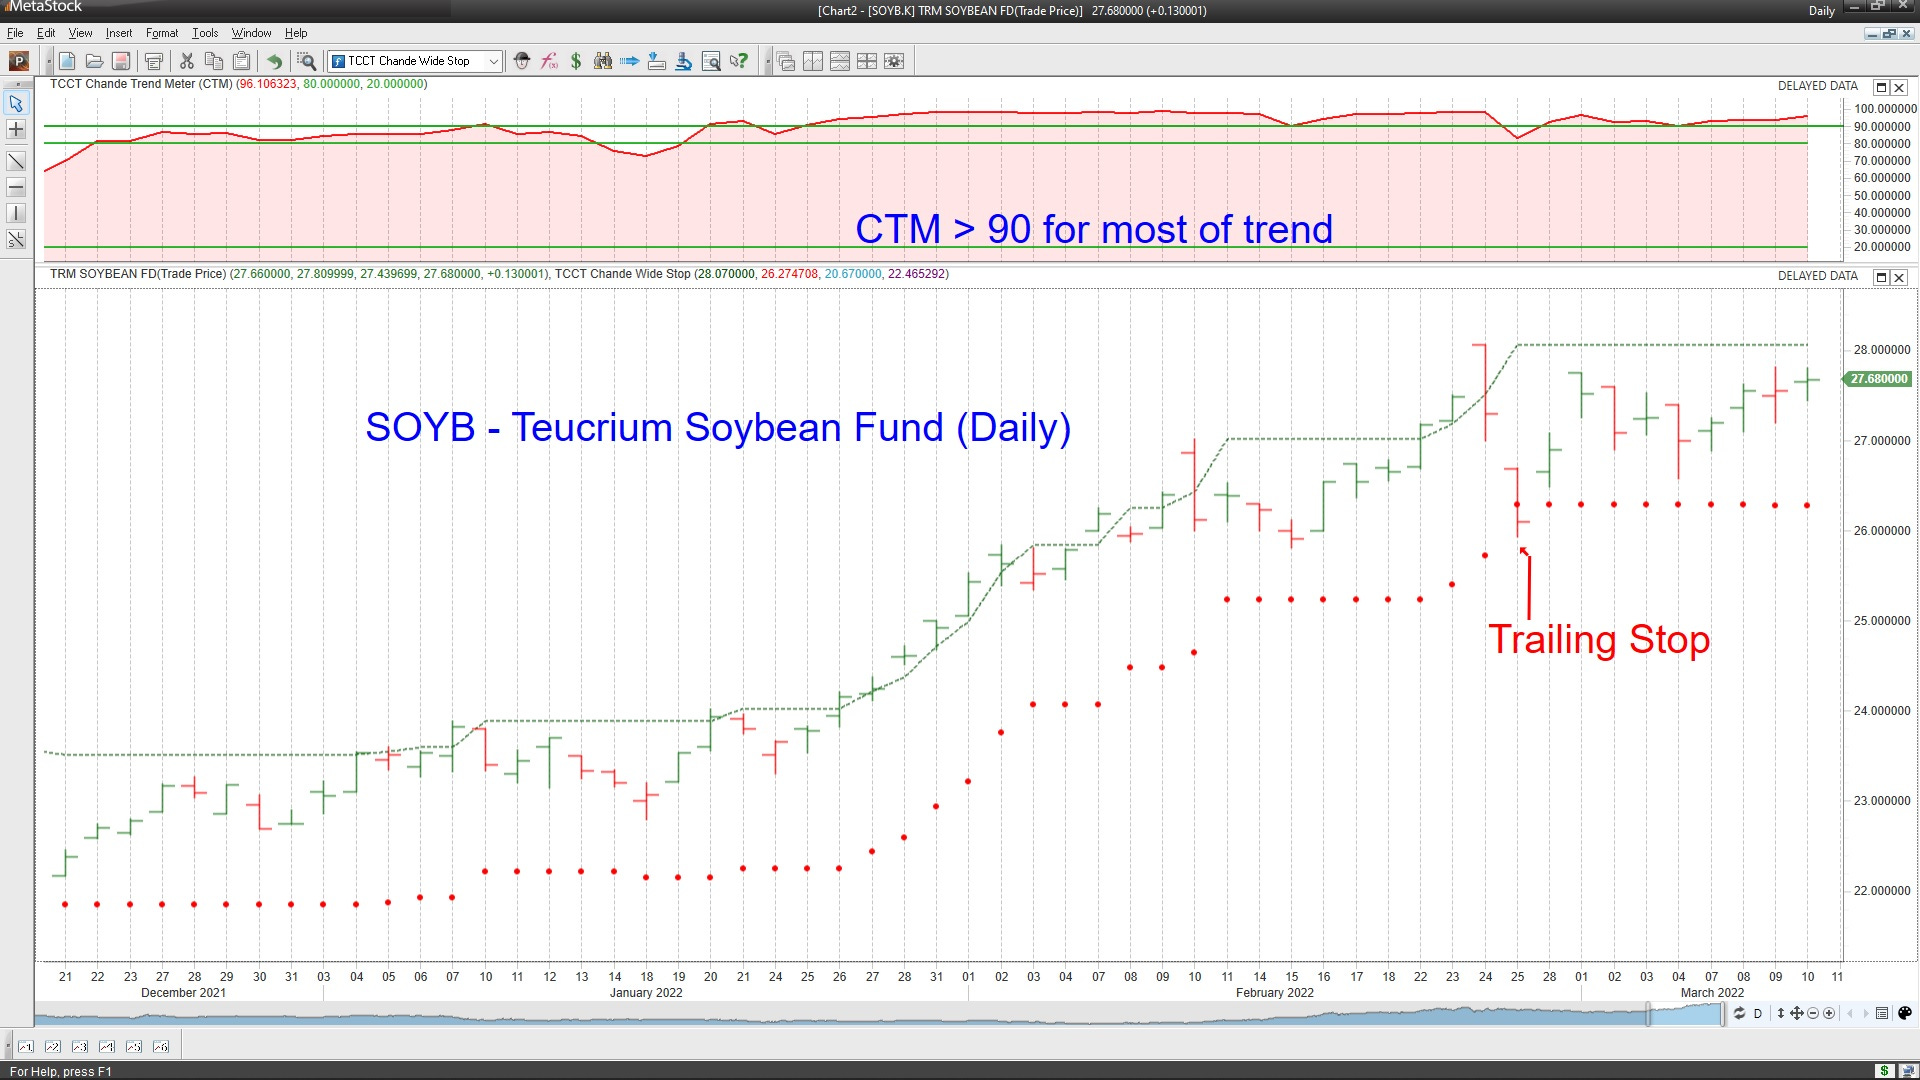
Third, Soybeans, which had rallied in sympathy with Wheat, also came off their recent highs. In other words, agricultural and energy markets have backed off their panicky uptrends.
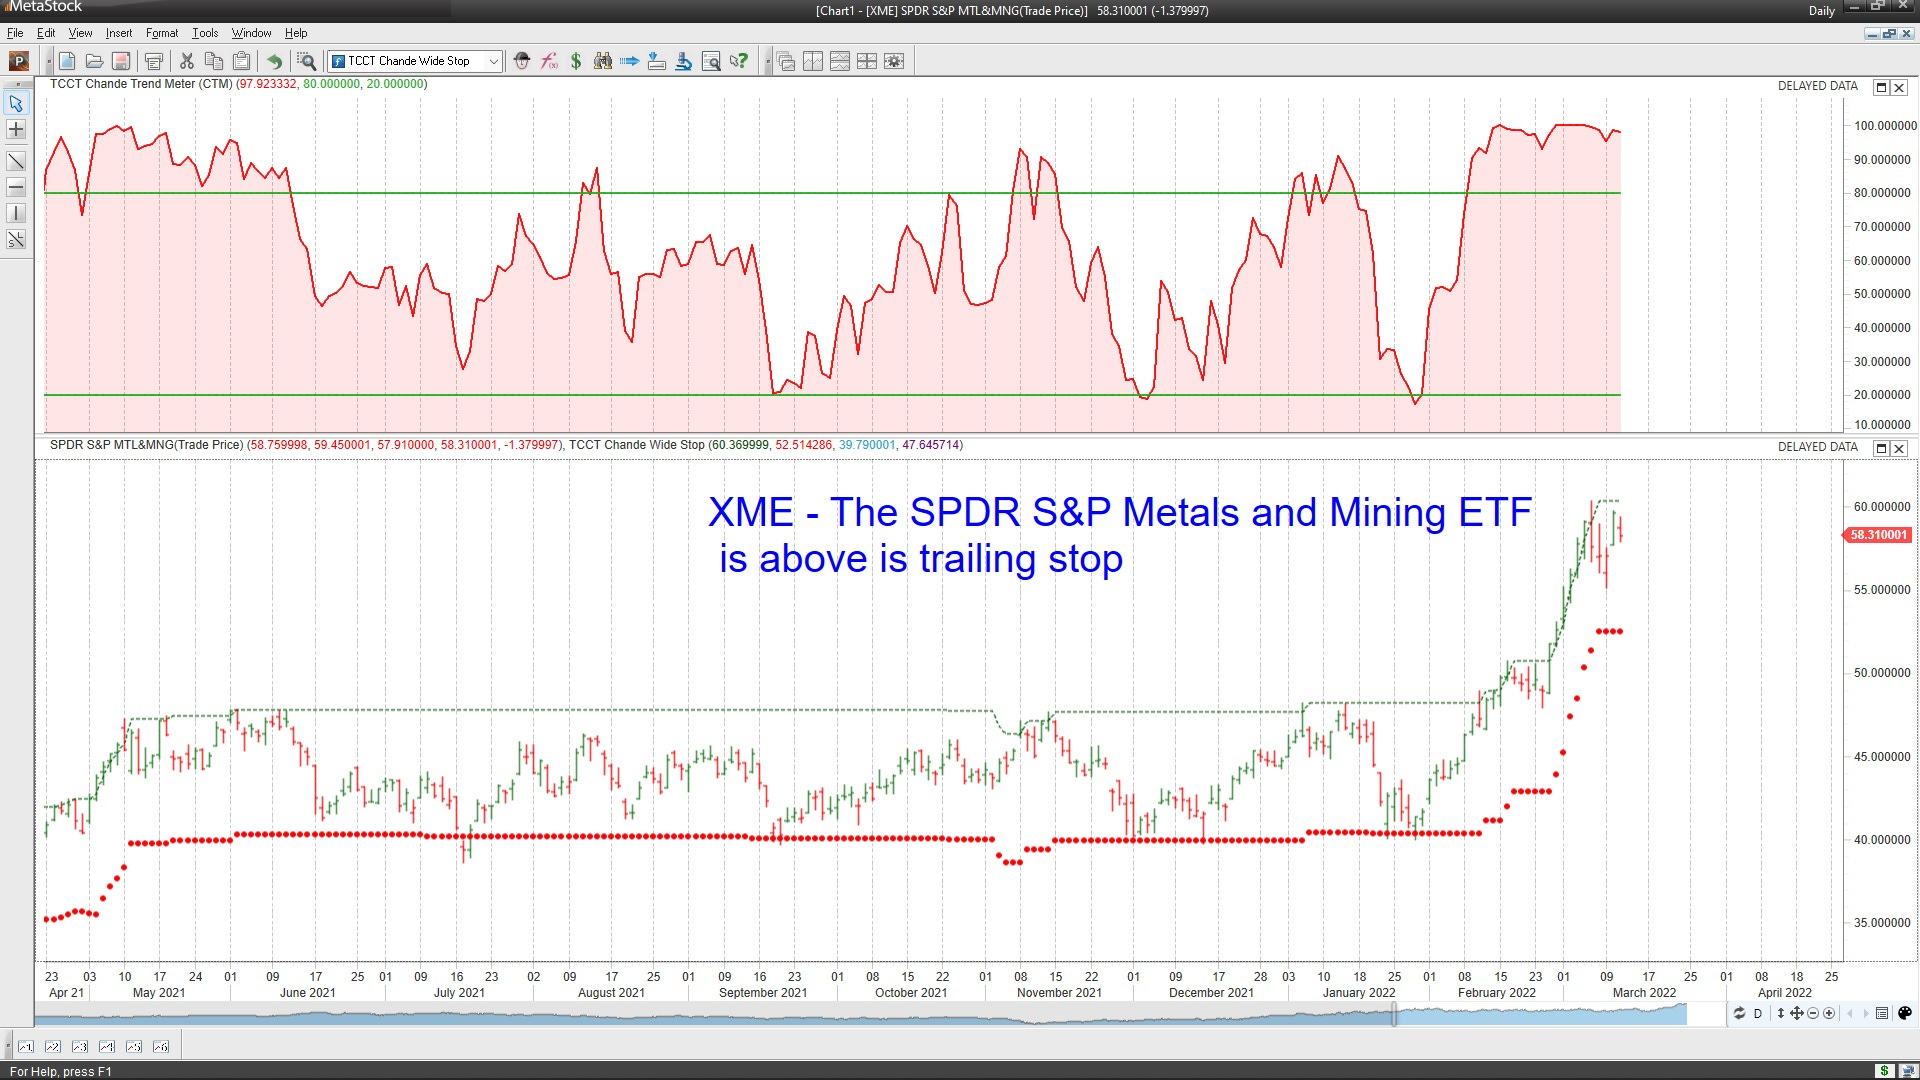
Naturally, the long-term trend could resume since it will take several months, perhaps more than a year, for the markets to find alternate suppliers. So, the break does not mean that prices cannot remain elevated (or go higher) for the next year. For example, the XME and XLE ETFs are still trading near their recent highs.
The broader equity market remains locked in a downtrend and is consolidating above recent lows. (We have used this chart in the past several posts.) The broader index has traded sideways in a broad range, and until we get at least a cease-fire arrangement in Ukraine, rallies will be short-lived.

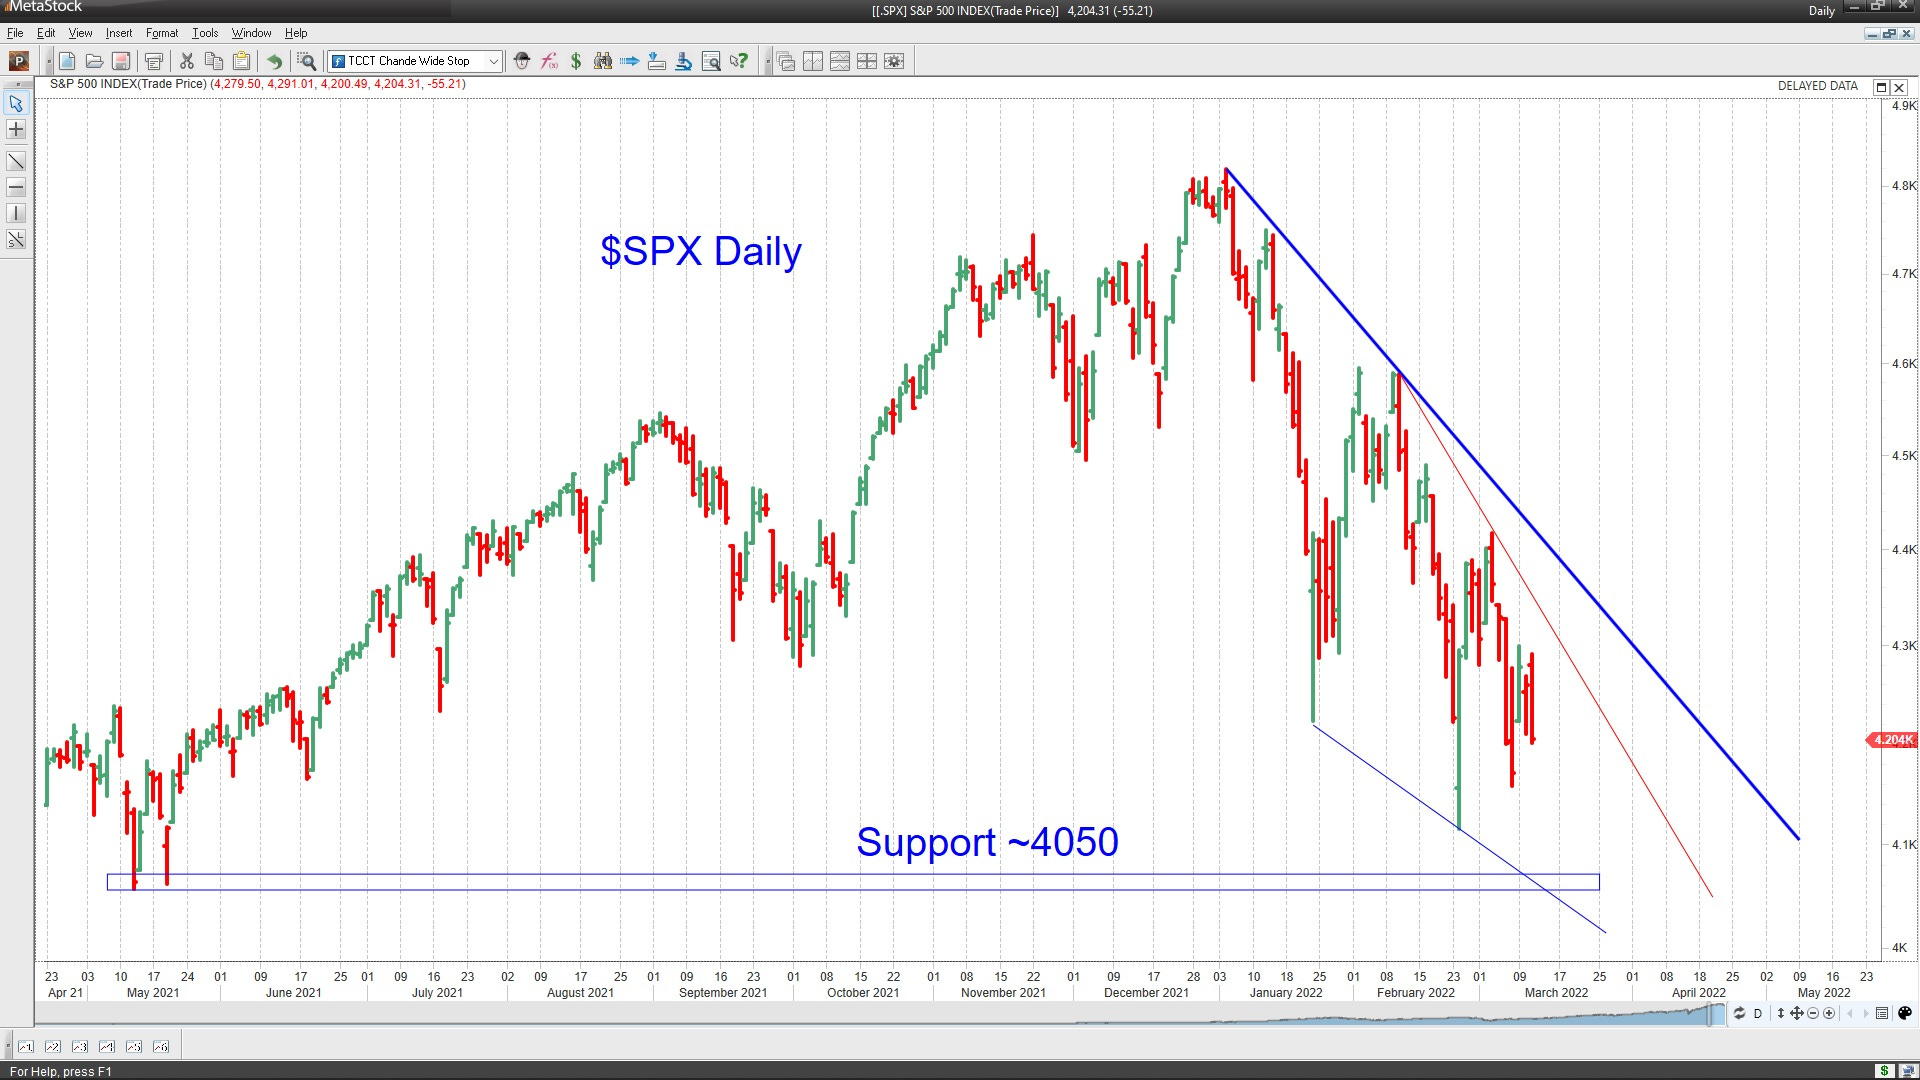
The S&P-500 chart looks quite similar, though it is trapped in a downwards wedge above support at ~4050. Since the threat of further escalation around the Ukraine invasion remains very high, risk aversion is also high, and sentiment is approaching bullish levels.
Navigating Today’s Volatile Markets using CTM
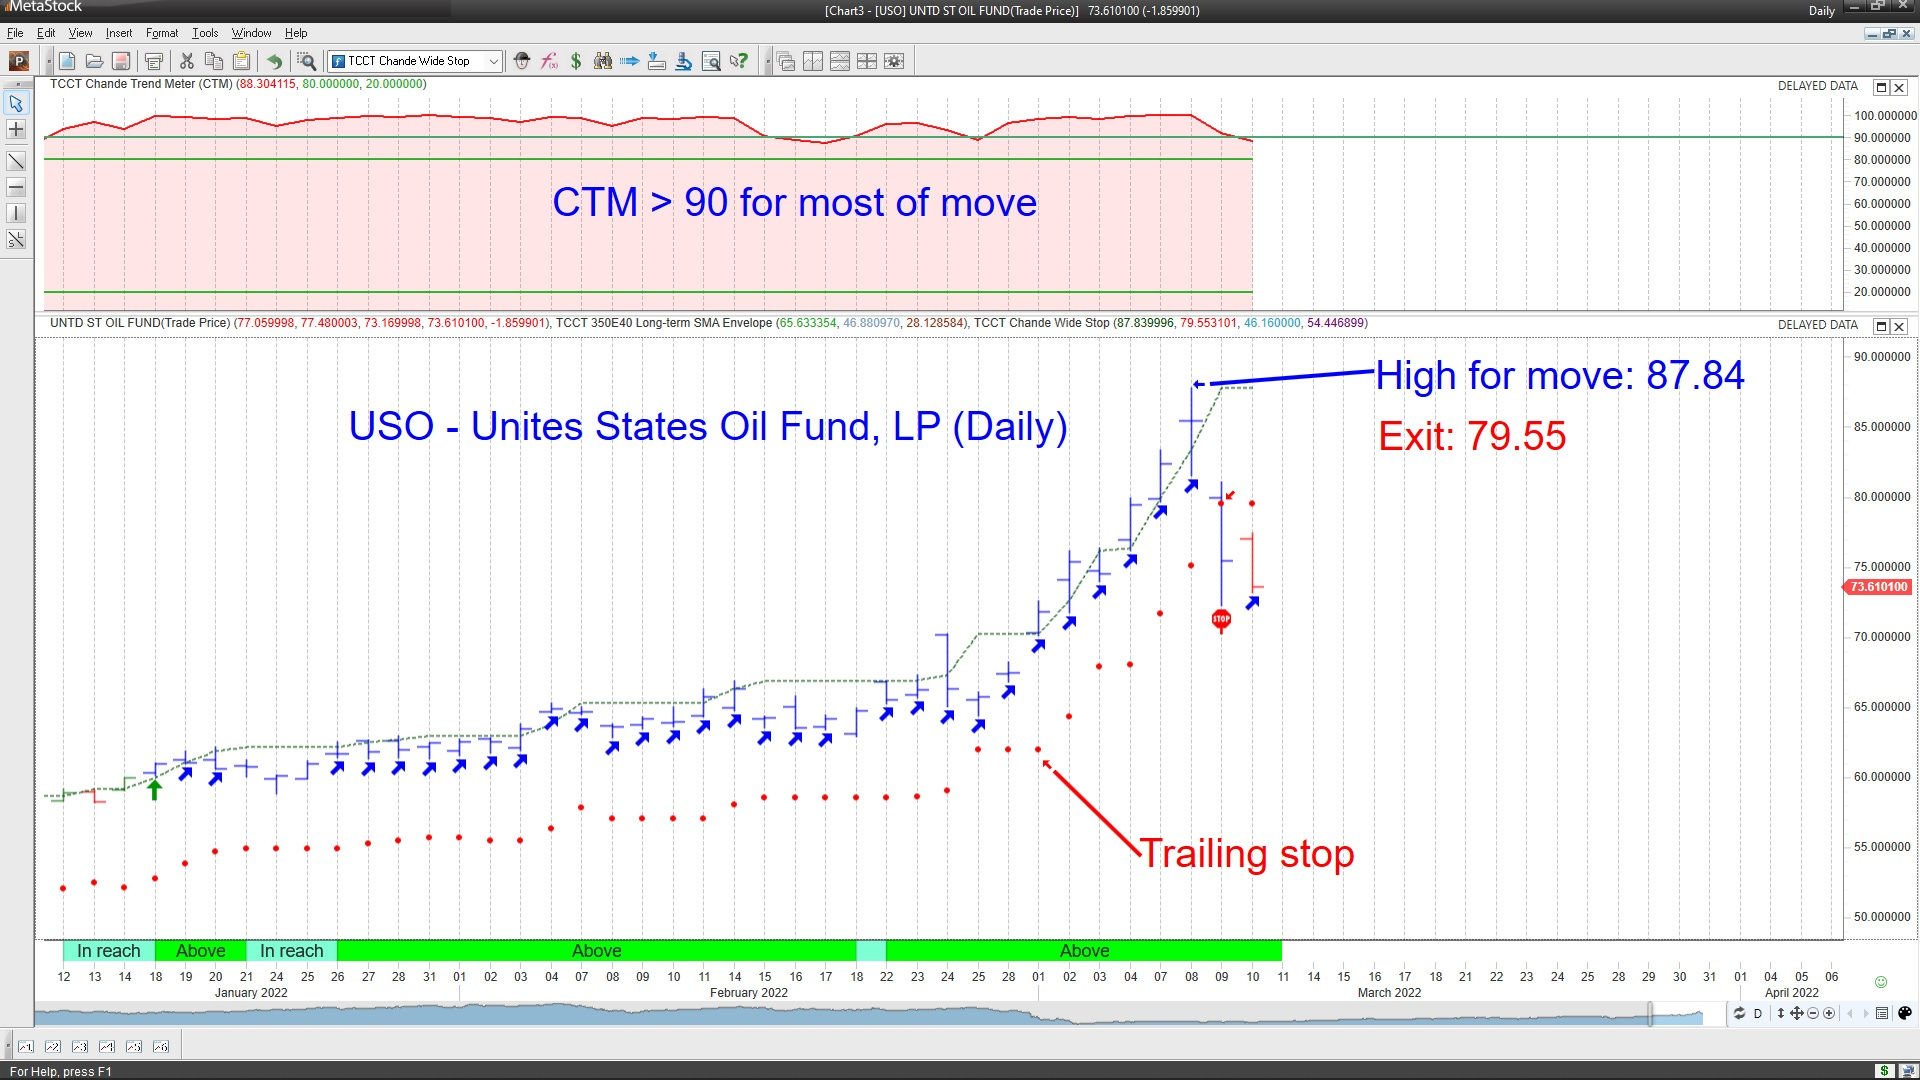
I have several charts and scans to show that you can trade these volatile markets using the Chande Trend Meter in this Metastock presentation. It’s worth a look if you think this may be a good time to add to your portfolios.
Wrap-up
My posts should give you a good starting point, with context and suggestions if you like to do research. Then, you can visit my website, chandeindicators.com, for more information and ideas. I hope you stay tuned and help by subscribing and recommending it to your friends and colleagues.
Thank you for spending some time with me.
Disclaimer
And now for some housekeeping. This publication is for “edutainment,” education, information, and entertainment purposes only. It is not to be construed as investment advice. Past performance is not necessarily indicative of future results. Our disclaimer at chandeindicators.com is included herein by reference.