

Chips Ahoy!
Chips Ahoy!
How to profit for the New Golden Age of Semiconductors

Overview
The FOMC meeting on Tuesday- Wednesday dominated trading all week as we had expected last week (I then wrote: The US Federal Reserve FOMC meeting next week will set the stage for further moves in the market.)
The Fed decided to accelerate its tapering of bond purchases and suggested that they would probably hike interest rates three times next year (see below), even though the initiation of the interest rate lift-off would be data-dependent. As a result, the yield curve flattened this week.
First, there was weakness going into the meeting, as happens often. Then, there was a strong relief rally on Wednesday, followed by a reversal and more selling on Thursday and Friday. The options expiration on Friday somewhat obscures the implications of market action.
Fears of rising rates hit the tech sector, though the mega-cap techs hardly need to borrow any money for their operations.
The market action suggests large-scale portfolio realignment at the institutional level, with defensive rotation into consumer staples.
The rising COVID-19 cases are raising alarms and injecting uncertainty into the markets.

Weighted Dot-plot Fed Funds rate projection from FOMC December meeting.

Key Question
This year, there have been many headlines about the shortage of computer chips. For instance, affecting automobile production at GM. Interestingly, the largest investor in GlobalFoundries suggested that we are in for very rapid growth in the entire semiconductor industry. Therefore, we explore how to participate in this very long-term investment opportunity.
Performance Summary
This week, the trading was choppy, with tech stocks dropping the most with the FOMC almost certain to raise rates next year. But, surprisingly, long-term rates were essentially unchanged this week, so the bond market is comfortable with FOMC actions.

The sensitive net bull/bear balance ended the week in the red, as bullish index ETFs declined, in line with the above table. The choppy trading is visible as this sensitive indicator changed direction three times this week.

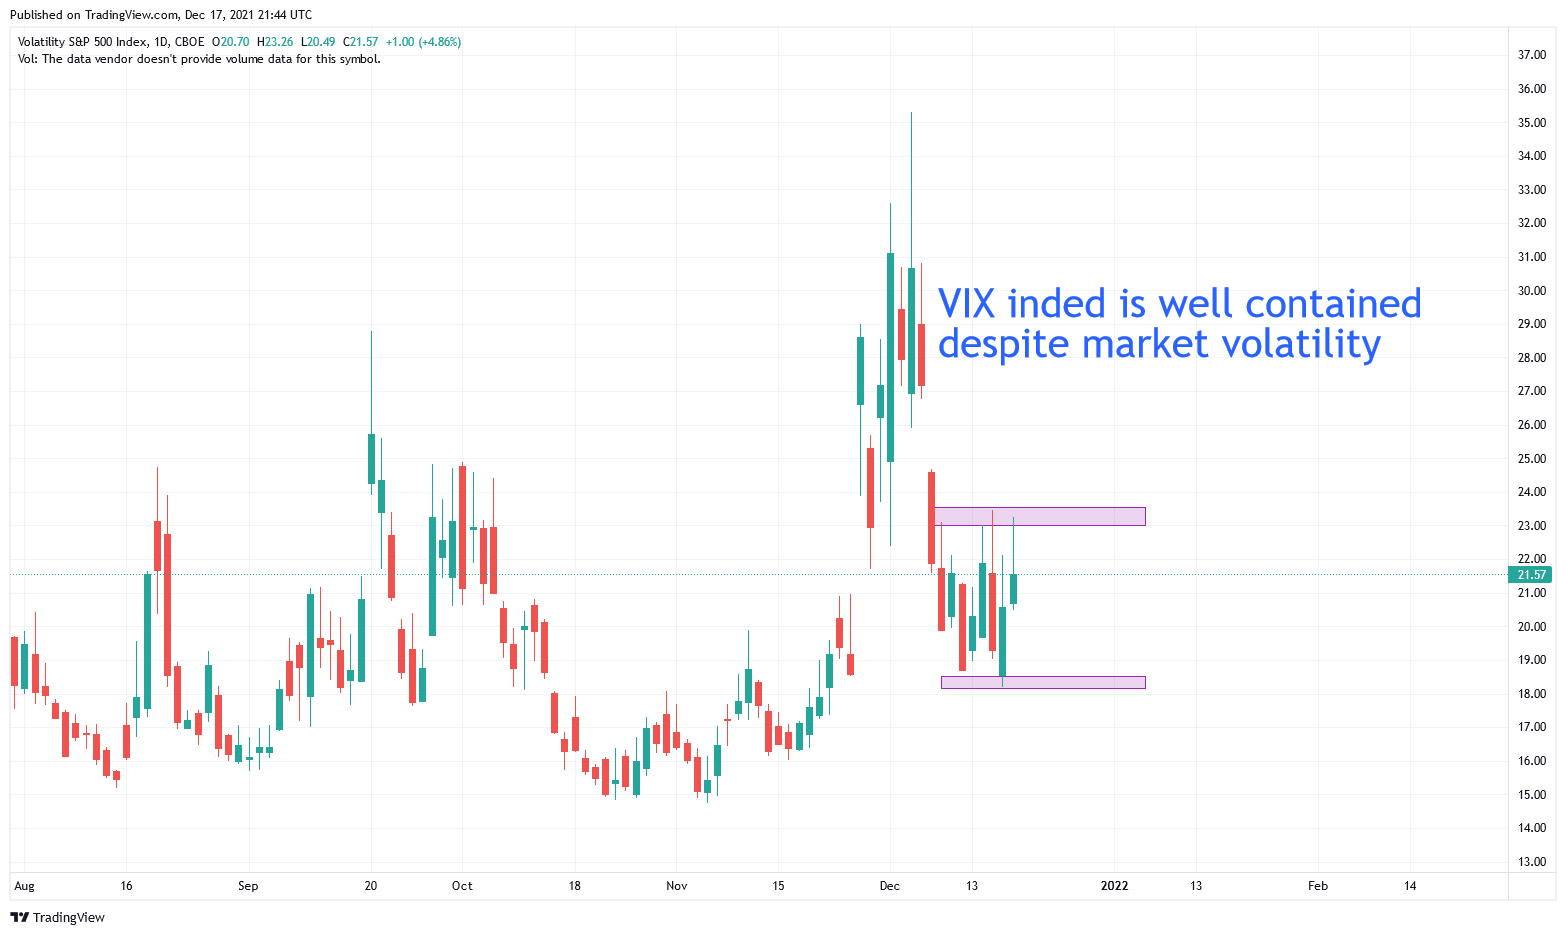
However, the VIX index remained remarkably well contained despite the large swings, a bullish sign. The inability of the bears to push the index through the 23.0 level augurs well for the Santa rally.
We have been focusing on the small-cap index bull 3x ETF (TNA) because it represents speculative sentiment. It appears that this week, TNA has perhaps survived another critical re-test of support.

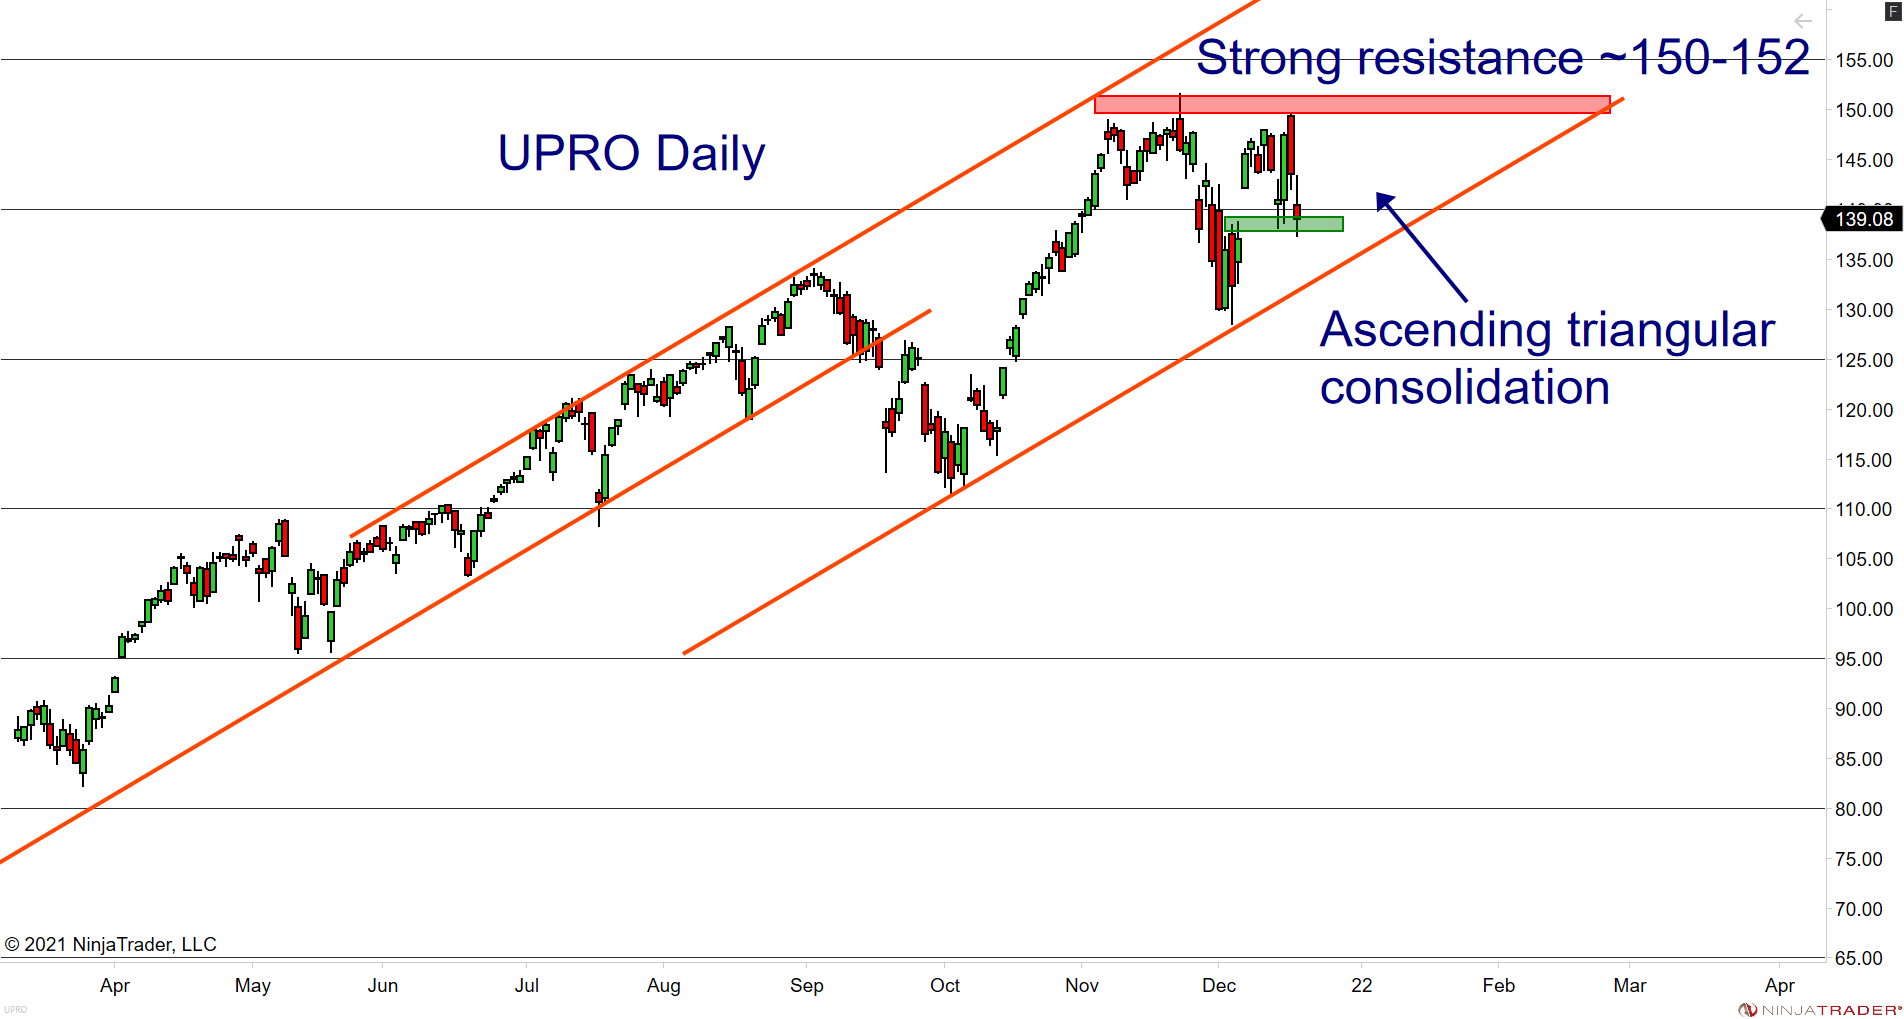
The S&P-500 index has formed an ascending triangle, with solid resistance near highs and a rising trend-line below. The 50-day simple moving average is also providing support. We illustrate with the SPDR SPY ETF below.

I hope that the VIX's stability, the lifting of the debt ceiling, and the clarity around FOMC actions next year will clear the way for a Santa rally later this month. The rising COVID-19 infections are raising alarms, but I expect the market to continue trading within the ascending triangle defined by trendline support and overhead resistance.
VLTI Chips
No, VLTI is not a new type of computer chip. Instead, it stands for a very long-term investment opportunity. Demand for semiconductor chips is booming as never before. A host of factors, such as AI, electric vehicles, 5G networks, and the pandemic recovery, contribute to the demand for chips. As a result, the industry as a whole is projected to double (or more) over the next decade. The GlobalFoundries offering document has an excellent review of business conditions for those looking at the business's fundamental prospects. Indeed, this is being called the New Golden Age of Semiconductors.
First, I will show the very long-term view using XSD, the SPDR S&P Semiconductor ETF, an equal-weighted semiconductor stocks index. The chart below shows the monthly view from 2006. The two blue lines in the lower part of the chart show XSD's trading range through 2014 before it started a powerful ~8x move. The Chande Trend Meter, measuring trend strength (in the upper panel), is close to 100, confirming what your eyes are telling you: the uptrend has been strong. And from the first principles of technical analysis, a trend in force continues until proven otherwise. However, note that though the move has been quite dynamic, there have been several pullbacks along the way, offering lower-risk entry points.

Next, we zoom into this chart by stepping down from a monthly to a weekly time period. Observe the sell-off in March 2020 that essentially tested the top end of the consolidation that lasted through early 2019. The uptrend since then has been impressive (~3.5x), with a multi-month consolidation between ~160-200. Currently, we can mark support at 205 +/- 10, at the top end of the prior consolidation, the 50-week SMA, and the uptrend line since the 2020 lows. Since there is clear resistance at 250, you can wait for a pullback or breakout, as you wish.

The four-hour chart provides an even closer look at the most recent price action. The consolidation after the October breakout continues under 250. A Fibonacci pullback to the 61.8% Fibonacci level would put us near the top of the support zone. So, this chart offers another opportunity to identify entry points to your liking. This ETF can be quite volatile. The technical picture can be summarized as a short-term consolidation within a very long-term uptrend.

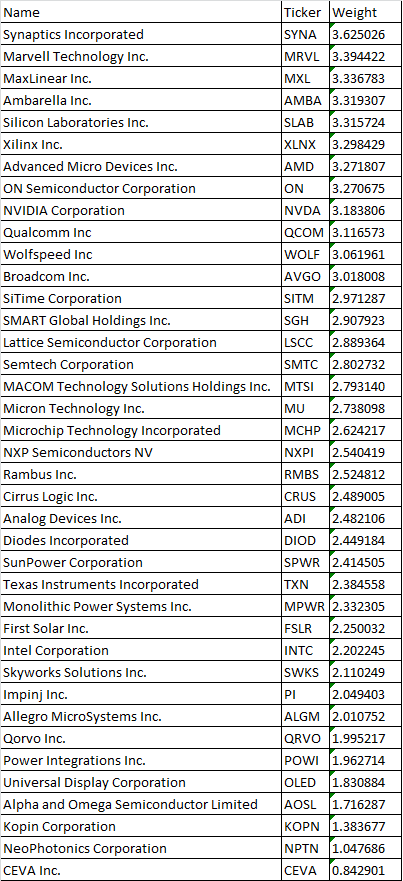
The current components of the XSD ETF are shown below if you wish to explore an individual stock. In addition, the portfolio weight of each constituent is shown in the third column of the table.
Wrap-up
My posts should give you a good starting point, with context and suggestions if you like to do research. Then, you can visit my website, chandeindicators.com, for more information and ideas. I hope you stay tuned and help by subscribing and recommending it to your friends and colleagues.
Thank you for spending some time with me.
Disclaimer
And now for some housekeeping. This publication is for “edutainment,” education, information, and entertainment purposes only. It is not to be construed as investment advice. Past performance is not necessarily indicative of future results. Our disclaimer at chandeindicators.com is included herein by reference.