

Buy-the-Dip Rights the Ship
Buy-the-Dip Rights the Ship
New highs on Friday after a 2% dip on Monday.

Overview
The S&P-500 dropped over 2% on Monday to bounce off its 50-day simple moving average. It ended the week at new highs.
Big tech stocks such as Google, Microsoft, Adobe, and Intuit were also at new highs.
Small stocks may have found important support, but they are still down for the month.
Key Question
How should we interpret this week’s market action: weakness, followed by a rapid surge to new highs? Is it a pattern that is going to repeat?
Performance Summary

After last week’s weakness led to a quick ~2% drop on Monday morning, the S&P-500 found support near its 50-day simple moving average, and that was enough to inspire bulls to buy the dip. The market quickly rebounded to new highs by Friday.
The Bull-Bear net balance from leveraged and inverse ETFs neatly captures the market’s price action. Observe the sharp red spike below -60 early in the week followed by a rebound into the +40 area. Next week I would like to see this indicator rise above +60 to confirm a continuation of the new uptrend.

We have pointed to the relative weakness of small stocks. However, the Direxion Daily Small Cap 3x Bull Shares showed that small stocks might have found support near key levels. Moreover, an energetic rebound by small-cap stocks would help reinforce bullish sentiment.

The Dow Jones Industrials 30-stock index ETF (DIA) shows another view of the market’s action. These big stocks have been trading sideways and have bounced off support between 333 and 339. They are nudging up above the resistance around 350, and a strong move higher by these stocks would also help reinforce the bulls.

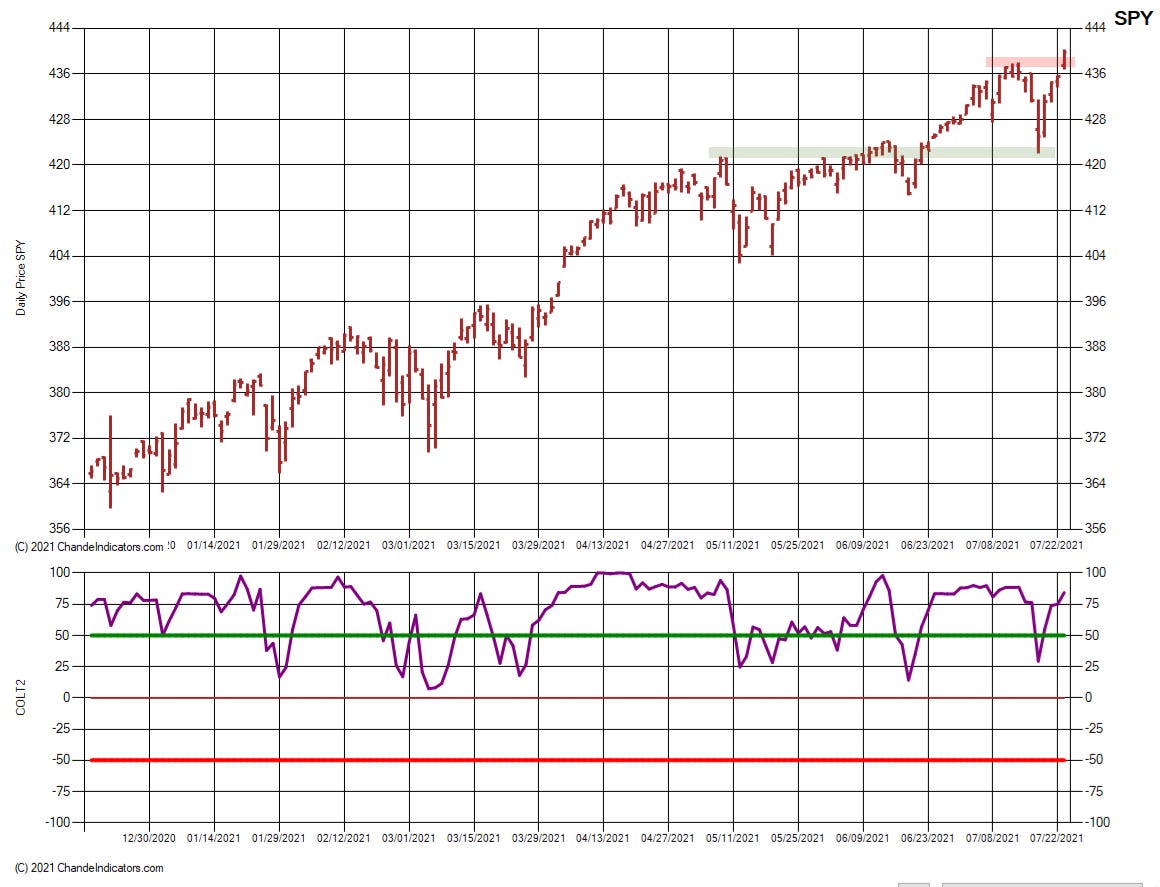
We wrap up this bit of the discussion to look at the SPDR S&P-500 ETF (SPY) chart. Observe how the rather sharp sell-off amounted to a test of the previous breakout level around 421-424. Thus, a good follow-through next week with lows above the red band would be bullish.
The new highs were led by mega-cap stocks such as Microsoft, Google, and leaders in the QQQ index. If we compare the SPY chart above to the MSFT chart below, we can see that MSFT held up well during the sell-off, never approaching its breakout level near 264. It is climbing to new highs with both my long-term momentum oscillators between 75-100, which means the momentum is powerful.

Buy-the-Dip Pattern in the S&P-500
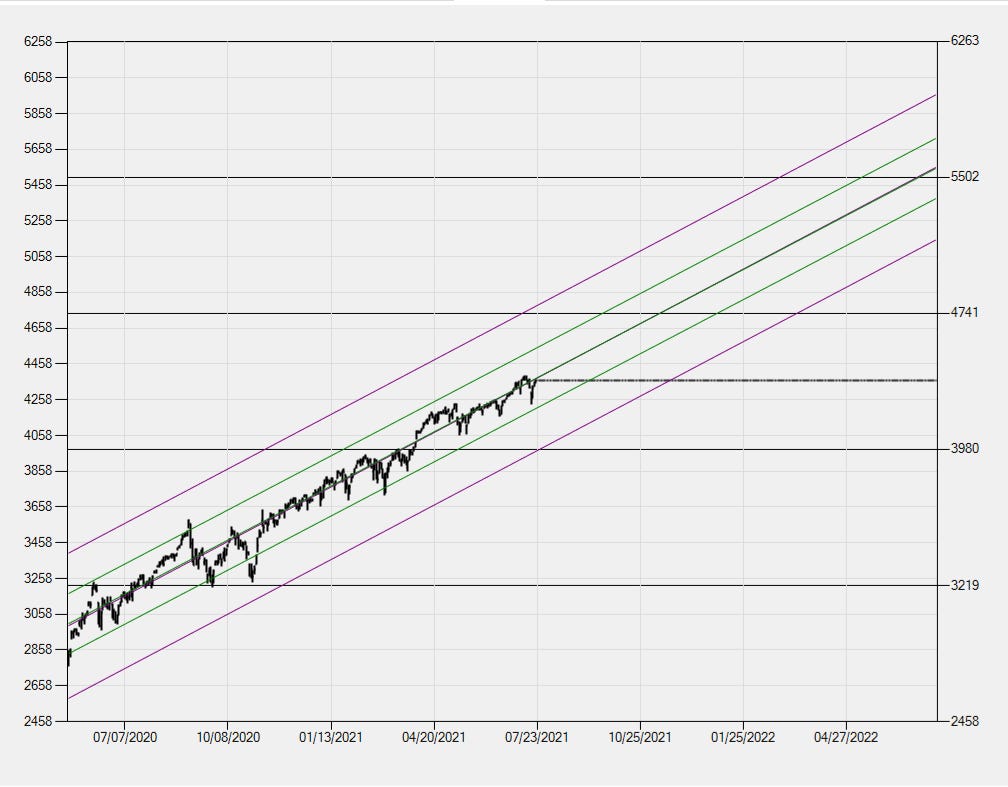
All year long, the buy-the-dip pattern has been repeated as the market recovered from each decline. Here we show the SPY chart with our short-term oscillator plotted in the lower panel. We have circled the key lows since January. Each of the lows has been a “low-risk” entry point into the uptrend. So naturally, if the uptrend were to reverse, the oscillator would be pinned to the -100 level during the sell-off. Looking ahead, the S&P-500 is on track to exceed the 5,000 level by the middle of next year. Hence, I expect the pattern to continue for a little while longer.

Best Performing Vanguard ETFs
The Vanguard ETFs with the strongest returns over the past year have good exposure to growth stocks and mega-cap stocks. The decline in rates and rise in energy prices are also noted in the table. For more ETFs, you can search my website here.

Wrap-up
If you like to do your own research, my posts should give you a good starting point, with context and suggestions. You can visit my website, chandeindicators.com, for more information and ideas. I hope you will stay tuned and help by subscribing and recommending it to your friends and colleagues.
Thank you for spending some time with me.
Disclaimer
And now for some housekeeping. This publication is for “edutainment,” education, information, and entertainment purposes only. It is not to be construed as investment advice. Past performance is not necessarily indicative of future results. Our disclaimer at chandeindicators.com is included herein by reference.