

Buddy Can You Spare a COIN?
Buddy Can You Spare a COIN?
We identify two dozen large cap stocks for your attention.

Overview
The Coinbase (COIN) direct listing stole the show and capital away from tech stocks.
Large cap and mega cap stock based indexes made new highs.
Small stocks bounced a bit, but still lagging.
Most sectors are trending strongly, except energy related sectors.
Traders are taking notice of the rise in COVID19 infections, as small stocks and energy sector stocks lag.
Key Question
With Large Cap stocks capturing attention, can we identify the “strongest” of them all?
Performance Snapshot
The market continued make new highs, especially with the mega and large cap indexes. Small caps rebounded a bit, but continue to lag, perhaps due to a rise in COVID19 infection rates. The divergence in the performance of Vanguard ETFs VONE and VTWO nicely illustrates this development. As you can see in the table below, VONE is up 5.47% month to date, well ahead of the 1.85% gain for VTWO. The VONE reflects the Russell 1000 universe, and the VTWO is built on the Russell 2000 universe (small cap stocks).

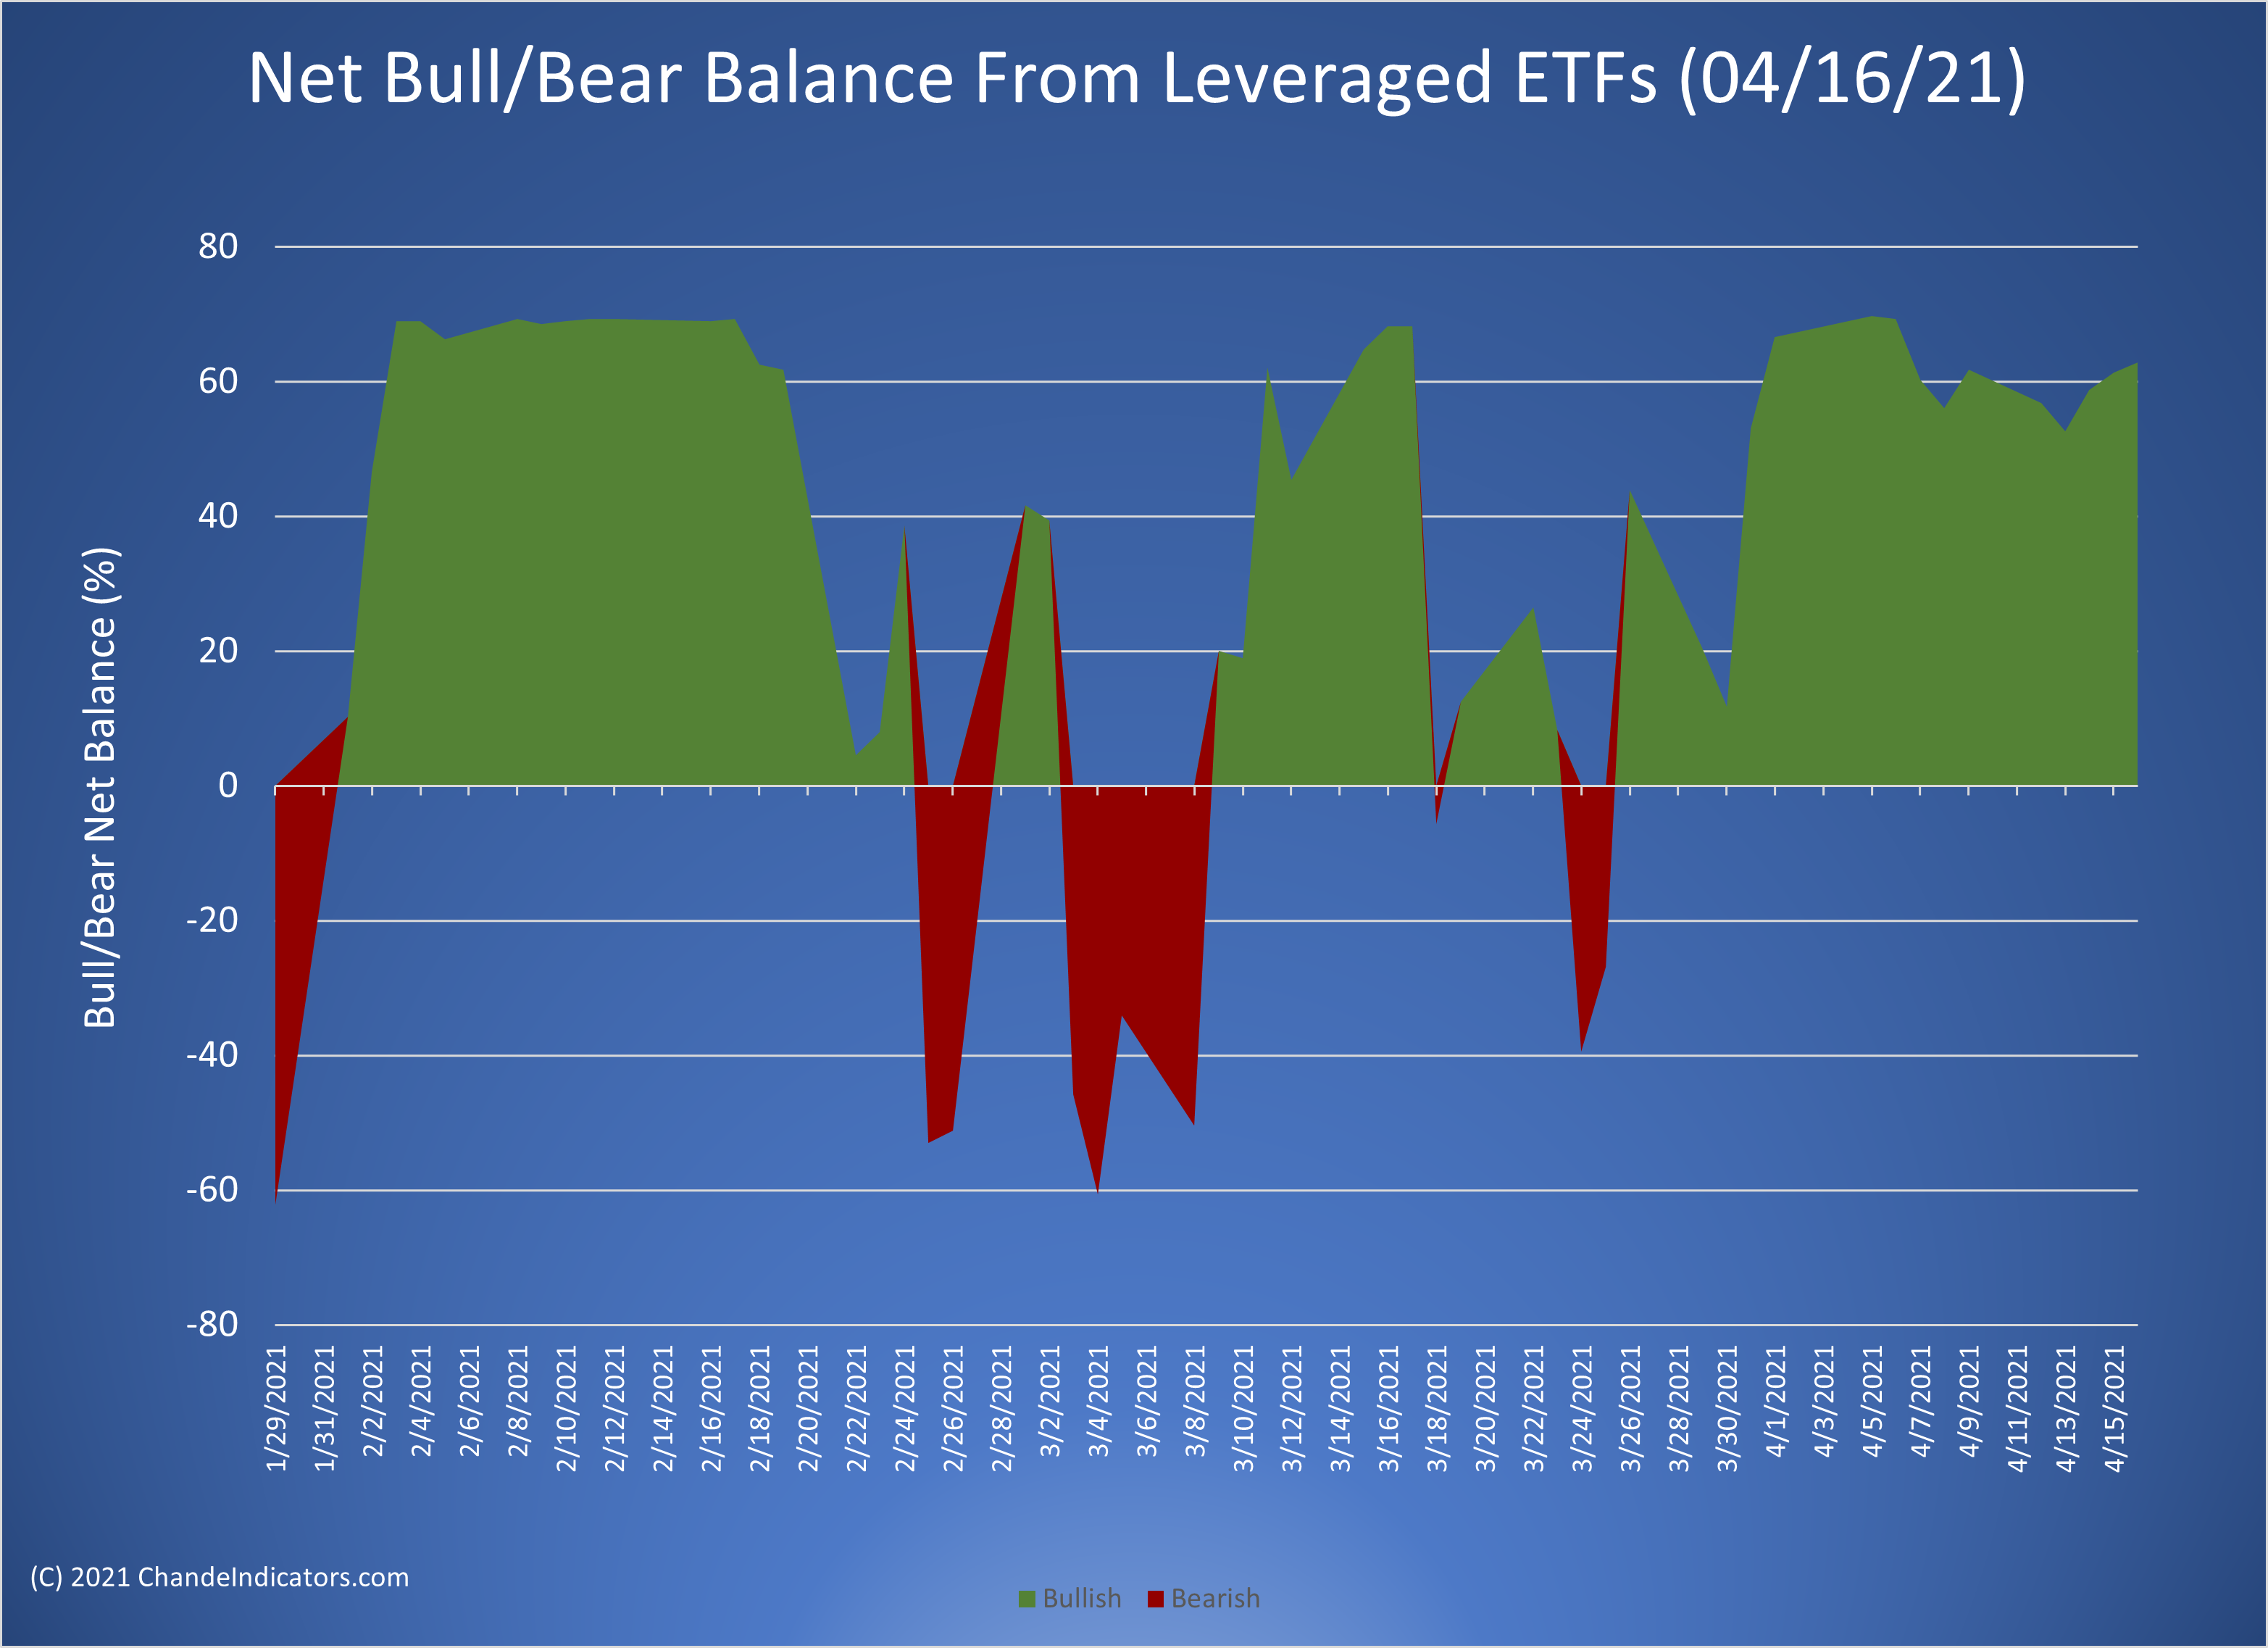
Trend Direction from Leveraged ETFs
The leveraged ETFs we follow are in bullish rally mode, confirming the market moves for the past month or so. This is a sensitive indicator, which could whipsaw as the market hunts for direction. A value above +40 indicates a steady trend in a particular direction.
Analysis of Vanguard Market Cap ETFs
The Vanguard market cap ETFs are mostly trending strongly, with the small caps lagging noticeably. Large cap growth stocks (MGK and VOOG) have put in the best performance. Value stocks are trending strongly but lagging the growth stocks. So the rotation toward large caps and away from small to mid cap stocks continues for yet another week.

Sector Analysis with iShares US Sector ETFs
The iShares US Equity ETFs is another approach to identifying the strongest sectors. Here the vertical axis is a measure of momentum, and the horizontal axis is composite multi period return. We again use a multi-pronged approach of ranking by return as well as chart trend strength. Energy-related sector ETFs are lagging, but the others are trending strongly, being clustered in the upper right hand quadrant. This chart is useful for those who want to take advantage of the diversification of ETFs coupled with investment in the strongest sectors of the market. Naturally, a counter-trend approach is to assume that energy sector will recover once we are past the current surge in COVID-19 infections.

Ranking the Strongest Large Cap Stocks
Ranking stocks should carry caveats, because it truly represents only a snapshot in time, and different ranking processes produce quite different results. Here we look at the time period of about a year, to construct our Relative Performance Meter, and then combine it with a long-term technical trend strength oscillator, to produce a joint ranking that combines strong returns with strong charts. The two calculations have different time periods (up to 12 months for RPM, up to 5 months for the COLT2), so differences reflect momentum in different time frames, as well as a quantification of “how the stock is trading”. It should be a good starting point for your own research. We will be adding this feature soon to our website and combining it with charting to simplify your search. As always, there is risk of loss in trading.

The table below summarizes the data for quick reference. It is important to remember that rankings are not cast in stone, but change every day as the stock reacts to incoming information.

Mark Your Calendar: May 13, NinjaTrader Ecosystem Event
I will be doing a live event with the NinjaTrader Ecosystem covering my indicator package for the NinjaTrader 8 trading platform. Registration is required.
Wrap-up
If you like to do your own research, my posts should give you a good starting point, with context and suggestions. You can visit my website, chandeindicators.com, for more information and ideas. I hope you will stay tuned, and help by subscribing, and recommending it to your friends and colleagues.
Thank you for spending some time with me.
Disclaimer
And now for some housekeeping. This publication is for “edutainment”, education, information, and entertainment purposes only. It is not to be construed as investment advice. Past performance is not necessarily indicative of future results. Our disclaimer at chandeindicators.com is included herein by reference.