

Best ETFs Hotlist(11/12/2021)
Best ETFs Hotlist(11/12/2021)
We identify super-trending ETFs.

Overview
Consumer inflation hit a 30-year high at 6.2%, and prices are rising across the board.
The inflation report pushed the market down for two days, but it rose on Thursday and Friday. (We had observed last week that the market “is approaching critical Fibonacci extensions and may need a little breather.”)
Interest rates rose after the inflation report, and traders now expect two interest rate hikes next year. But, overall, the 10-year US Treasury continues to trade within a broad trading range(1.1%-1.75%) or so.
The US Dollar strengthened versus other major currencies on the back of rising rates, good news for those traveling abroad.
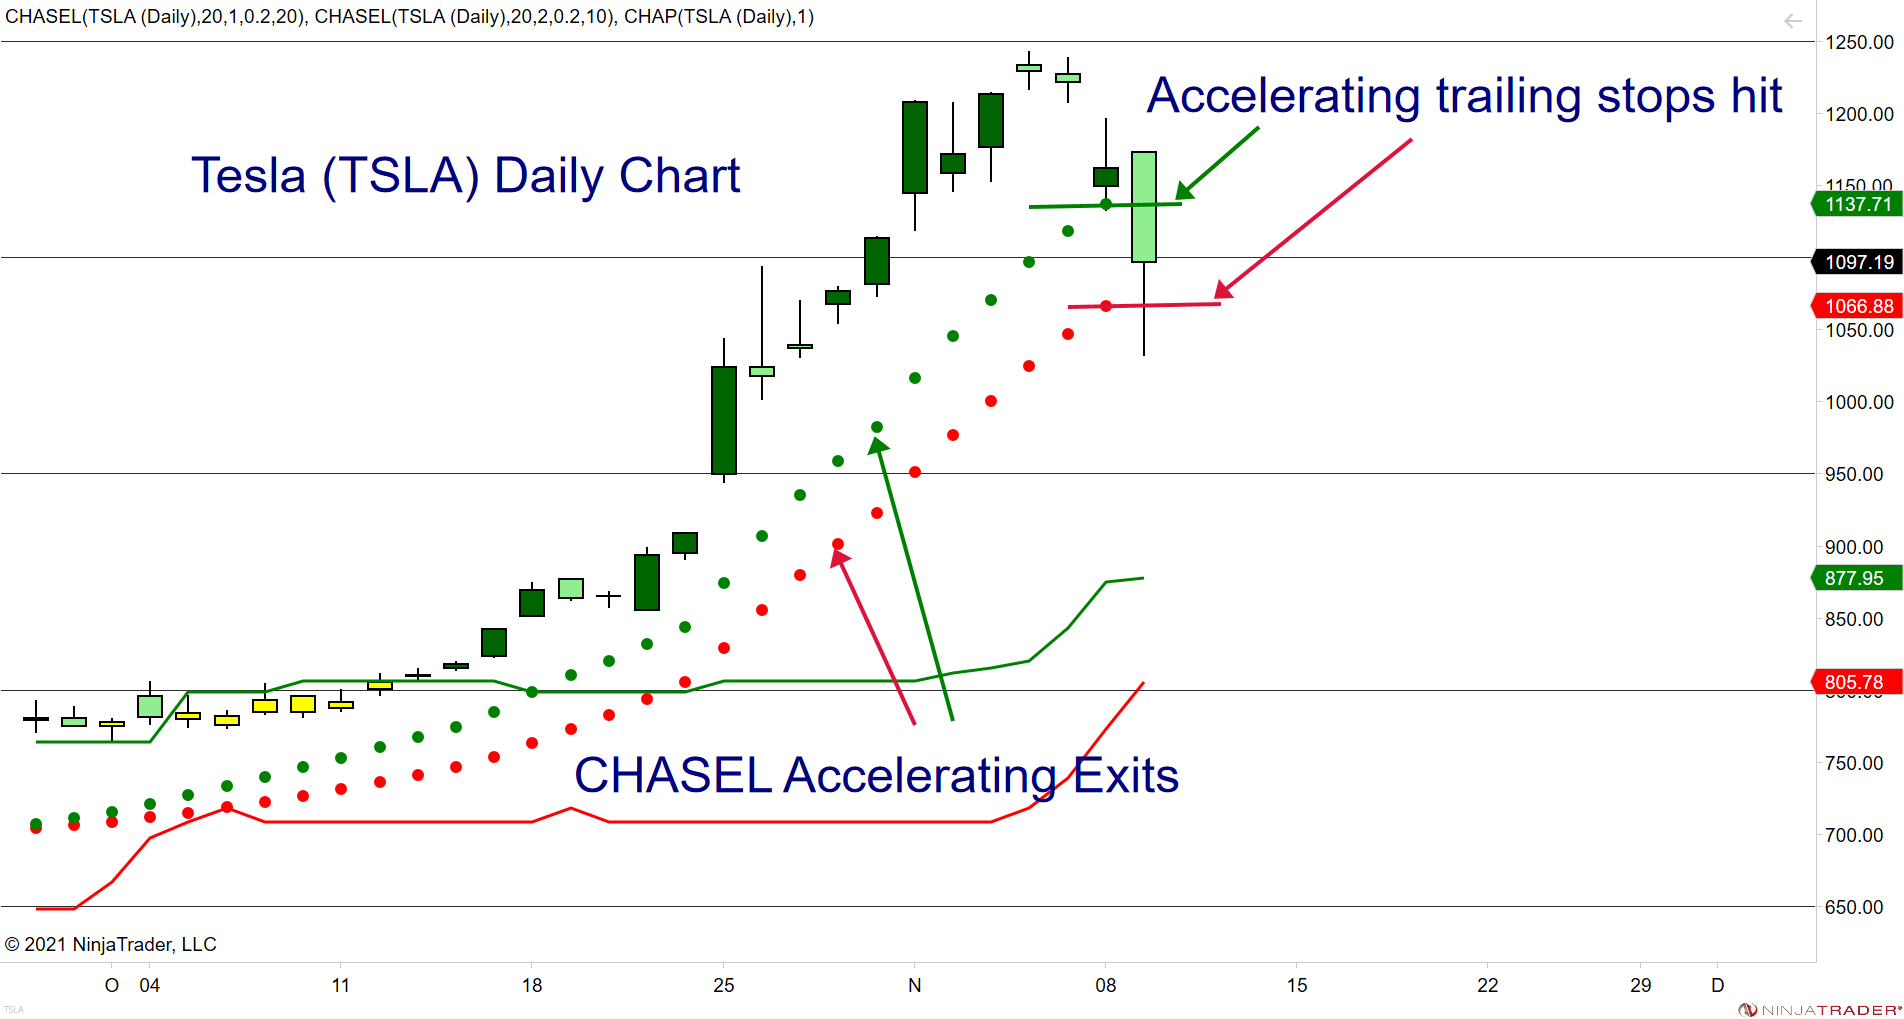
Tesla reversed strongly, marking the near-term high in the markets, as Elon Musk sold about $6 billion in stock. The rapid reversal is an excellent reason to use trailing stops.
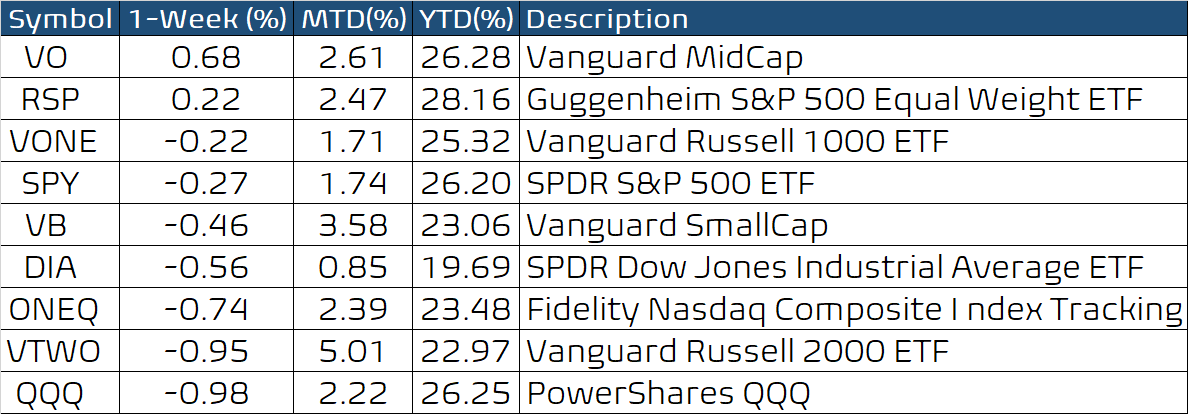
Performance Summary
The market pulled back a bit this week, as we had expected in our last commentary. The “reason” was high inflation readings, but traders mostly overlooked the weakness by Friday. Mid-Cap stocks held up well, but the rising rates caused a knee-jerk selloff in tech stocks.
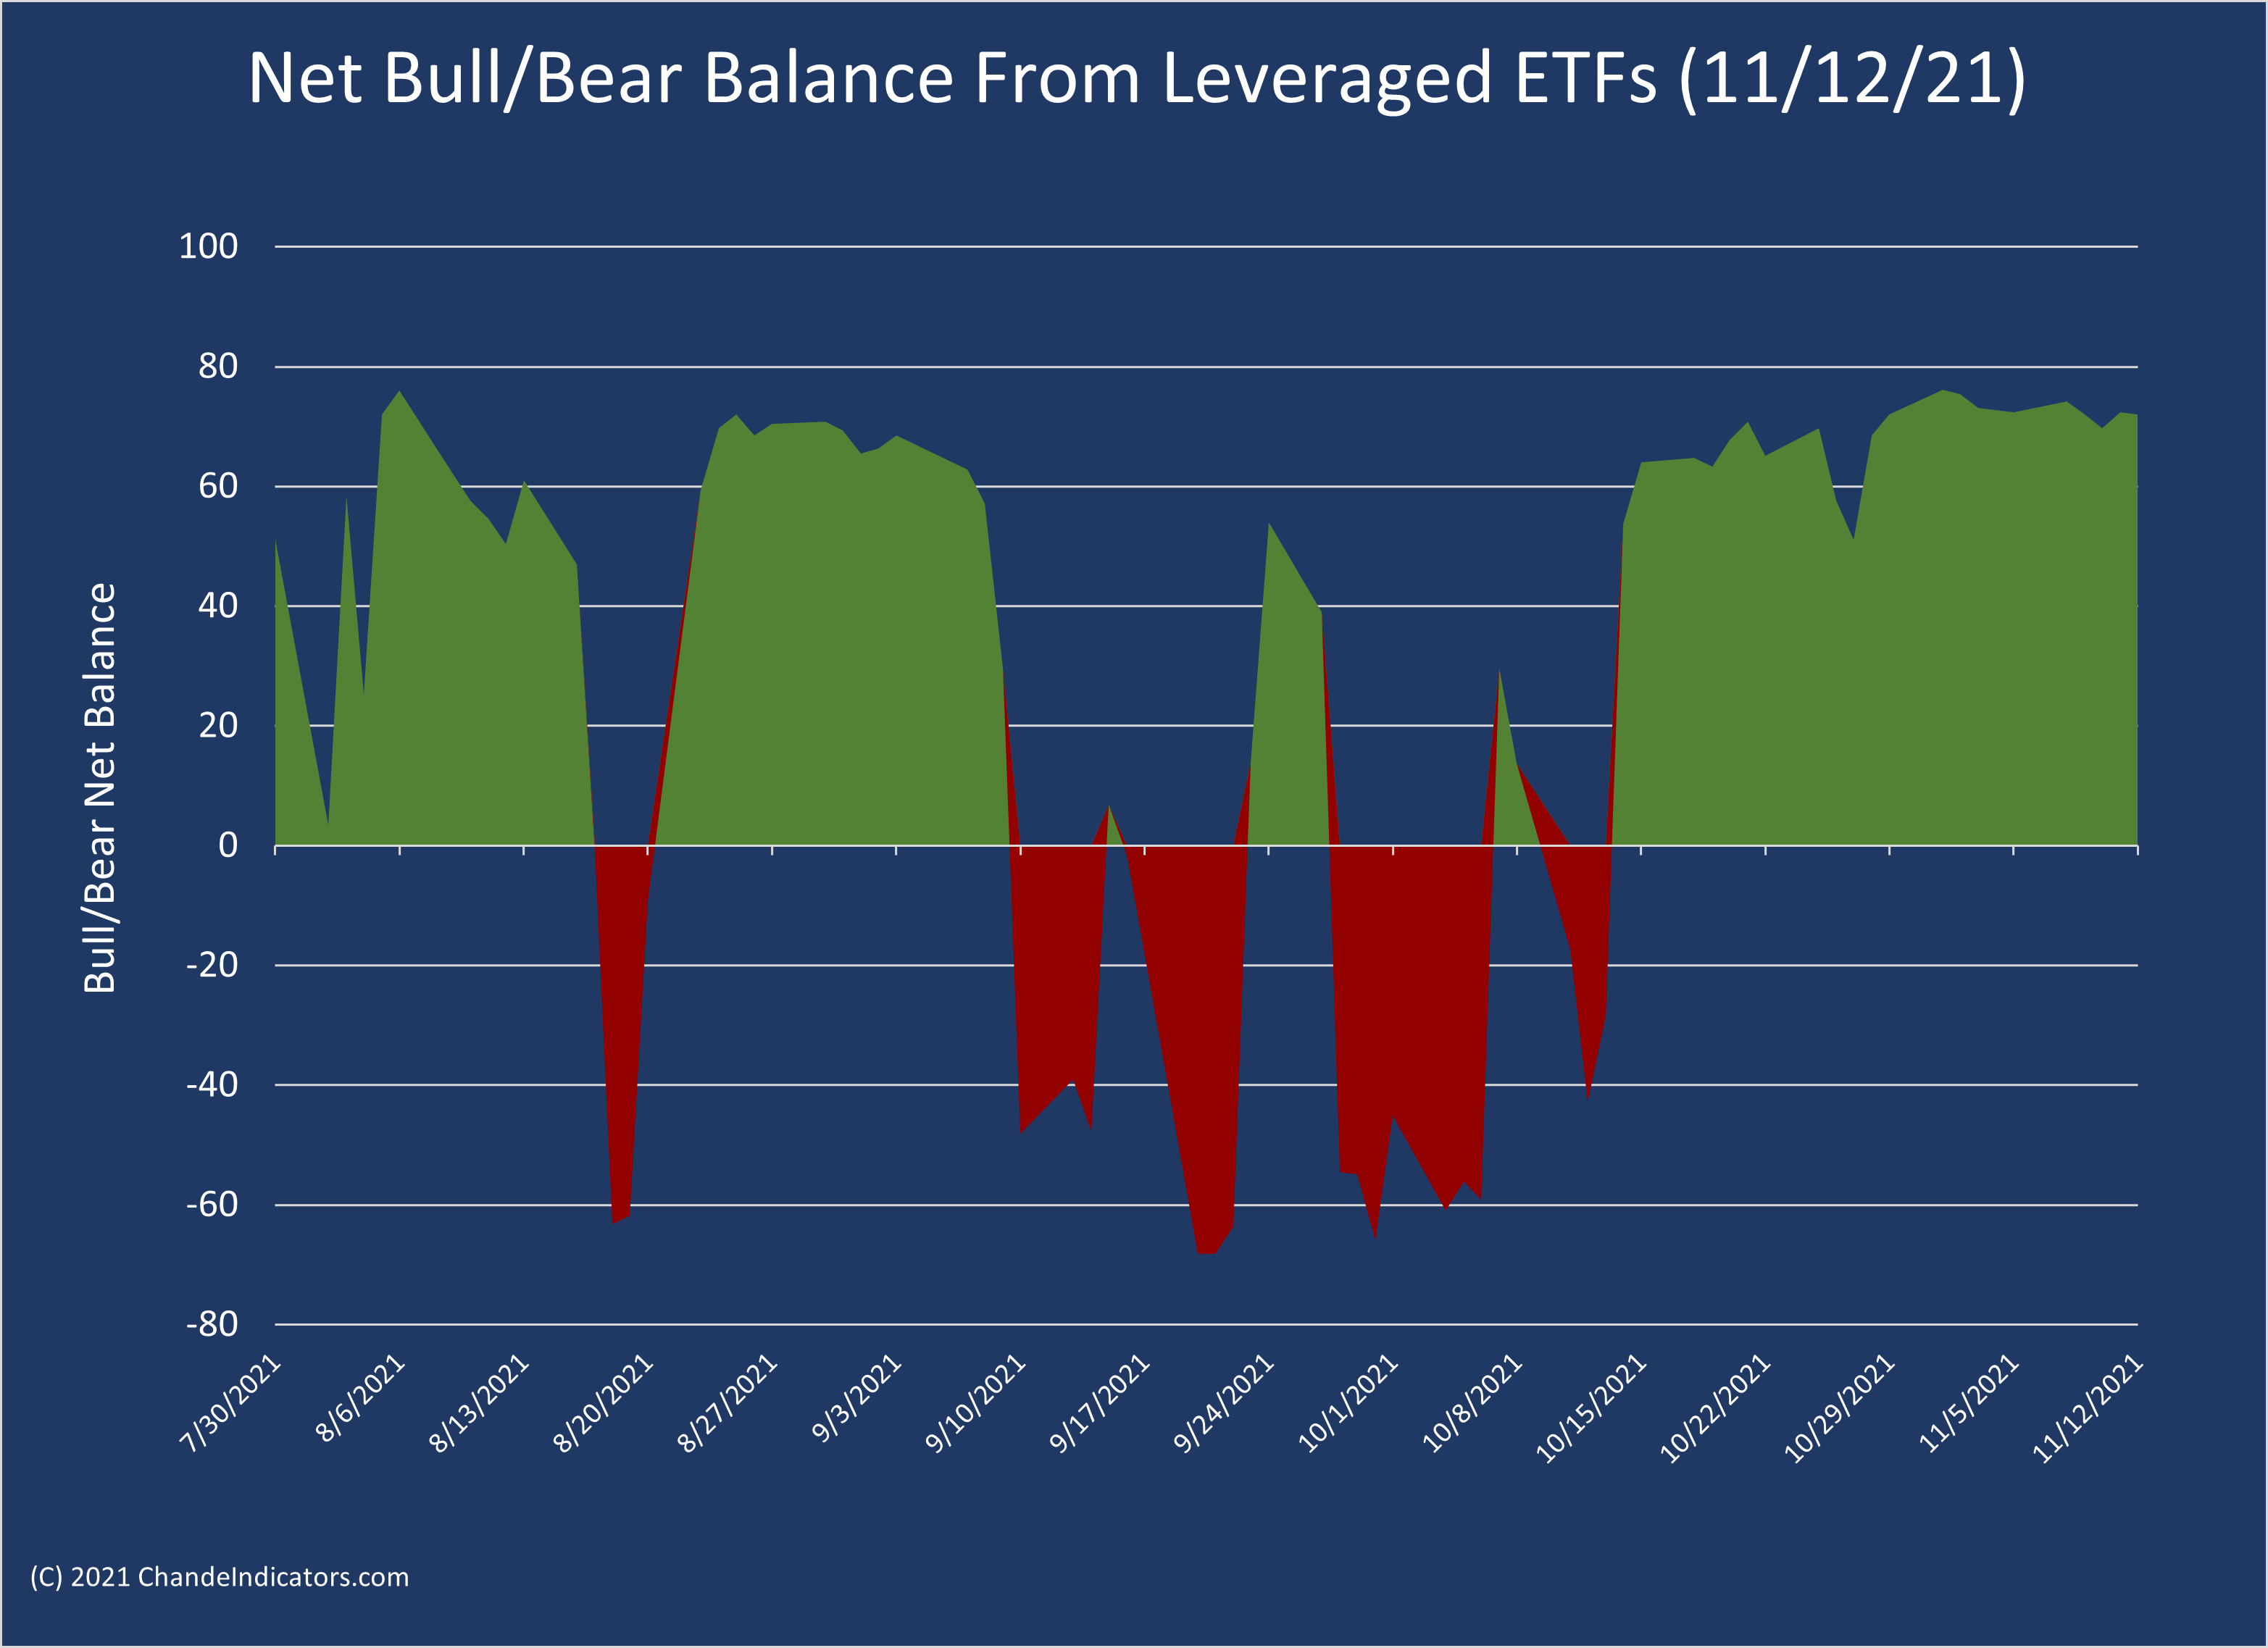
Overall, the weakness was well contained. Our net balance of bull and bears from inverse and leveraged ETFs is firmly bullish above +70. Notice it barely budged this week due to the strong swing move higher.
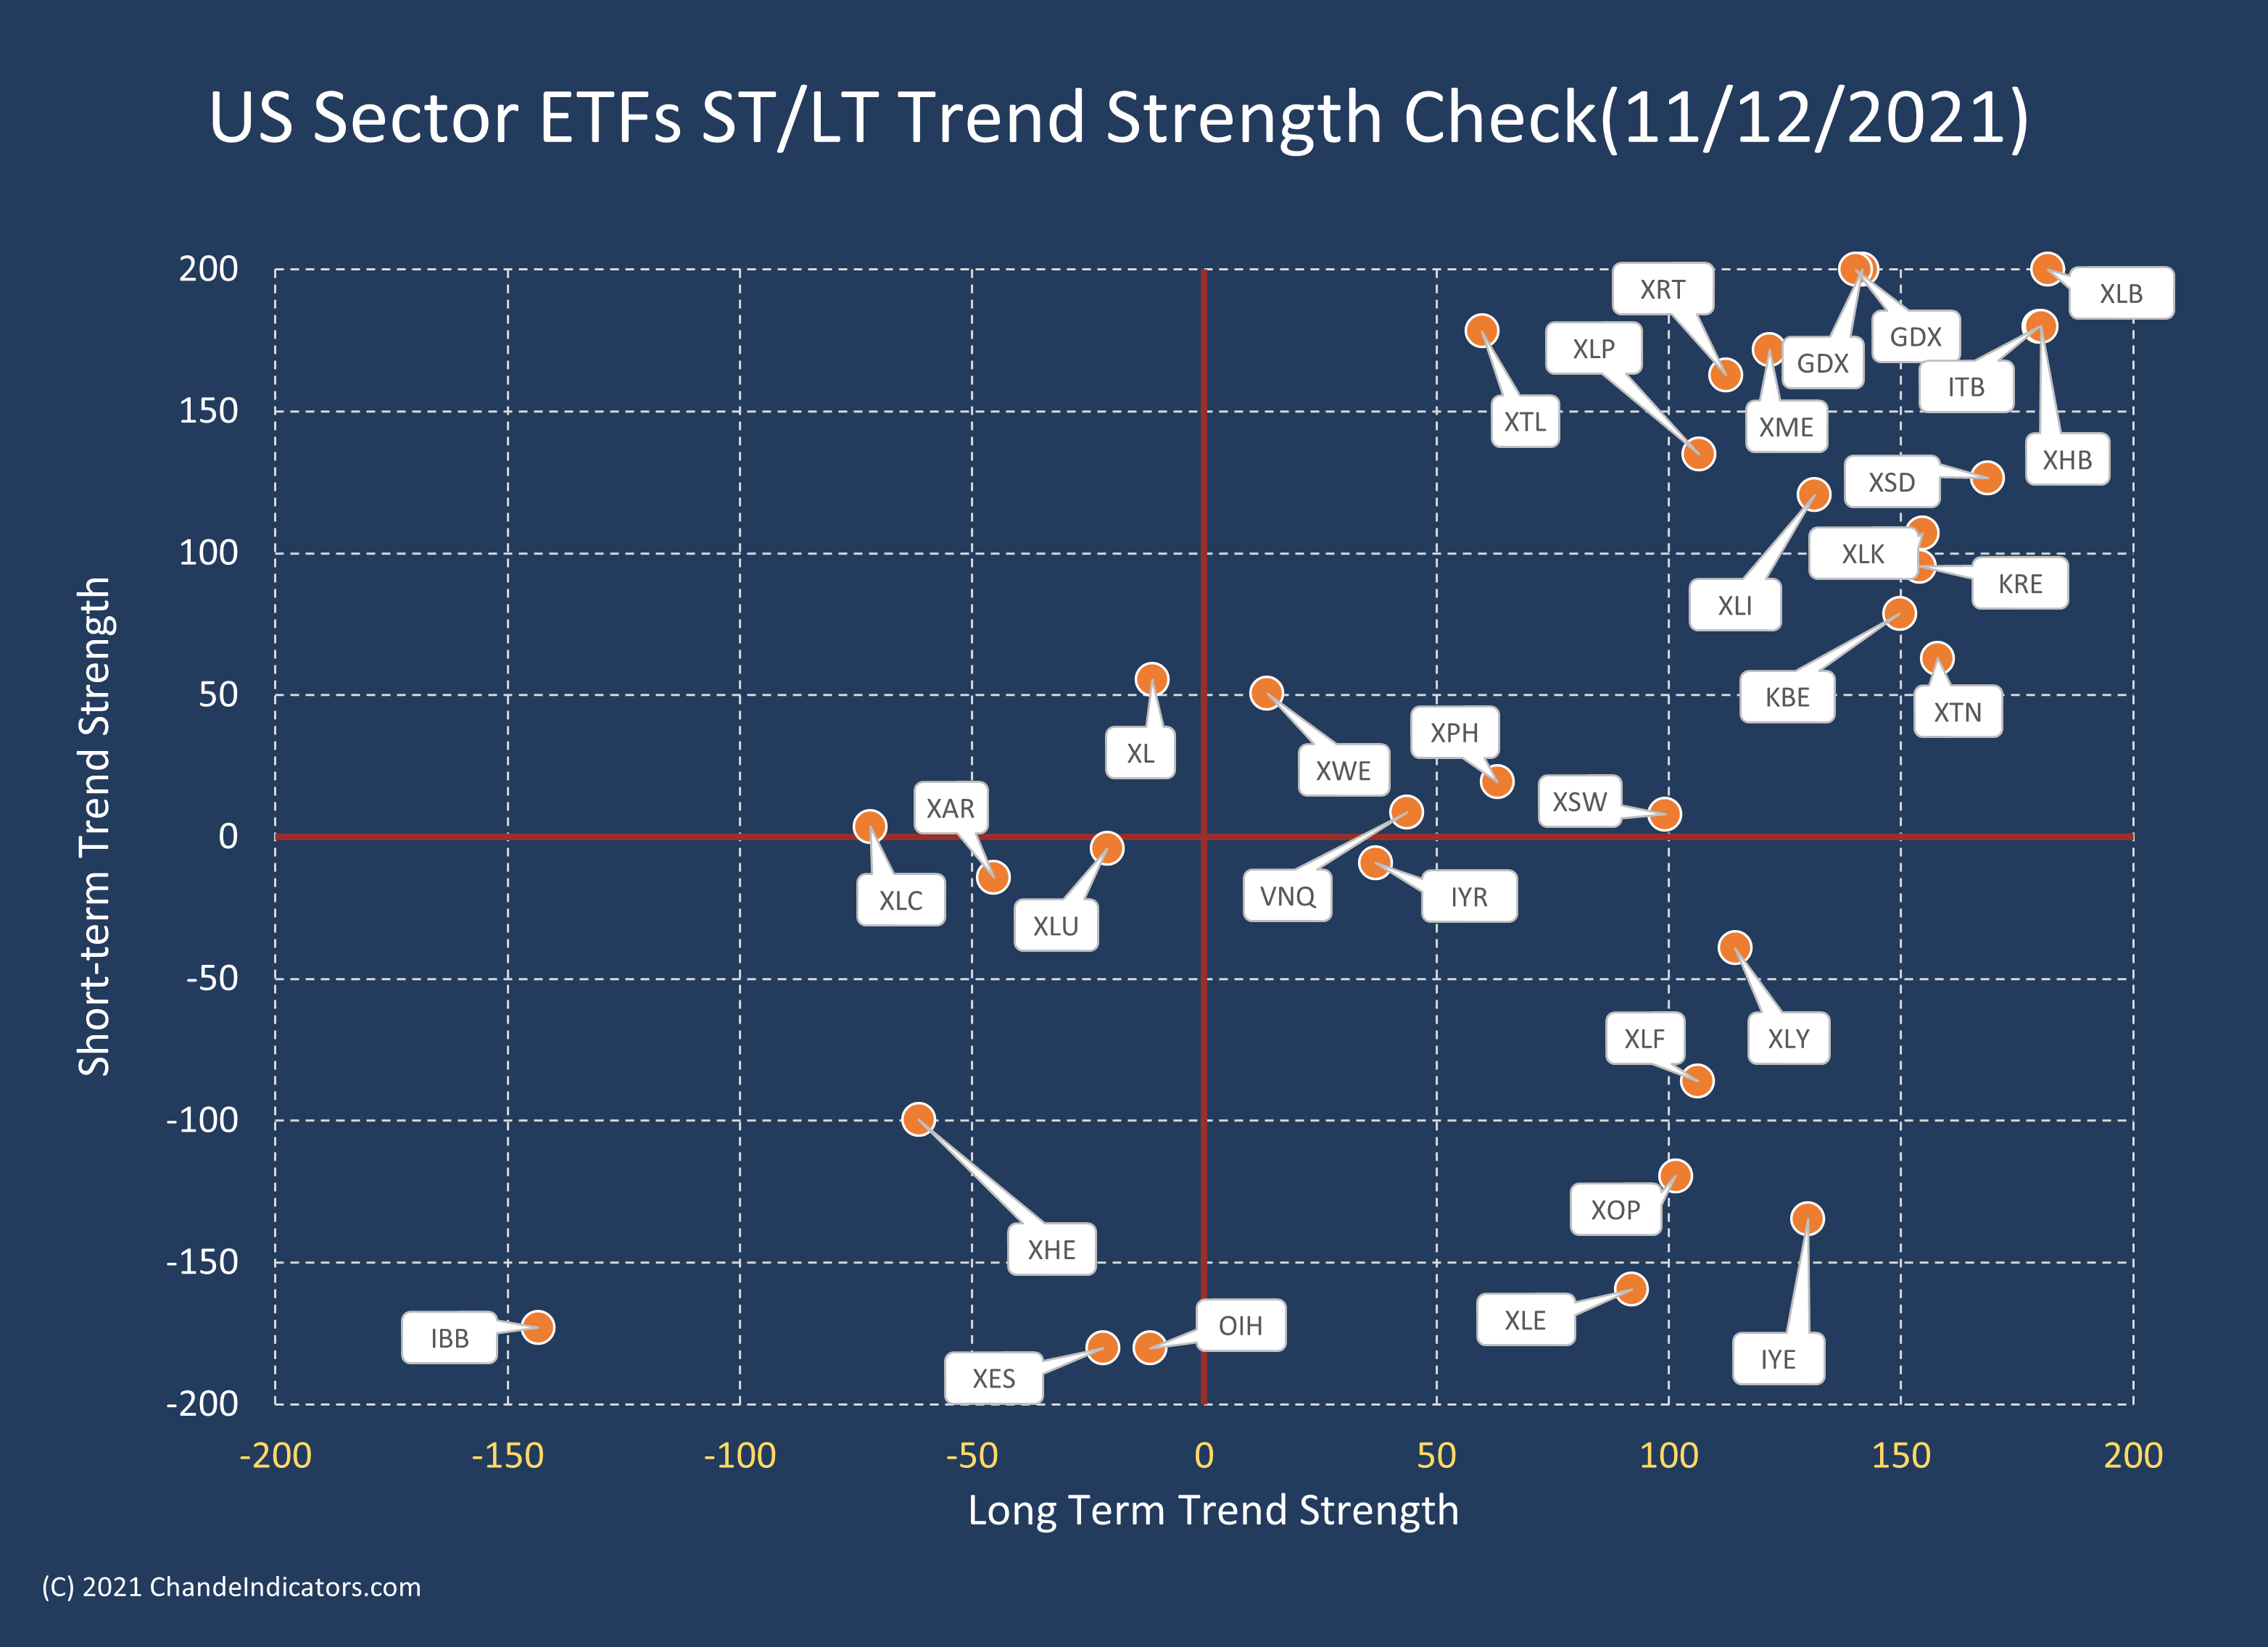
The rising rates and fears of inflation helped gold bugs find support in our sector roundup.
Super-Trending ETFs
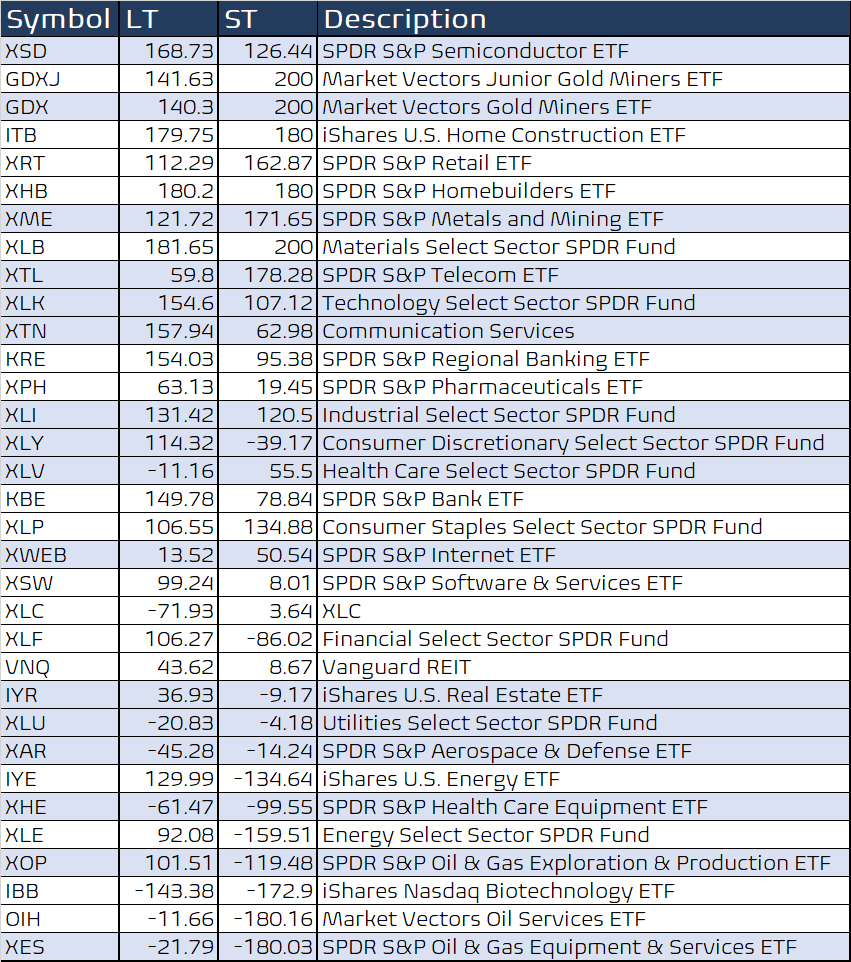
We looked under the hood of our indicator tables and tried to find ETFs with super-strong trends. ETFs are diverse, and it is time-consuming to look through many charts and compare them consistently. There are many ways to manipulate our tables, but we present two simple views. First, we rank the ETFs by their relative composite returns over the past year. These are the ETFs with the strongest price movements (see table below). Naturally, some leveraged ETFs are on the list, but so are several non-leveraged ones. You may wish to look at these ETFs if you think the strong trends will continue.

Another way to look at the table is to combine the RPM with other technical measures of chart strength. The focus now shifts beyond absolute returns to the technical measures of momentum. As a result, we see industrial stocks, wheat, semiconductors, and Lithium ETFs, a much broader mix than the table above.

The AIRR ETF is clearly in breakout mode after a prolonged consolidation (the long consolidation often presages a decent trend).

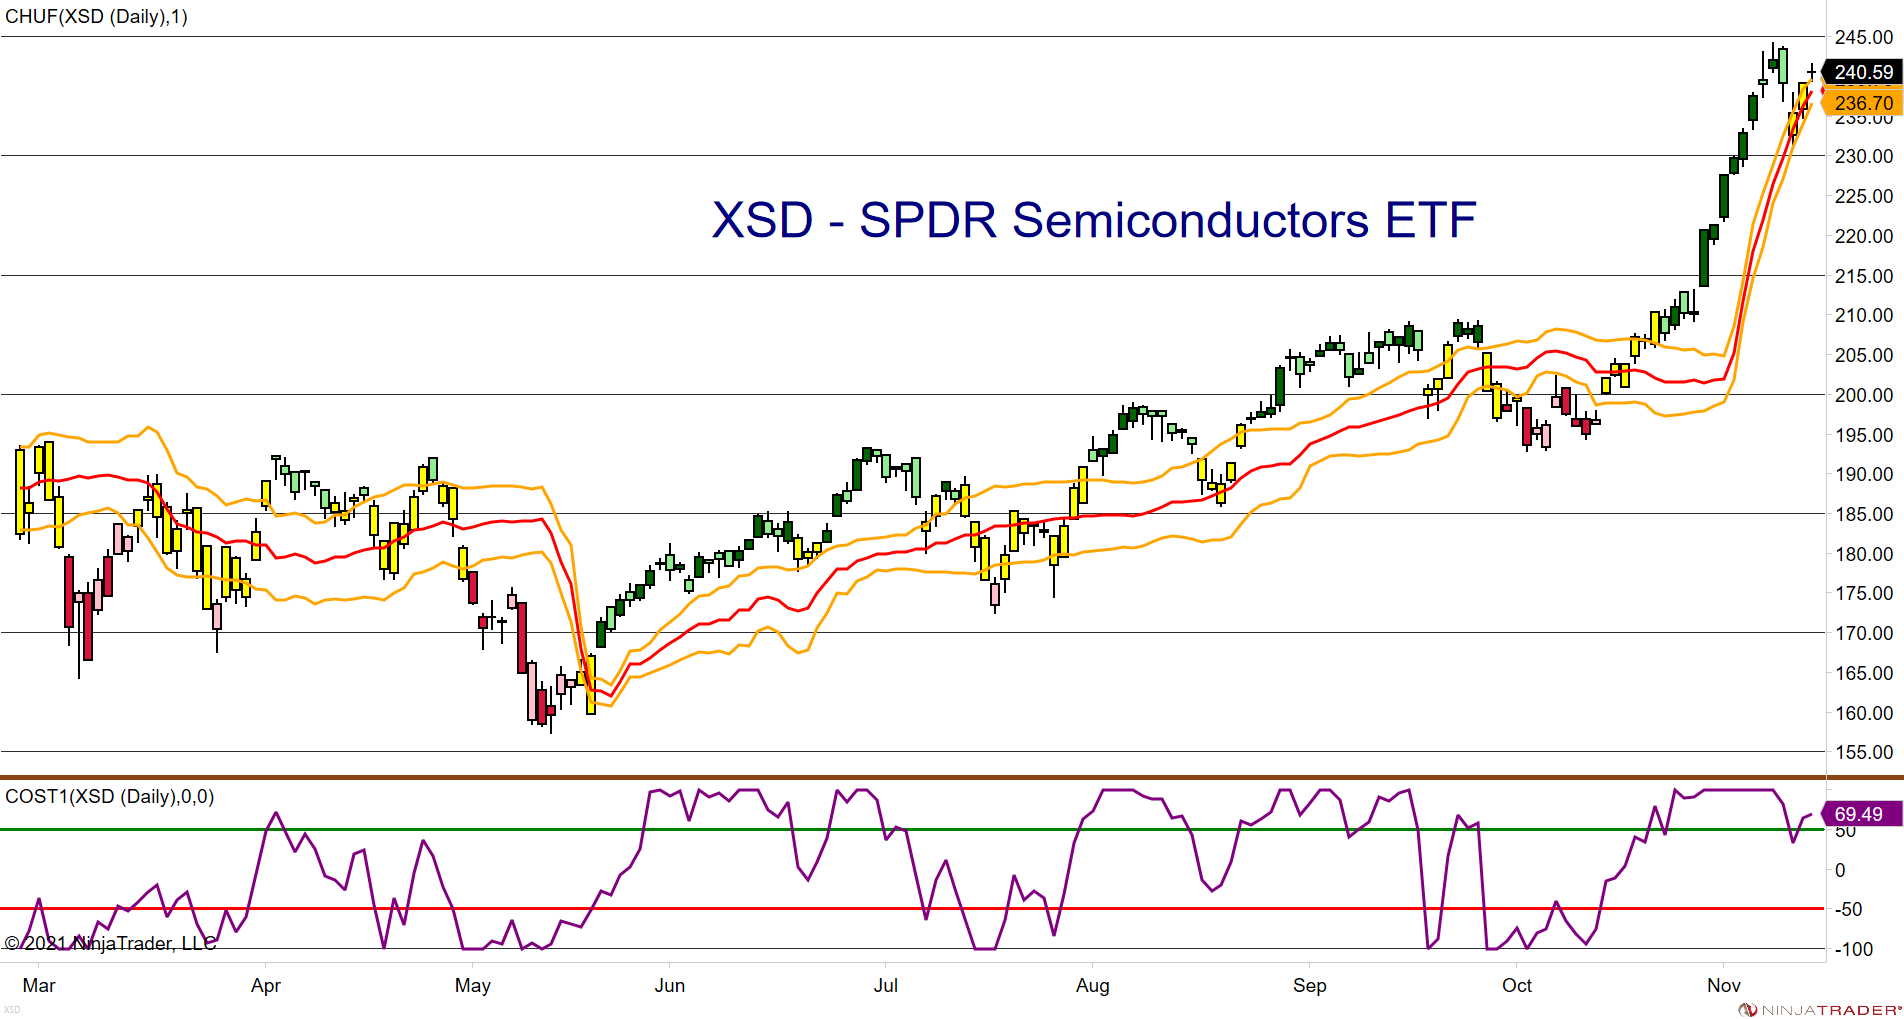
After all the hand-wringing over chip shortages, it is good to see a vibrant rally in this space. Now a pullback is probably on the horizon, which could be an opportunity for longer-term investors.
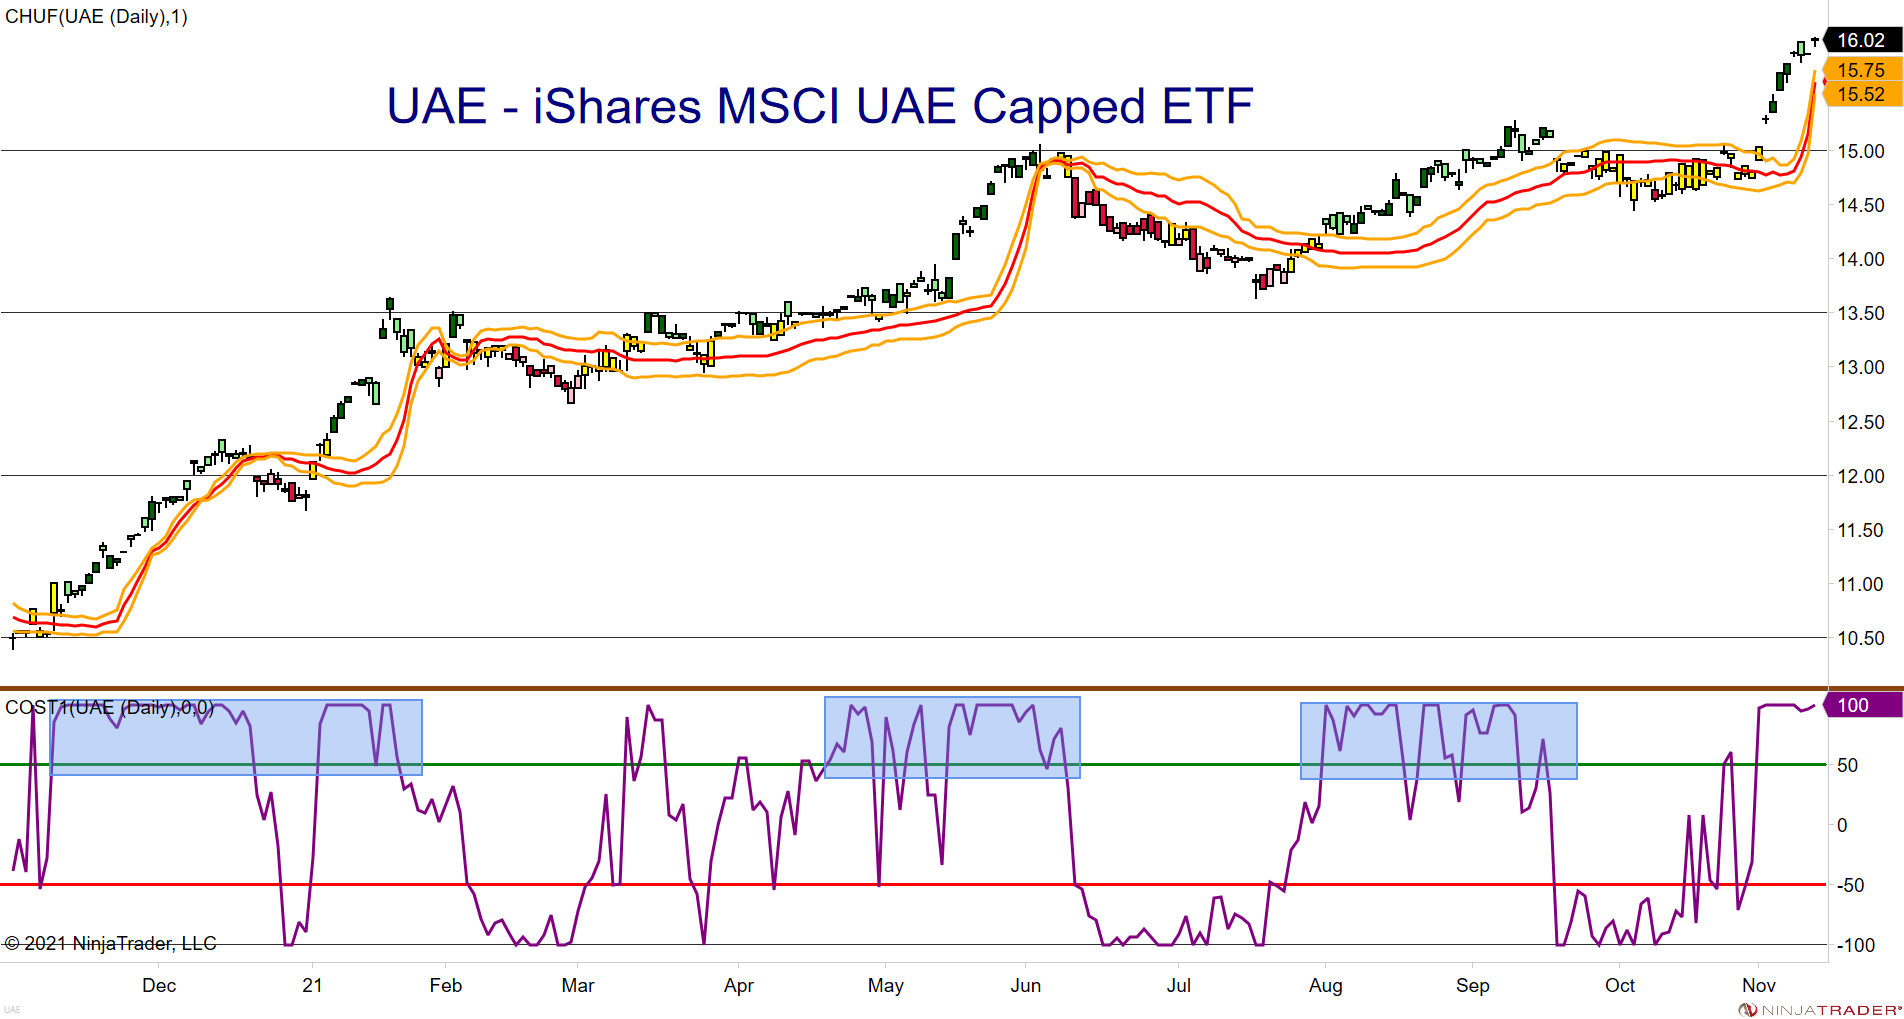
The UAE ETF has had a strong run-up this year, and it has tended to trend well for those who wish to trade it for short-term swings. Our adaptive bands in the chart below show the swing moves well. There are other Middle-East markets on the list as well.
MetaStock Event: Thursday, November 18, 10:00 EST
MetaStock is putting on a week-long event (Nov 15-19), and they have kindly asked me to present some ideas using my new MetaStock package. Registration is free, so please stop by if you have some time. The line-up of speakers offers an astonishing range of trading ideas, so do take a look.
Wrap-up
My posts should give you a good starting point, with context and suggestions if you like to do your research. Then, you can visit my website, chandeindicators.com, for more information and ideas. I hope you will stay tuned and help by subscribing and recommending it to your friends and colleagues.
Thank you for spending some time with me.
Disclaimer
And now for some housekeeping. This publication is for “edutainment,” education, information, and entertainment purposes only. It is not to be construed as investment advice. Past performance is not necessarily indicative of future results. Our disclaimer at chandeindicators.com is included herein by reference.