

Overview
The latest sell-off was triggered by Fed Chair Powell reiterating that it is essential to restore price stability and that a 50-bp hike would be on the table for May. He suggested “front-end loading” the hikes would be acceptable, perhaps opening the door to 75-bp hikes.
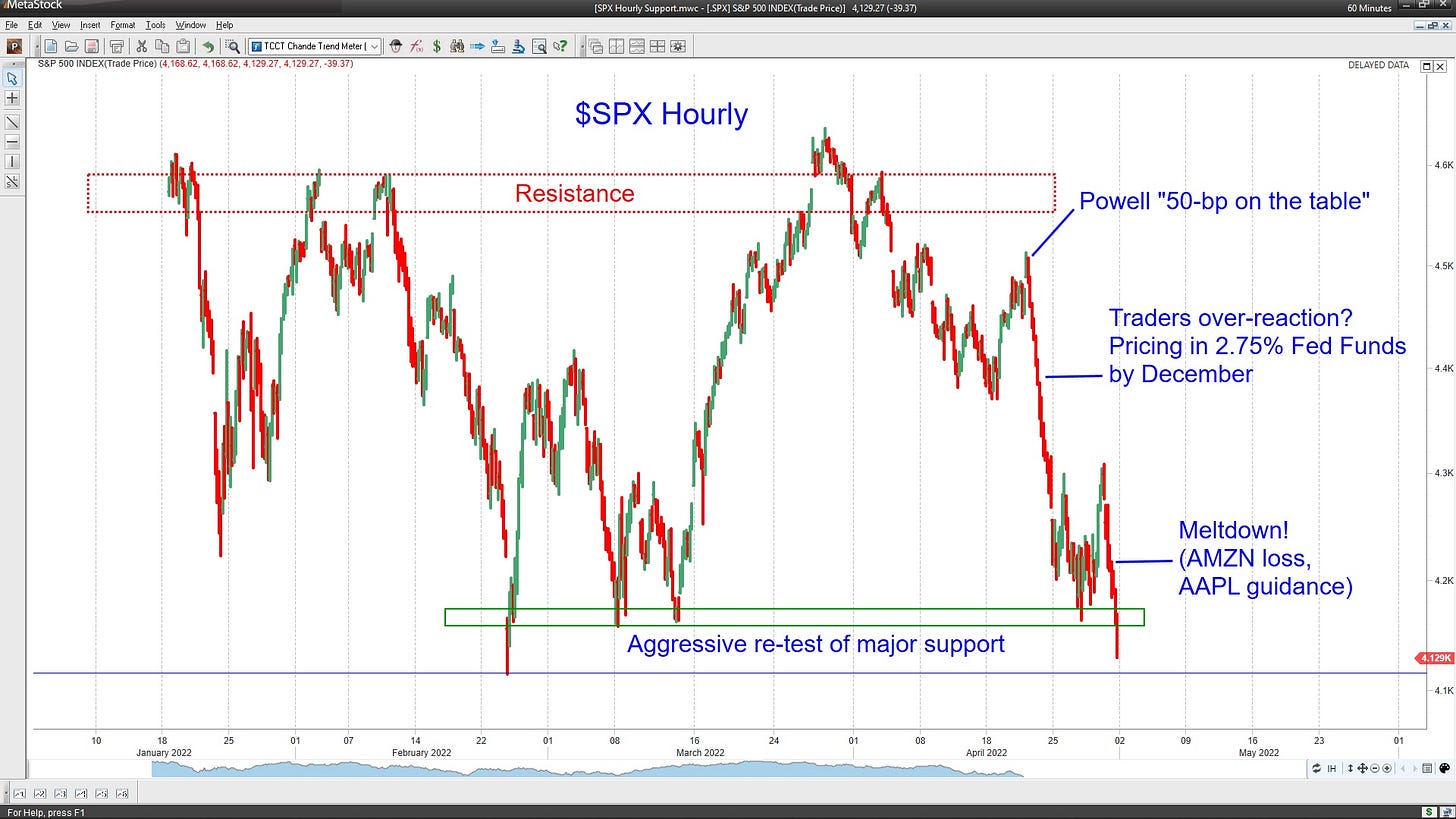
(Chart courtesy MetaStock.) I was clearly wrong to think that the historical bullish tendency in April would hold again this year. Instead, this April’s -8.8% decline was the second-worst since 1950 and the worst since 1970.
Weak earnings and guidance from mega-cap heavyweights Apple, Amazon, and Google did not help the top-heavy cap-weighted S&P-500 index.
It may be August before we get any meaningful resolution to the four current crises convulsing the market: inflation and the FOMC (and the still-evolving pace of rate hikes), China’s Covid-19 clampdown (with its potential for a global slowdown and supply-chain disruptions), the Ukraine invasion (now unlikely to end soon), and the earnings impact of the previous three concerns.
Expect more selling going into the FOMC meeting, and the Powell news conference on Wednesday is now critical to further price evolution.
Key Question
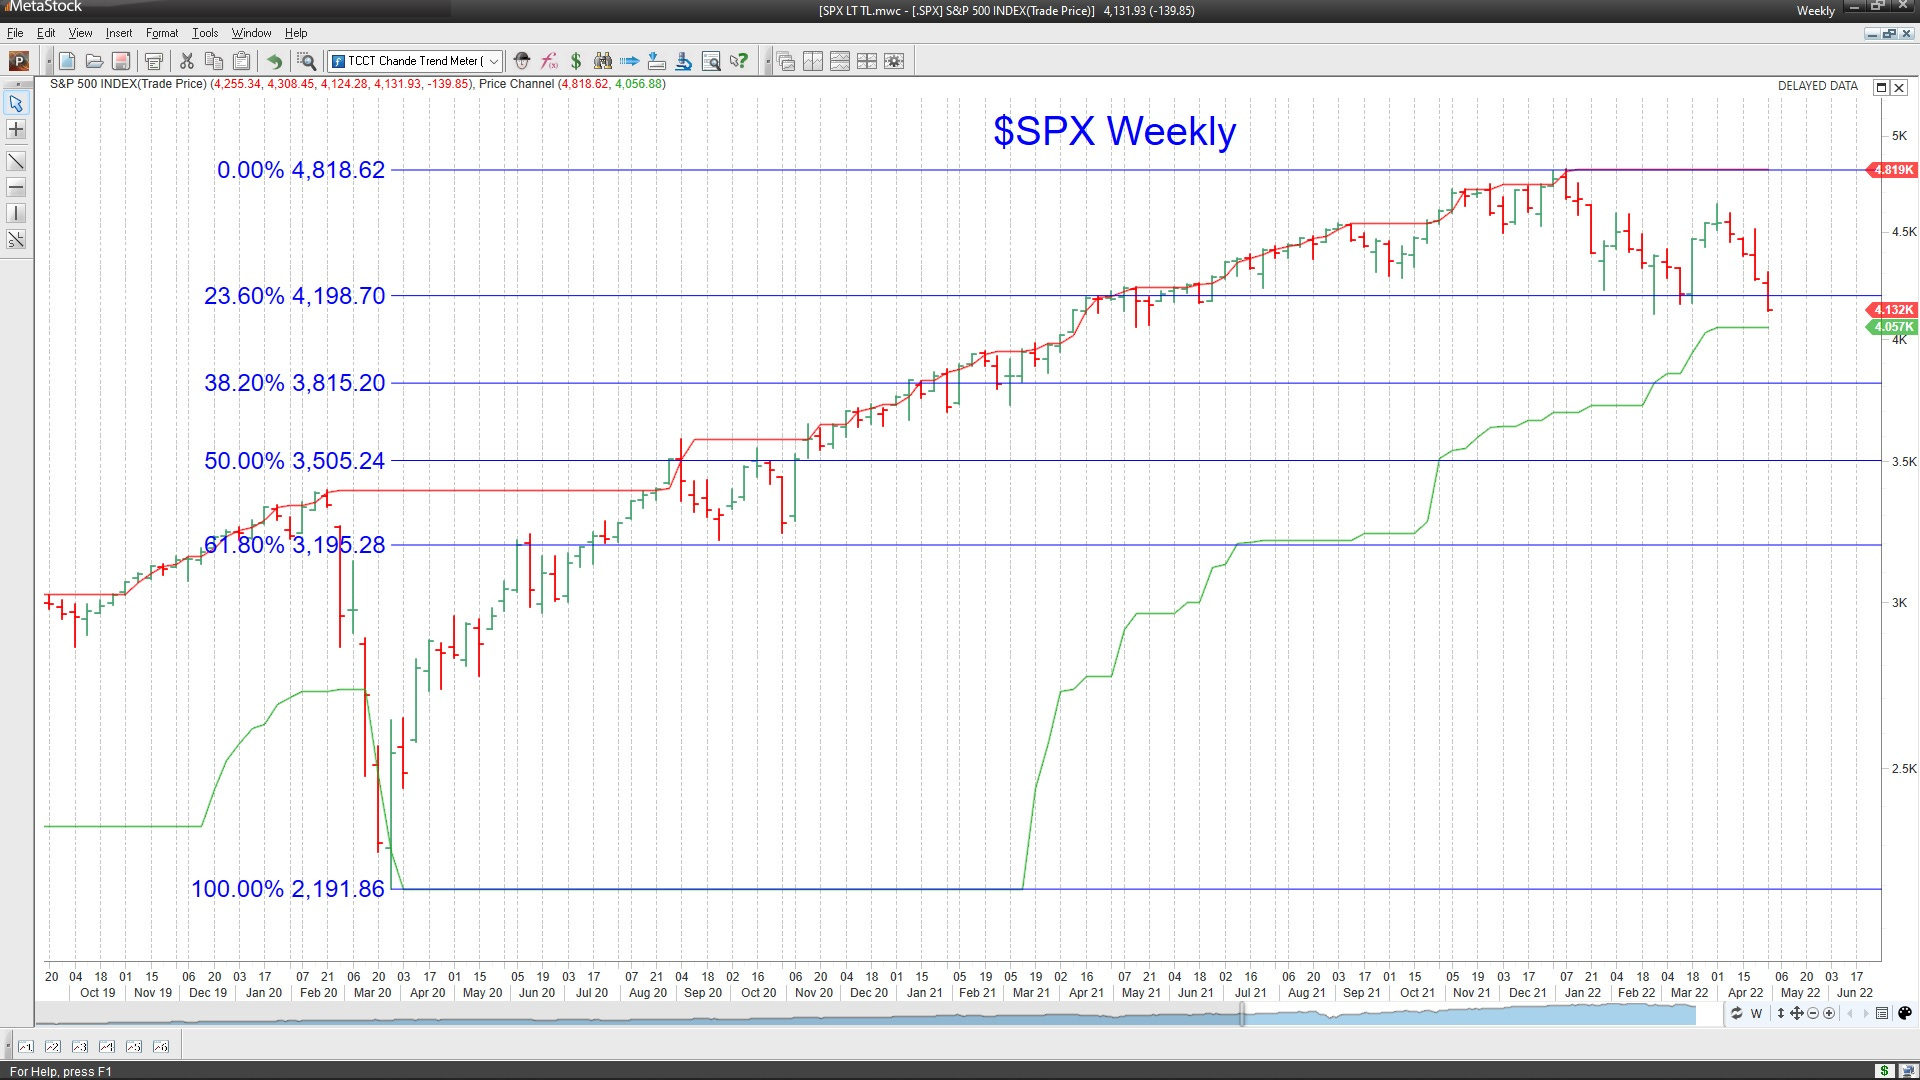
Where can the market go from here? First, we visit long-term Fibonacci charts to identify levels that traders will be watching. We also look at the $SPX using the Chande Trend Meter to see how many stocks still have meaningful trends since it is usually a contrary indicator when this number is less than 10 percent.
Performance Summary
US Fed Chair comments on April 21 about a 50-bp rate hike being “on the table” for their May meeting (May 3-4) should not have come as a surprise, but apparently, traders were happy to over-react. The market seemed headed to complete the head-and-shoulders pattern we suggested two posts ago, but the Powell comments were the excuse for the reversal day and subsequent follow-through selling (more than 90% of stocks trading lower), which turned many technicians on Wall Street very bearish. Now weak quarterly performance by tech titans has knocked an important pillar of support for this market.

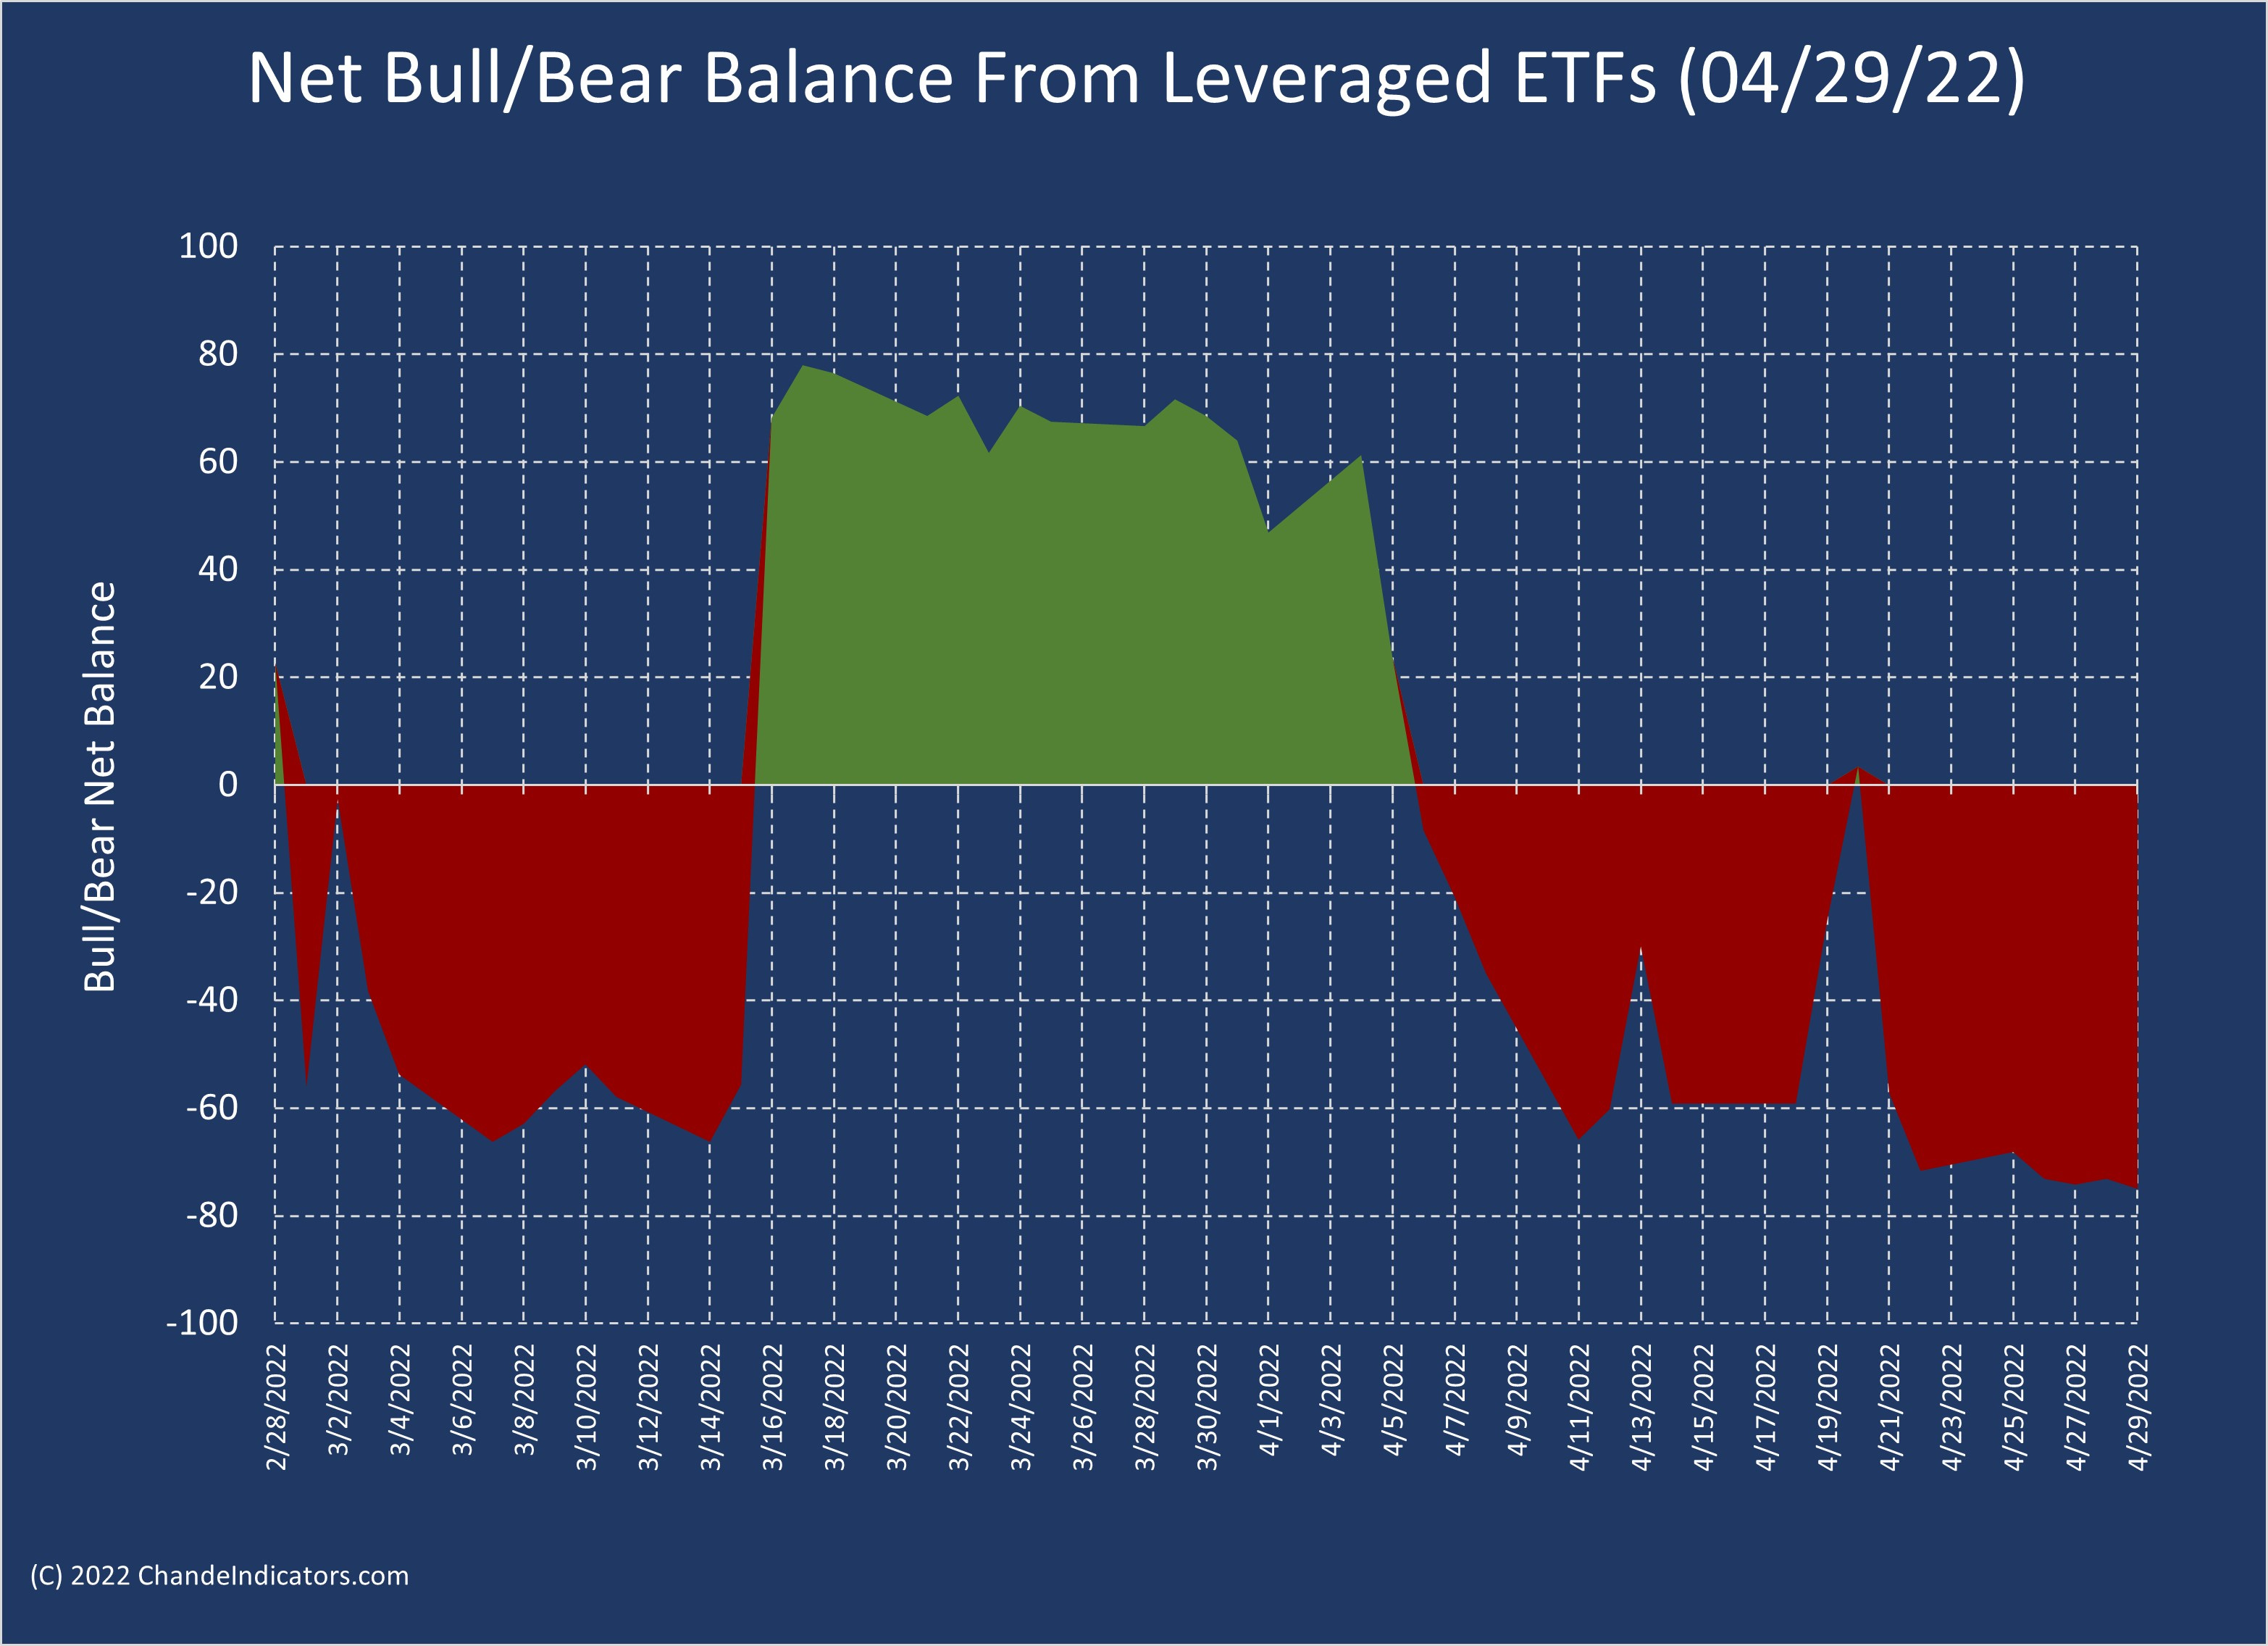
Our Net Bull/Bear balance has been remarkably on the bearish side throughout the most recent selloff. As noted in my April 14 post, I expected the bearishness to continue because this indicator had dipped below -60. Instead, the net bull/bear balance ended the week below -70, implying a powerful bearish trend.
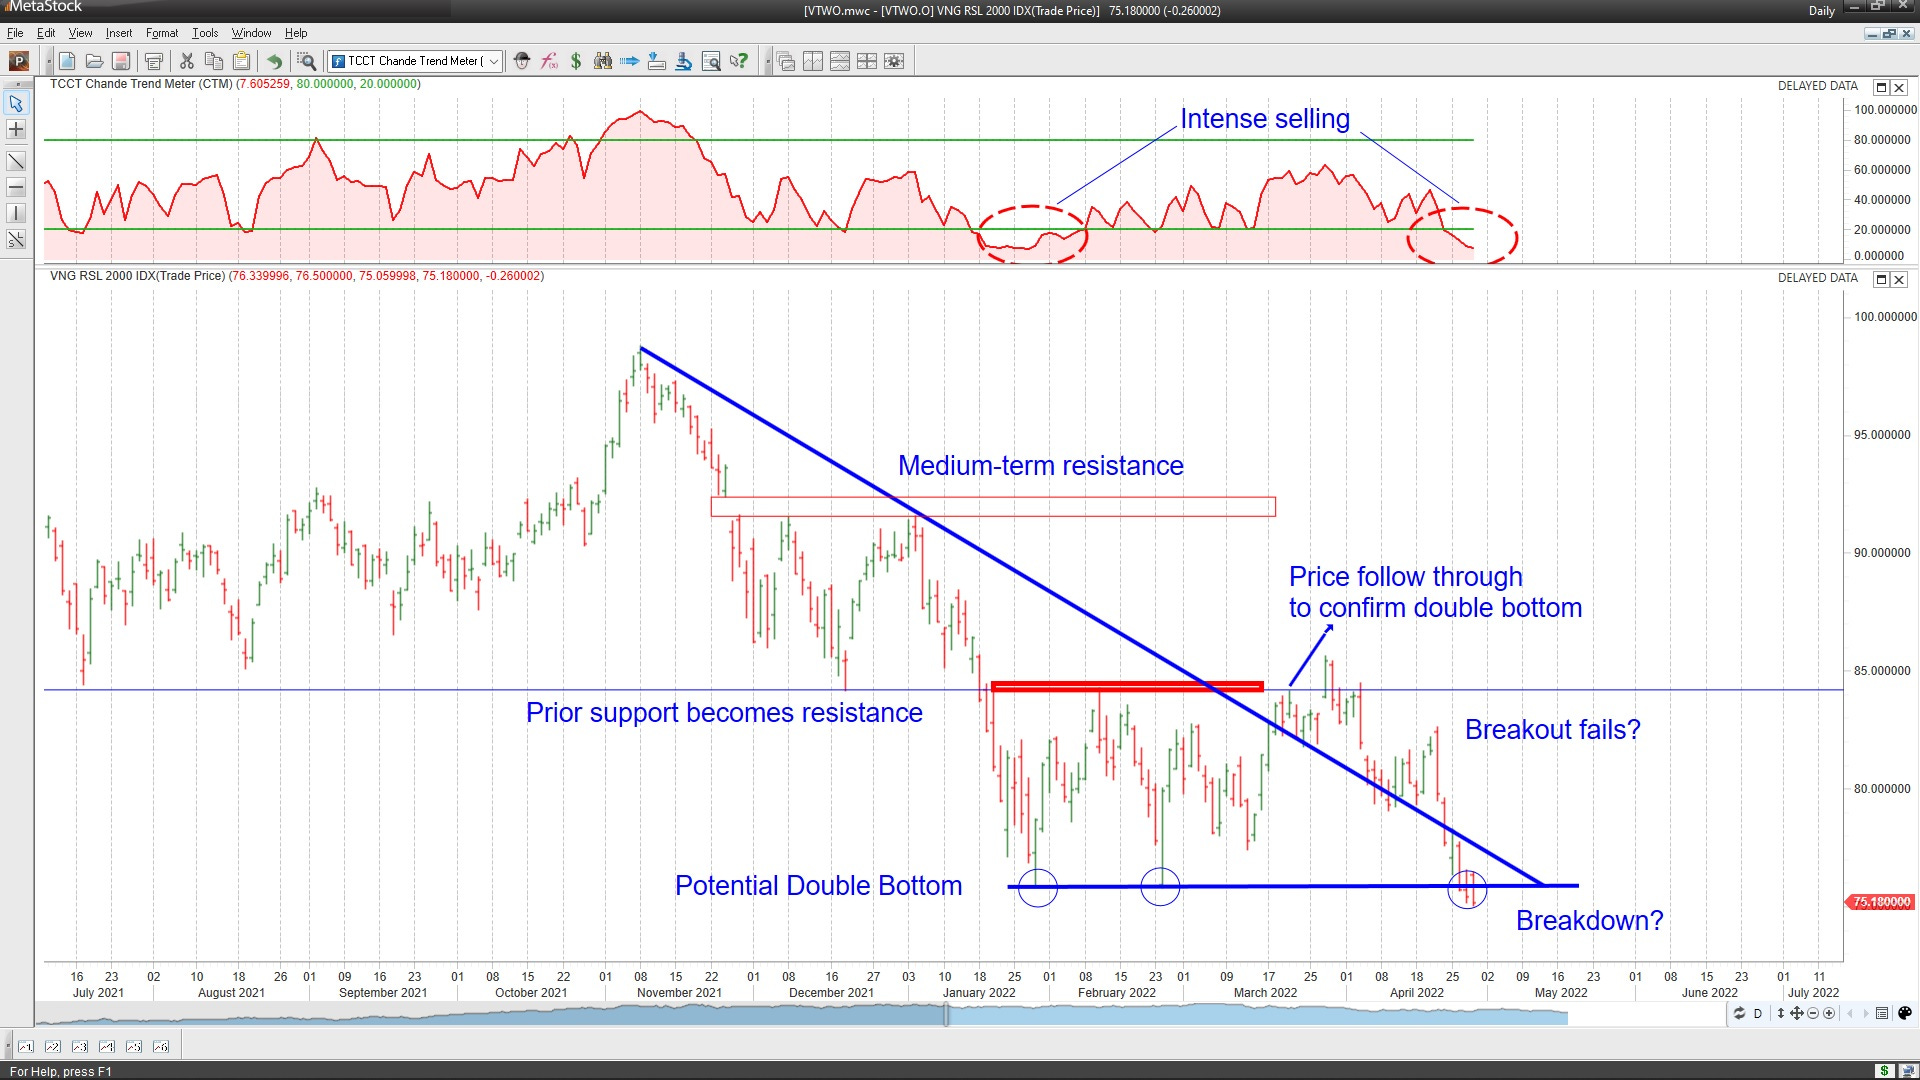
The broad market took it on the chin as well. We have used the Vanguard Russell 2000 ETF (VTWO) proxy for the broad market. We had noted earlier the failure to breakout above the 84. Now the sell-off is on the brink of a major breakdown, or more pleasantly, a triple bottom. The major wirehouses are leaning towards a bear market.
What Next?
The heavy selling makes it hard to keep the trend evolution in perspective. However, there is little doubt the short-term trend is bearish, and the longer-term trend has pointed lower for some time, though $SPX prices remain range-bound, between say 4100-4650.
First, the Net Bull/Bear balance points to continuing the bearish trend. Second, fear of a fierce Fed will drive thinking through at least Wednesday of next week. Third, the $VIX index is still below the levels seen at the prior lows, so we can see more selling before it hits nearby resistance.
One key is to watch the US Treasury 2-year Note futures, which have been used as a proxy for the Fed’s intentions. FOMC Chair Powell said, “Our goal is to use our tools to get demand and supply back in synch, so that inflation moves down and does so without a slowdown that amounts to a recession.” Clearly, the FOMC is not looking at demand destruction as the tool to rein in inflation, but traders seem to be thinking just that as they try to get ahead of the FOMC.

Traders will look at Fibonacci retracements to identify support, so we use the $SPX weekly chart to plot a few key levels for reference. The chart below shows that the S&P-500 has not yet reached the 38.2% retracement level (3815.2), which would amount to a -20.8% decline, consistent with many Wall Street technicians. However, we have the 50-week low before that, which could offer some support.
I used the MetaStock explorer to search the S&P-500 universe of 505 stocks for those with Chande Trend Meter (CTM) values > 80. It’s hard to believe with the heavy selling, but 27 stocks met this criterion. Defensive names (Altria, Campbell Soup, Coke, Kellogg, Hormel) top the list, though, in expectation of a strong summer travel season, we see United, Delta, and Hilton. So as a contrary indicator, we should recognize that the market is due for an oversold bounce since only 27/505 (~5%) had meaningful uptrends.

Wrap-up
My posts should give you a good starting point, with context and suggestions if you like to research. Then, you can visit my website, chandeindicators.com, for more information and ideas. I hope you stay tuned and help by subscribing and recommending it to your friends and colleagues.
Thank you for spending some time with me.
Disclaimer
And now for some housekeeping. This publication is for “edutainment,” education, information, and entertainment purposes only. It is not to be construed as investment advice. Past performance is not necessarily indicative of future results. Our disclaimer at chandeindicators.com is included herein by reference.