


A Stock Picking Tool
We show you how to navigate a stock picker's market.

Overview
Early in the week, the market showed some sign of stabilization, as the broader indexes, such as the NY Composite and small-cap indexes, were up more than the large-cap S&P-500 index.
On Thursday, the report of a 7.5% surge in consumer prices led to a sharp sell-off, as Fed President Bullard talked up a 50 basis point increase in Fed Funds rate.
Other Fed presidents pushed back on that idea on Friday, but uncertainty about the path of interest rates is making traders jittery.
Geopolitical risks rose as President Biden urged Americans to leave Ukraine.
The US 10-year yield climbed above 2%, and Financial stocks rallied. European banking stocks were trending robustly.

Performance Summary
The technology sector wilted as markets worried about the path of interest rates. However, the broader market was a tad bit stronger. The QQQ was down more than 3%, but the broader Russell 2000 ETF was actually up for over a percent for the week. So the concern that mega-cap techs cannot handle higher rates seems overdone.

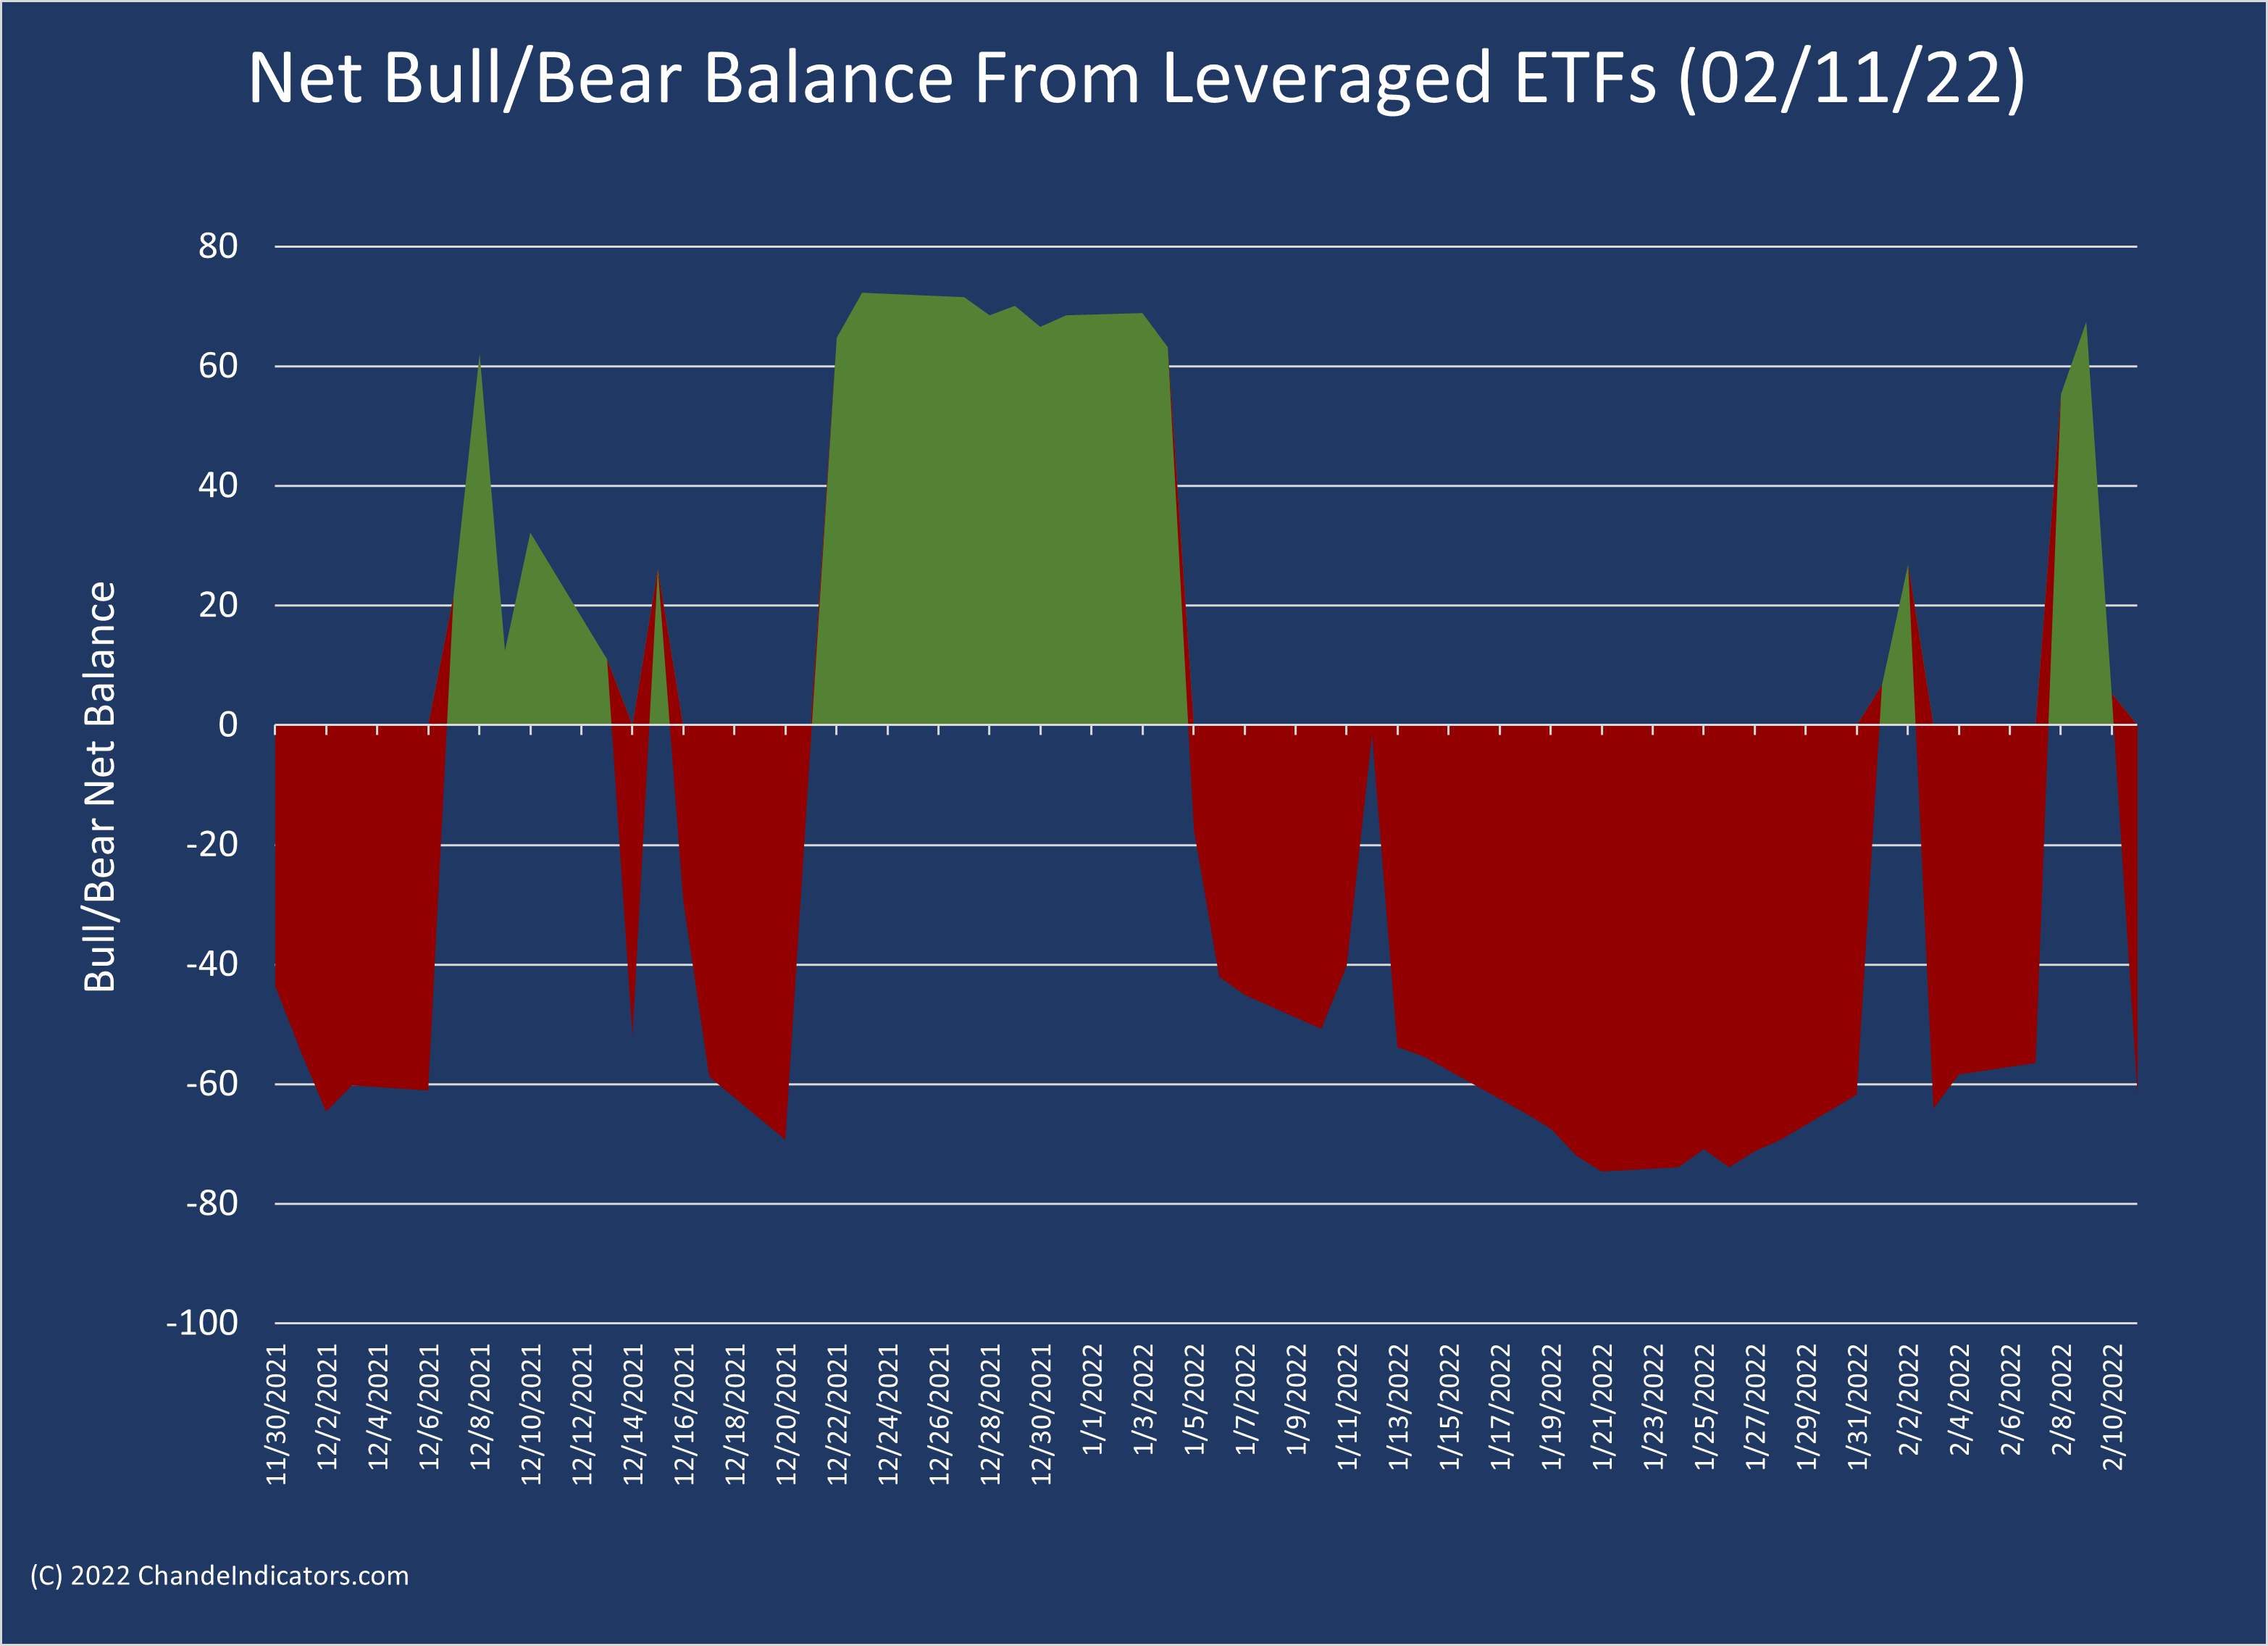
The sensitive net bull-bear balance tells the story of the week. It rose to above 60 early in the week, only to fall below -60 by its end. The chart captures the intense reaction to fears of a rapid interest rate hike.
Navigating a Stock Picker’s Market
One approach to navigating a stock picker’s market is to find trending stocks and to be nimble in your entries and exits. The other is to expand your holding period and buy beaten-down favorites.
The biggest challenge is to identify trending stocks objectively. Here I will focus on using a technical indicator to quantify trend strength. Specifically, I will use my own Chande Trend Meter and the MetaStock Scan Engine to identify strong trending stocks. You can access similar information on my Stock Finder table.
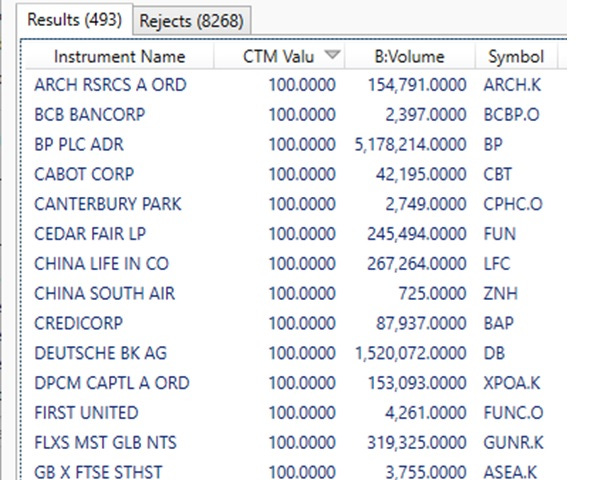
For example, I scanned all NYSE and NASDAQ stocks on Friday morning, about an hour and a half into the trading day, and then ranked the results by the Chande Trend Meter (see big table below). First, only 493/8761 or 5.6% of the stocks had a CTM > 80. Second, notice that the scan is very selective. Third, observe that it covers a vast cross-section of the market to give you many different trading opportunities.

I have trimmed the top table and enlarged it below to make it easier to read. The stocks are shown alphabetically after sorting by CTM. We have a mix of energy and financial companies near the top of the list.
Let us look at the charts for ARCH and BCB. Both are breaking out to new highs. You can trade them with a long-term or short-term approach based on your preference.

I have shown the BCB Bancorp chart with the CTM in the upper panel to show you that the trend strength is measured at 100.

MetaStock Summit Feb 21.
I will be discussing this and other tools at the MetaStock Summit on Feb 21. I will discuss the design of CTM and how you can use trend-following and counter-trend systems to trade many different price patterns. Registration is required. I hope you will stop by.
Wrap-up
My posts should give you a good starting point, with context and suggestions if you like to do research. Then, you can visit my website, chandeindicators.com, for more information and ideas. I hope you stay tuned and help by subscribing and recommending it to your friends and colleagues.
Thank you for spending some time with me.
Disclaimer
And now for some housekeeping. This publication is for “edutainment,” education, information, and entertainment purposes only. It is not to be construed as investment advice. Past performance is not necessarily indicative of future results. Our disclaimer at chandeindicators.com is included herein by reference.