

A New Diversified Trend Index
A New Diversified Trend Index
A new trend index for the stock market as a whole.

Overview
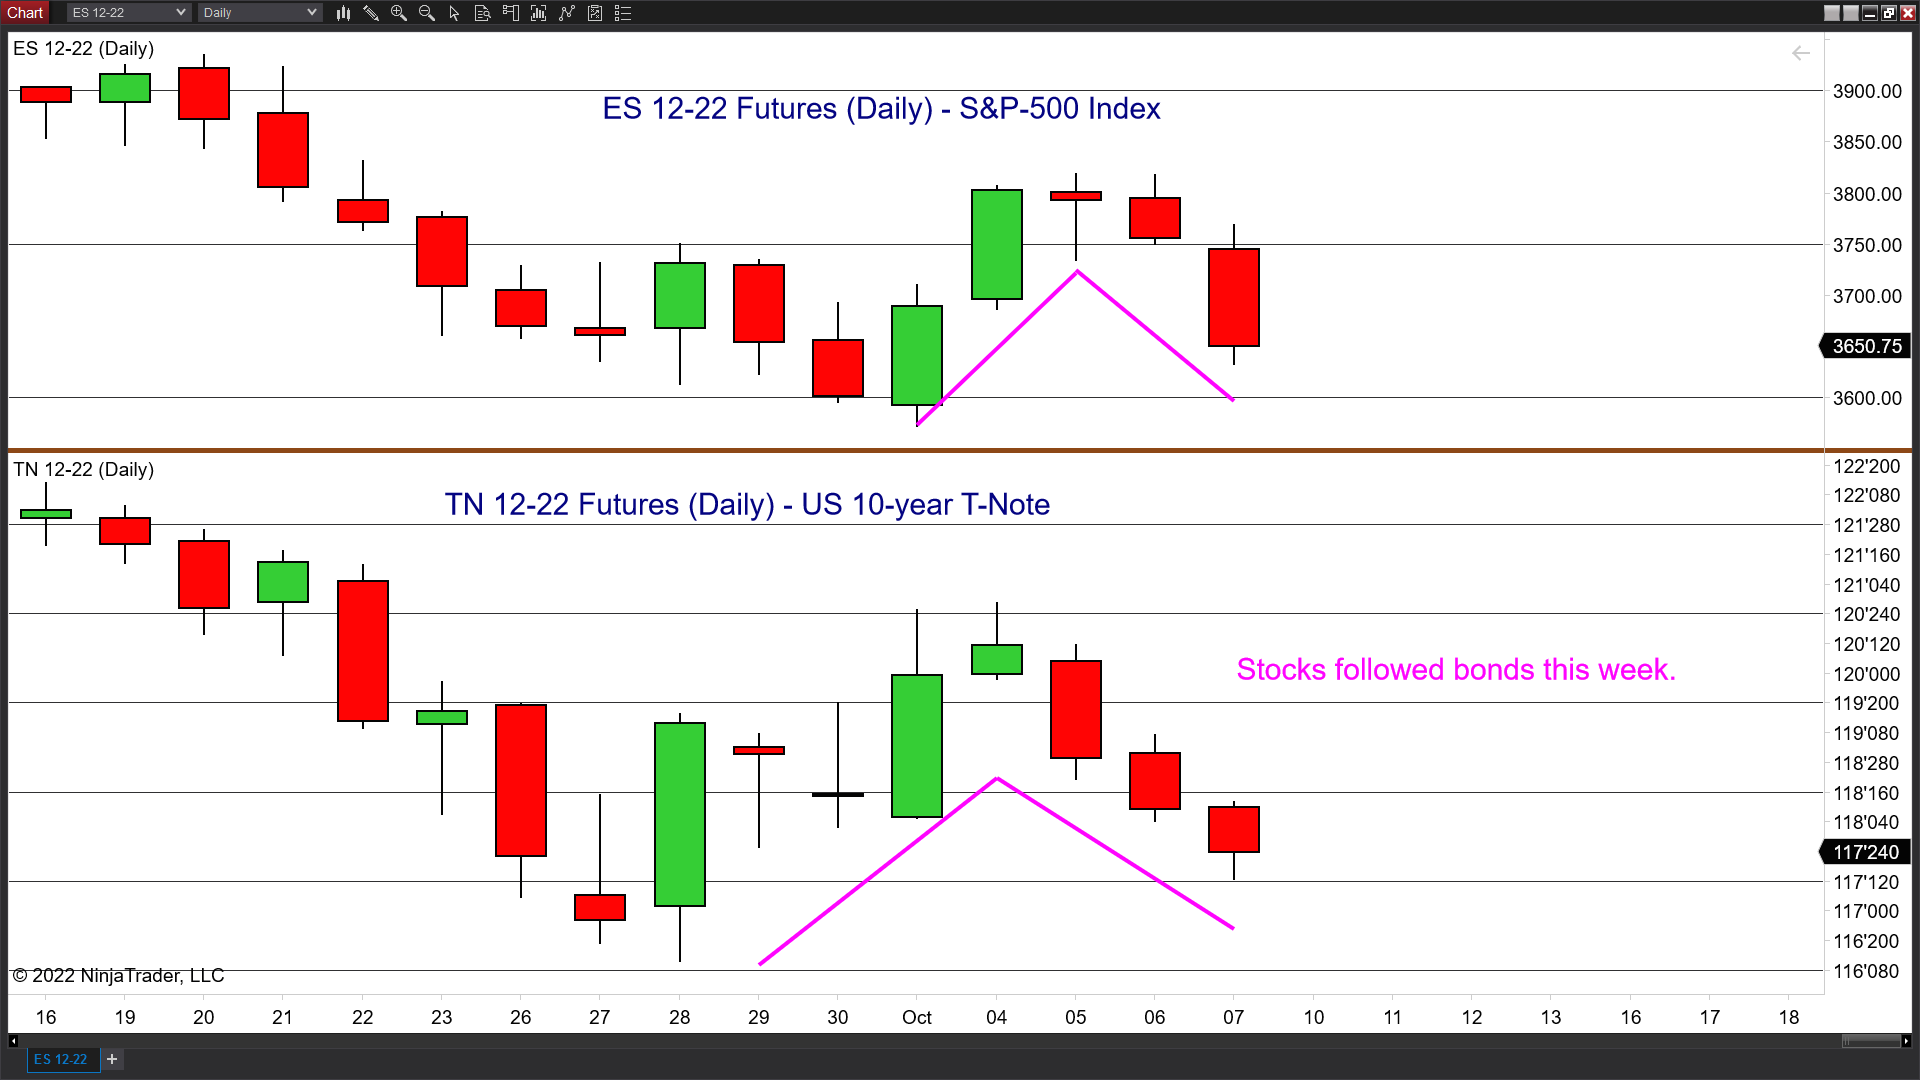
Stocks and bonds moved in tandem this week. The spillover from the Bank of England’s intervention led to a massive (~6.2%) rally on Monday and Tuesday. Then as yields rose and bonds fell, stocks slipped as well.
The September unemployment report showed the unemployment rate at 3.5%, with an estimated 263,000 payroll jobs created. In addition, BLS revised the data upward for the prior two months by 11,000 jobs. Thus, the economy remains strong.
The latest unemployment data imply via Sahm’s Rule that the FOMC will keep raising rates. (The FOMC would like unemployment to rise toward the red line below.) Thus, this means stocks will not bottom just yet.

Key Question
Does the rally this week (and the resulting momentum divergence) mean that stocks are trying to form a bottom? The answer is “Yes, No, Maybe.” This week's market action showed that bulls face event risk from key upcoming CPI, PCE, GDP, and earnings reports before the next FOMC meeting in early November. I report on a new composite trend index to simplify entry decisions into market trends.

Performance Summary

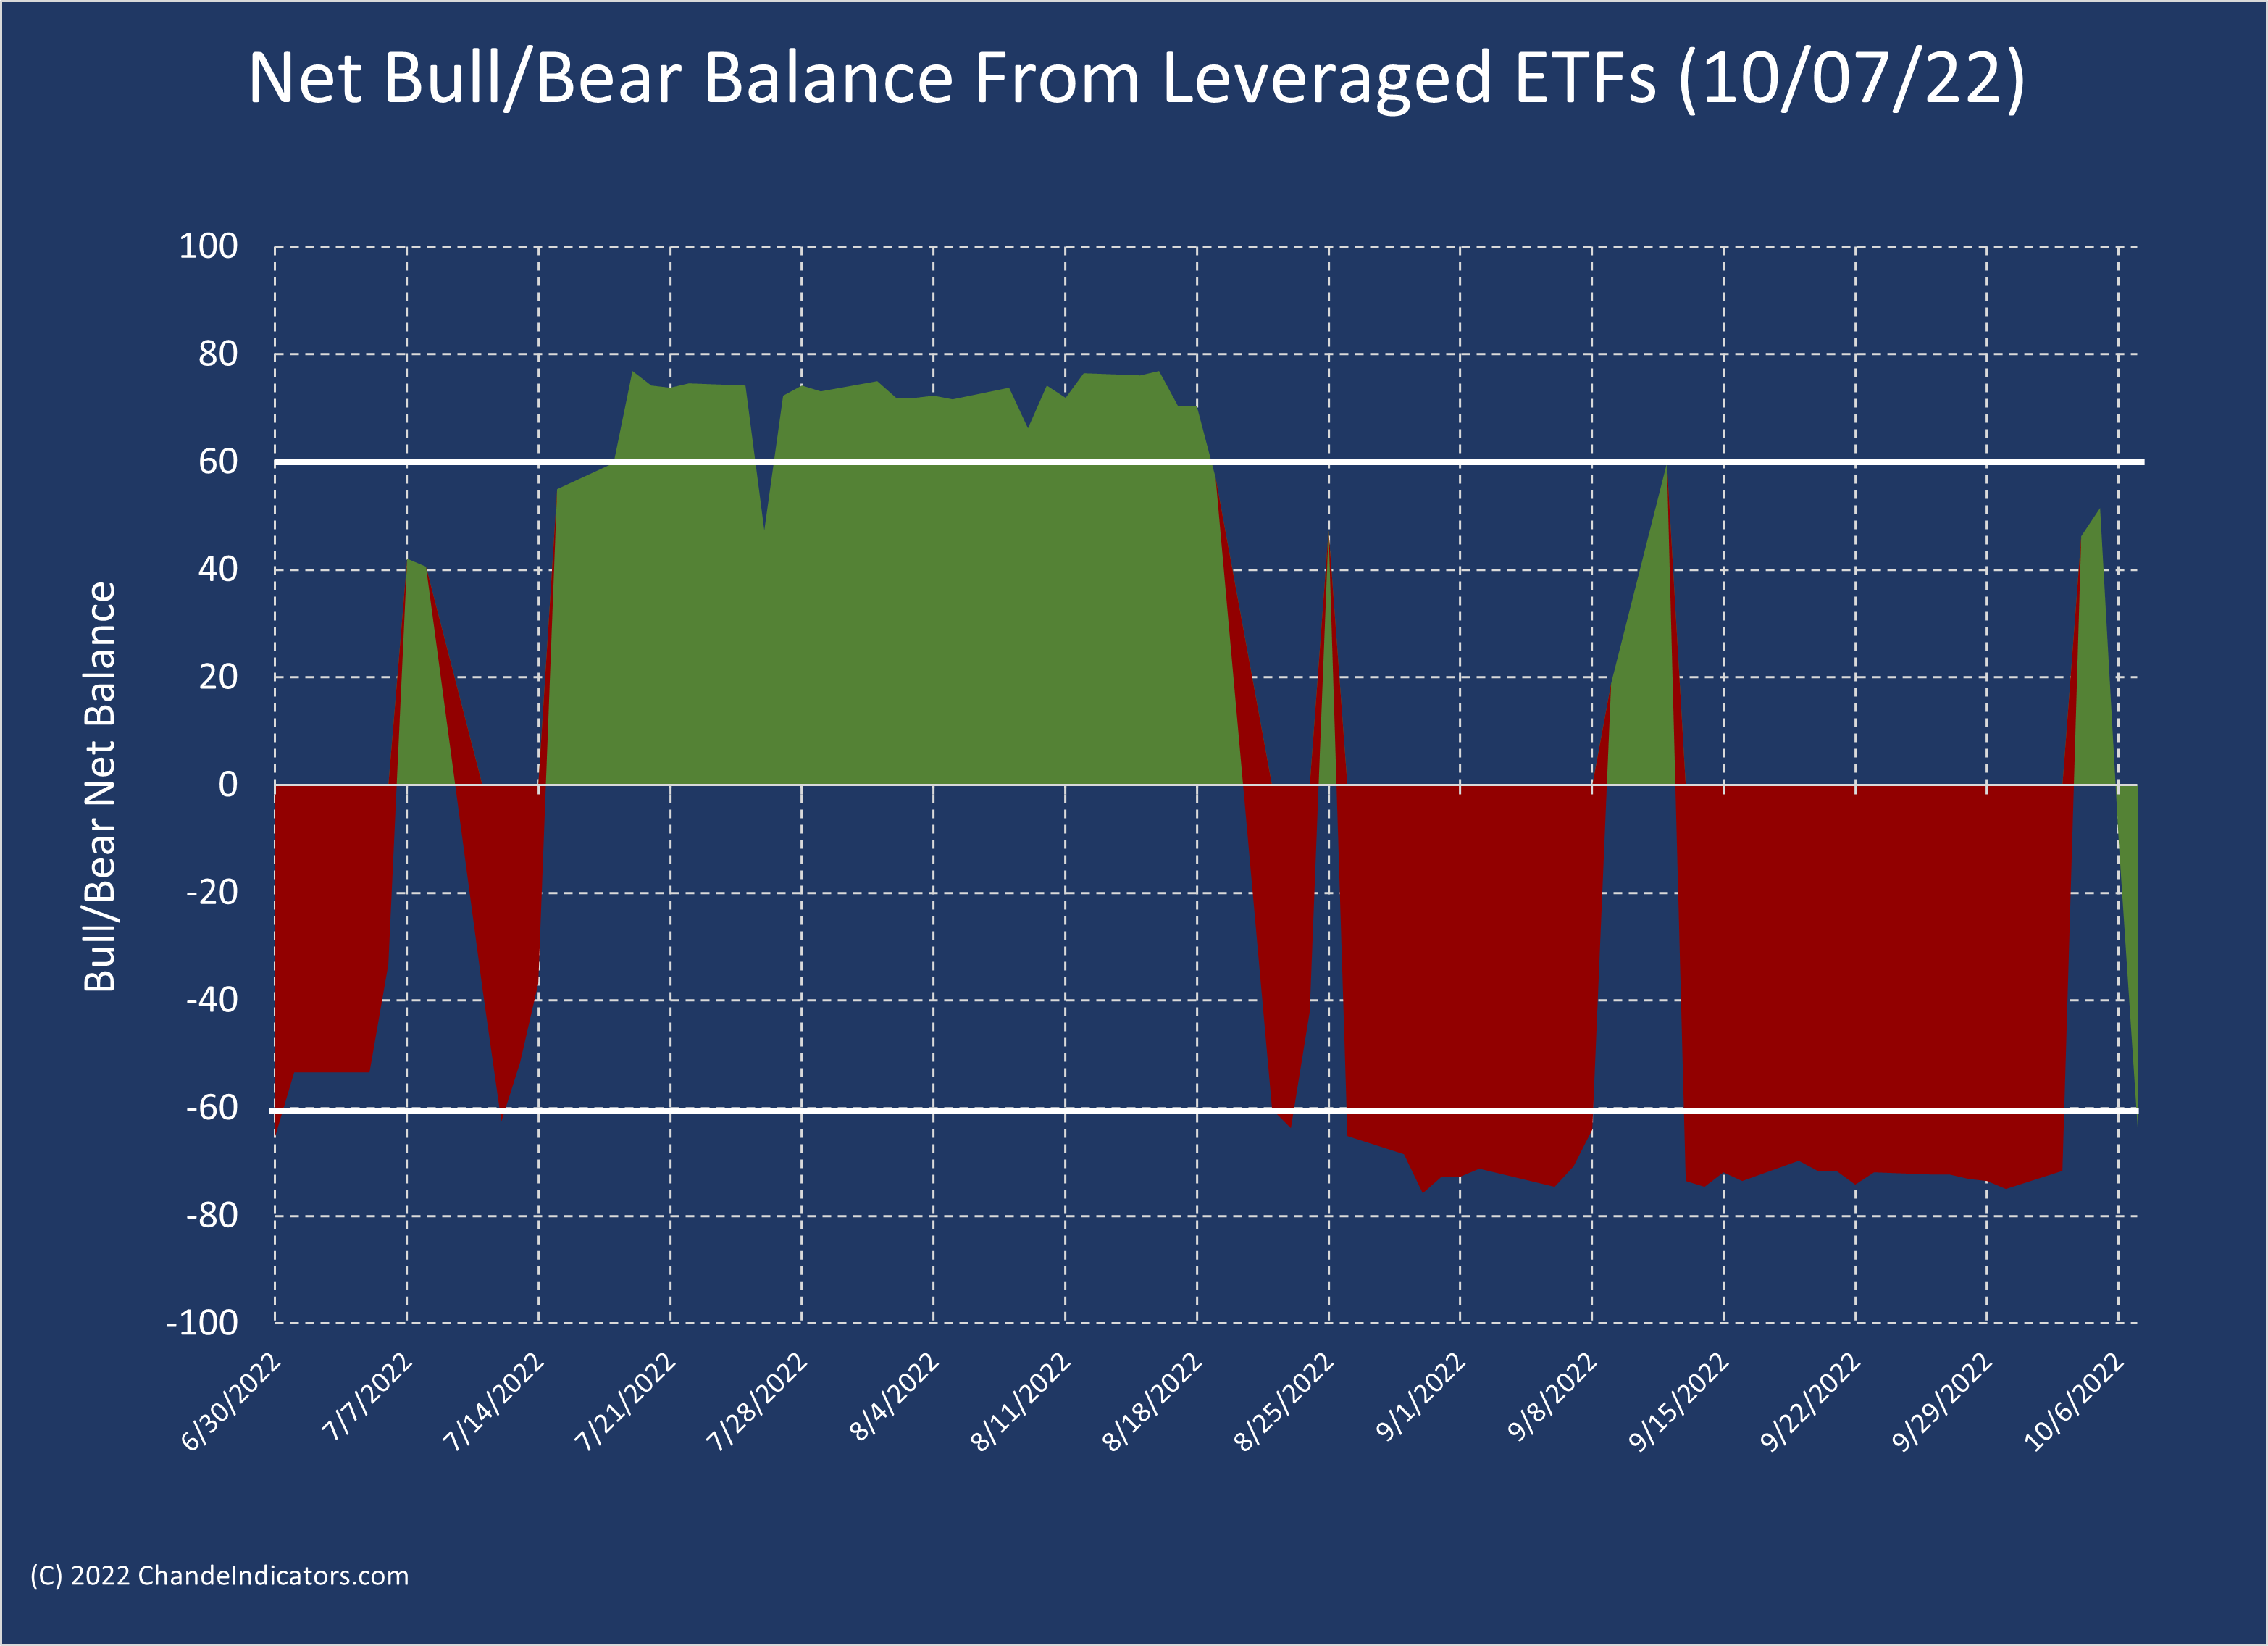
We had a generally positive market week thanks to a nearly 6.2% surge in the S&P-500 through Wednesday. The Net Bull/Bear balance whipsawed but did not get above the +60 level earlier in the week. Instead, it closed at ~-64, suggesting more selling to come next week. It is precisely to smooth out some of these surges in the Net Bull/Bear balance that I thought of the DTI below.
The Diversified Trend Index
My search for trend indicators continues, and I have previously designed indicators to measure the trend strength of a single instrument, such as the Chande Trend Meter (CTM).
My Net Bull/Bear balance (based on 34 leveraged ETFs) has identified the path of least resistance for the market. By design, it is sensitive to price action, which the leveraged ETFs tend to exaggerate.
I have developed two other indicators in this iteration to smooth out the signals from the Net Bull/Bear balance. The first used a simple moving average crossover model and applied it to a dozen capitalization-weighted and style-based Vanguard ETFs to understand what is happening to growth vs. value and large vs. small capitalization stocks. (The growth/value rotation is often a risk-on/risk-off signal.) The second indicator looks at the S&P-500 index, so it analyzes large-cap action using smoothed bands.
The two new indexes are also on a +100 to -100 scale so that I can combine them with the Net Bull/Bear calculations. The composite index thus includes three distinct measurement styles and three different groups of ETFs so that it can vary from +300 to -300 and quantify the market's trendiness. I am calling the new composite the Diversified Trend Index, and here is what it has looked like since last August.

As designed, the index has a neutral zone from -100 to +100, where the market changes direction or consolidates. Powerful uptrends lead to values of +300 (downtrends lead to -300). You can use it as aggressively or as conservatively as you like. In the limit, you can only trade values of +300 or -300. Or, you can go long when it crosses above -100 from near -300. Conversely, you could exit or short when it falls below +100 (after being above +200). There is no correct answer, but the DTI is designed primarily as a flexible entry signal.
For example, last year, the market had a strong trend in October/November of 2021, and the DTI touched +300 on 10/15/21. However, the index fell below +100 on 11/23/2021, a day after the peak on 11/22/2021.
The move around the June 2022 low is also interesting. The DTI crossed above -100 on July 6 (about ten days after the low) and touched +300 on July 27. After that, it turned negative and fell below +100 on July 23. Again, so relatively slow to change directions, but you can change the points of reference as needed to get faster entries.
If you want, we can simplify the calculations further by truncating values at +100 and -100, so we only want to know when we are out of “neutral.” Therefore, during powerful moves, the truncated index remains at +100 or -100.

The DTI thus quantifies the trend strength and direction of the market as a whole and is designed to provide flexible approaches to entry decisions.
The index is imperfect but objective and diversified over different computational methods and data. It will touch +300 again soon, and we won’t have to speculate about divergences.
Wrap-up
My posts should give you a good starting point, with context and suggestions if you like to research. Then, you can visit my website, chandeindicators.com, for more information and ideas. I hope you stay tuned and help by subscribing and recommending it to your friends and colleagues.
Thank you for spending some time with me.
Disclaimer
And now for some housekeeping. This publication is for “edutainment,” education, and entertainment, not for investment advice. Past performance is not necessarily indicative of future results. Our disclaimer at chandeindicators.com is included herein by reference.