

A Look Back
A Look Back
Did I get anything right over the past year?

Overview
I will deviate from the usual format for this week’s post. Instead, I thought I would review my posts to see what (if anything) I got right. As it turned out, I did alright.
I will also give handy links to evergreen tutorials and my trading presentations on YouTube.
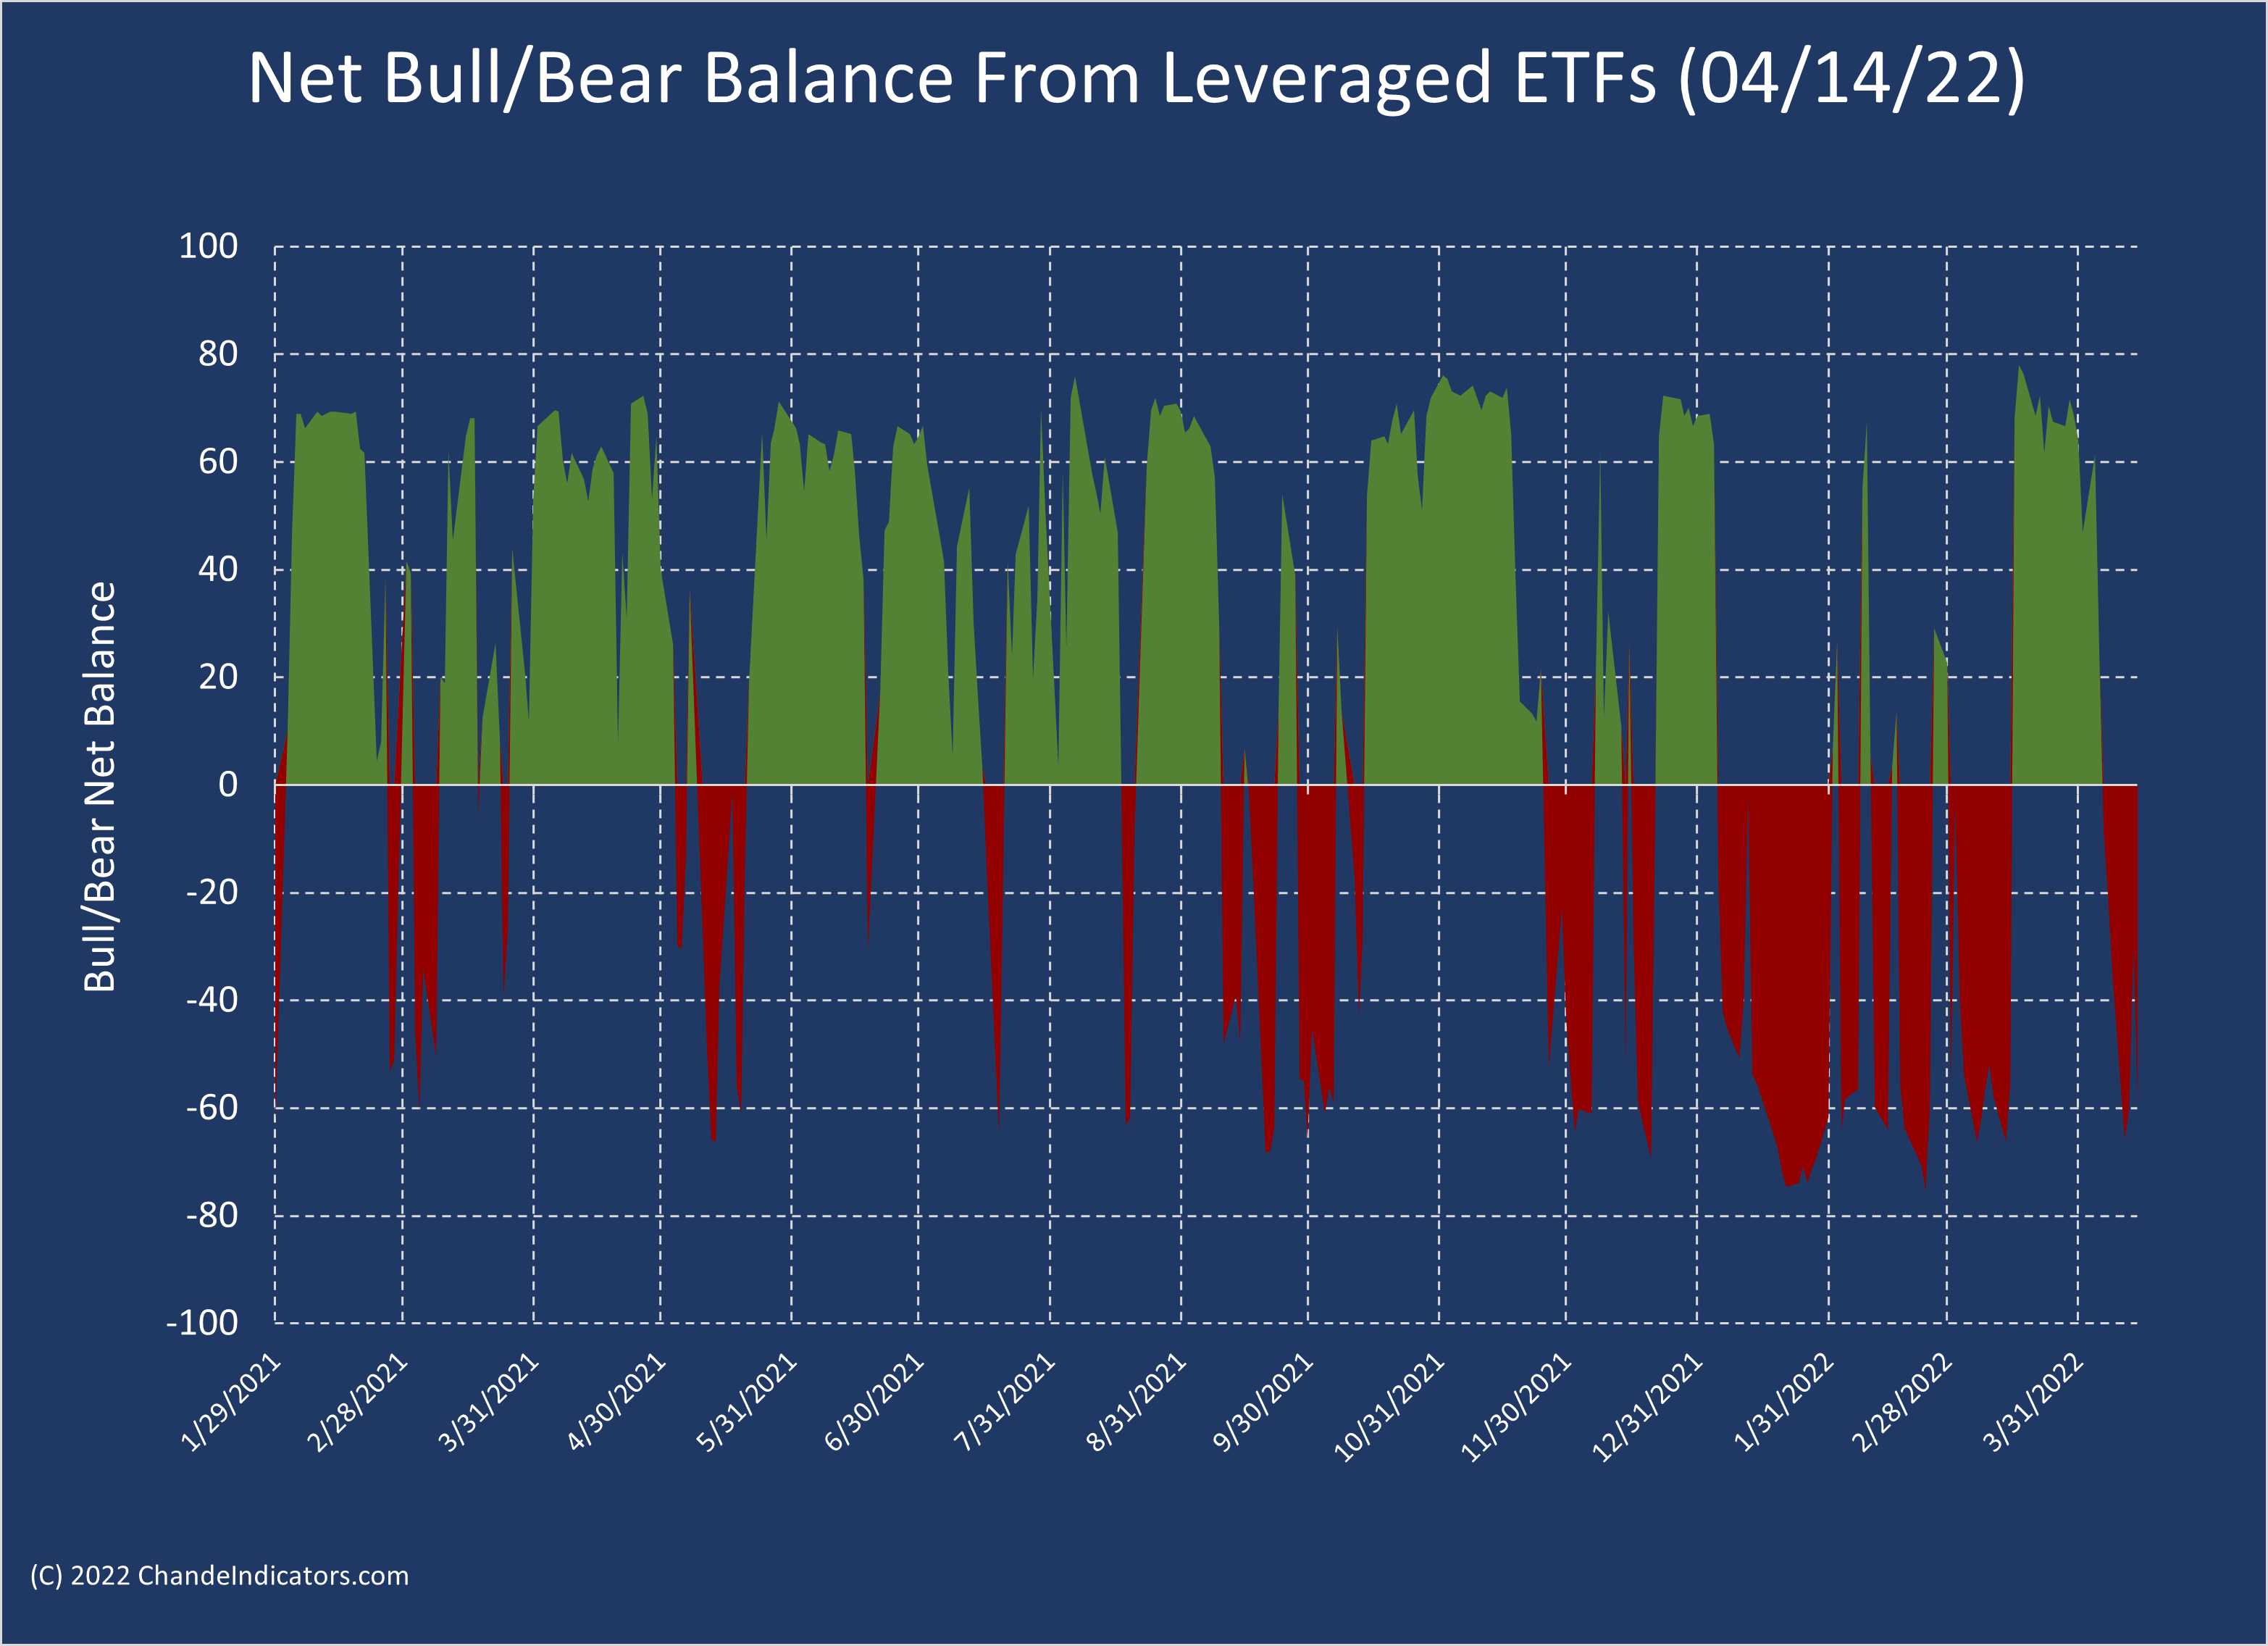
A more than 14-month view of the Bull/Bear Net Balance indicator below shows that it nicely tracked the market's pulse, rapidly changing directions when necessary but holding steady beyond +/-60 during trends.
A Few Big Ones
Feds Talk, Bonds Balk (March 19, 2021)
US 10-year yields face strong technical resistance as they approach 2 percent. The 50 percent Fibonacci retracement plus prior support acting as resistance implies a significant barrier, at least in the near term. The 1.85%-2.15% range should be a band of strong overhead resistance for US 10-year Treasury yields.
US 10-year yield was at 1.74% in March and ended December at 1.52%; the yield did not exceed 2.15% until March 15, 2022.
Bitcoin Stumbles, Stocks Bumble (April 23, 2021)
BTCUSD had stumbled from a high near 65,000; it bottomed near 29,000 in late July.
Commodities Calling (May 07, 2021)
I examined many commodity ETFs that went on to have great rallies. See also the more recent, Ruble Rubble = Commodities Crunch.
Placed resistance around 60,000; November high ~69,000; current ~40,000.
Market Rally Broadens (May 28, 2021)
With QQQ ~ 332, expected QQQ breakout in mid-June; new high June 14; September 07 high ~381 (+14.7%); November high ~407 (+22.5%).
70% Change of Gains Through Year-End (July 02, 2021)
SPX ~4352; Dec 31 close ~4766 (+9.5%).
Is a 10% Market Decline Imminent (August 20, 2021)
Hence, optimistically, even though there may be some precautionary selling ahead of the Fed meeting, we may not get the 10% decline many expect.
SPX ~3256; market made new high eight days later.
Market Confirms Key Low (October 15, 2021)
SPX~4471; high in November ~4744.
Rebound + Seasonality = $SPX4800? (October 22, 2021)
SPX ~4550; Dec 30 SPX high ~4809.
How to Exploit Rising Rates (January 07, 2022).
For example, the breakout in the energy sector (XLE) and financial sectors (XLF) should be clear from the charts below.
XLE 60.76; now XLE ~79.44.
Also, the Net Bull/Bear balance turned negative, presaging a selloff.
Market Sets Key Low (January 28, 2022)
The critical low near SPX 4222 helped set the benchmark for subsequent tests of low.
Conflict Enters a High-Risk Period (March 11, 2022)
Identified the double bottom forming in VTWO, the triple top in VIX index and the break in the Ukraine invasion-driven surge in oil prices, which helped form the most recent lows.
A Stinker
Year-Ahead QQQ Forecast (July 16, 2021).
I used linear regression channels when QQQ ~339 to project a year-ahead range of 420-520. The subsequent high was 407, so I came close. However, the most recent trades are near 342, with an intervening low near 318: not so great.
I also published many lists, which are impossible to review in such a short space, but I am sure they also had a few duds. For example, in my January 07 post, I highlighted XLE and XLF price highs (but with a 2~3 year time frame). Since the post, the XLE has rallied, but the XLF has not. Similarly, the lists have stocks with strong trends; but trends don’t last forever, and in many cases, those trends have probably reversed.
Links to Tutorials
A Stock Picking Tool - using CTM to find stocks.
A Decumulation Primer - how to draw down your retirement nest egg
Chasing Adobe - an introduction to accelerating exits
Replicating Repligen - on finding strong stocks
Trailing Tesla - a tutorial on trailing stops
Ready for Multi-Decade Investing? - very long term investing
Finding LULU - on trading volatility breakouts
YouTube Presentations
Understanding Sector Rotation with CTM
Navigating today’s volatile markets using CTM.
Finding needles in haystacks using highly selective trend-following and counter-trend strategies.
Wrap-up
My posts should give you a good starting point, with context and suggestions if you like to research. Then, you can visit my website, chandeindicators.com, for more information and ideas. I hope you stay tuned and help by subscribing and recommending it to your friends and colleagues.
Thank you for spending some time with me.
Disclaimer
And now for some housekeeping. This publication is for “edutainment,” education, information, and entertainment purposes only. It is not to be construed as investment advice. Past performance is not necessarily indicative of future results. Our disclaimer at chandeindicators.com is included herein by reference.