

A Decumulation Primer
A Decumulation Primer
A brief guide to the formulas for drawing down your retirement nest egg.

Overview
On Monday and Tuesday, the markets bounced energetically off the extreme oversold condition we discussed last week.
In November, inflation was reported at 6.8%, the highest rate in nearly 40 years, but had little effect on trading.
Small-cap stocks found support at the bottom of their nearly year-long trading range. This level must hold for the broader market indexes to rally further.
The US Federal Reserve FOMC meeting next week will set the stage for further moves in the market.
Key Question
As another year ends, a quick financial checkup for those approaching (or in) retirement is in order. How can we help in this effort? By including a brief primer on decumulation - the plan to draw down your assets in retirement.

Performance Summary
A positive week in the market and a strong rebound from last week’s selloff. The rebound was led by the mega-cap stocks, with Apple, for example, making new highs.
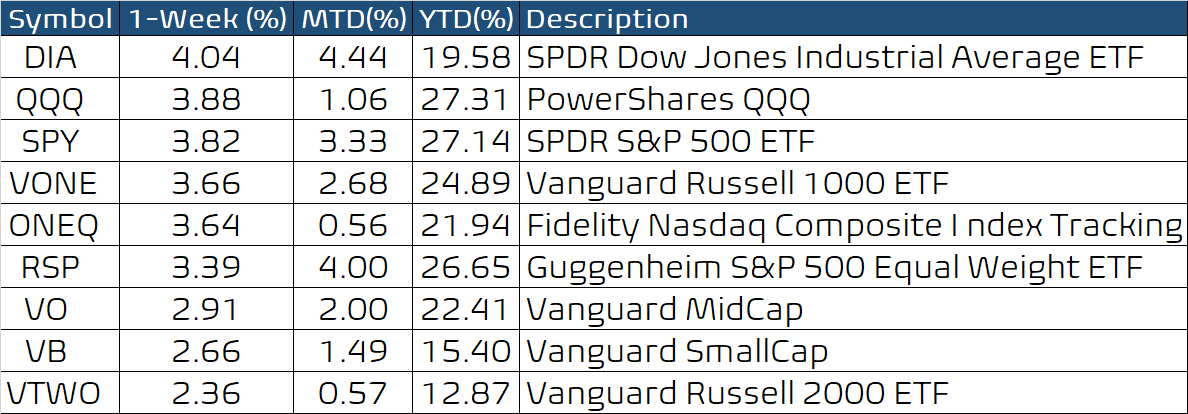
The sensitive net bull/bear balance, based on leveraged and inverse index ETFs, ticked up into positive territory, but the bulls are lacking momentum.

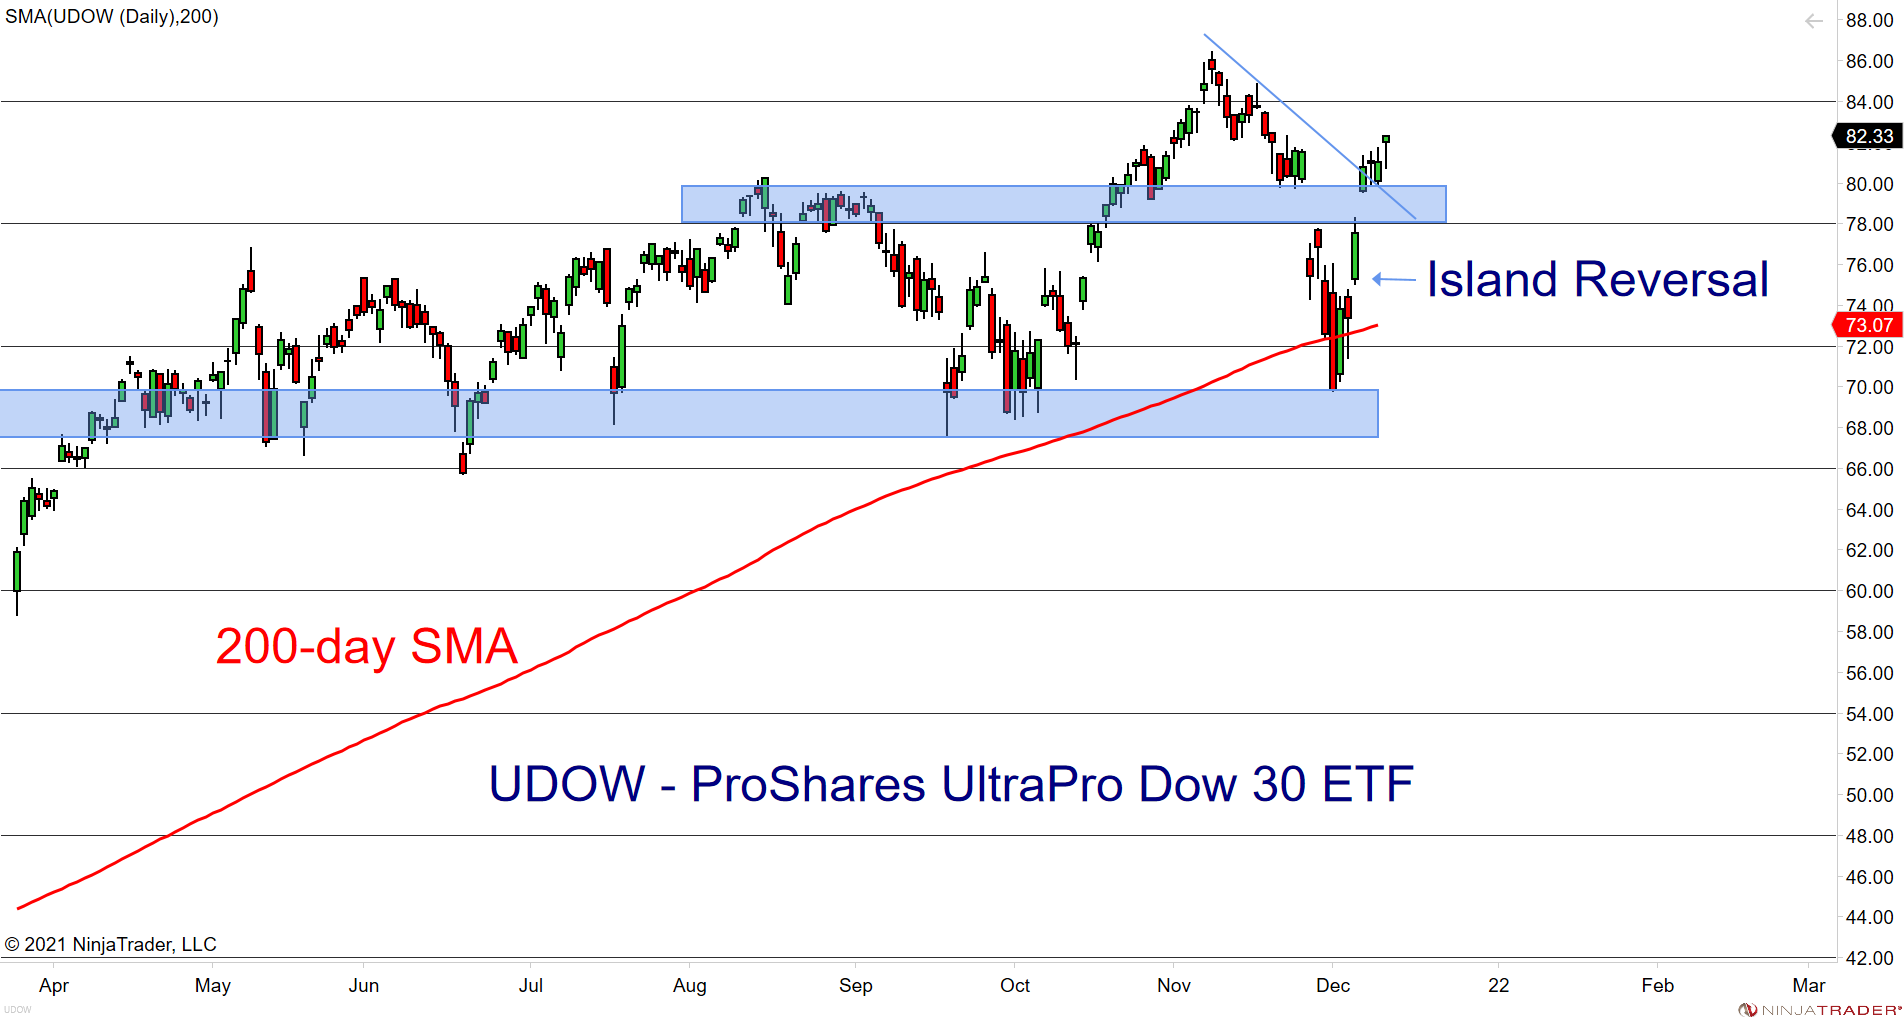
We can summarize the prior selloff and rebound using the following two charts. First, we use UDOW, the ProShares UltraPro Dow 30 leveraged ETF. UDOW fell rapidly below its 200-day average into long-held support between 66-70. Then, it quickly rebounded to produce an island reversal with gaps above 76.
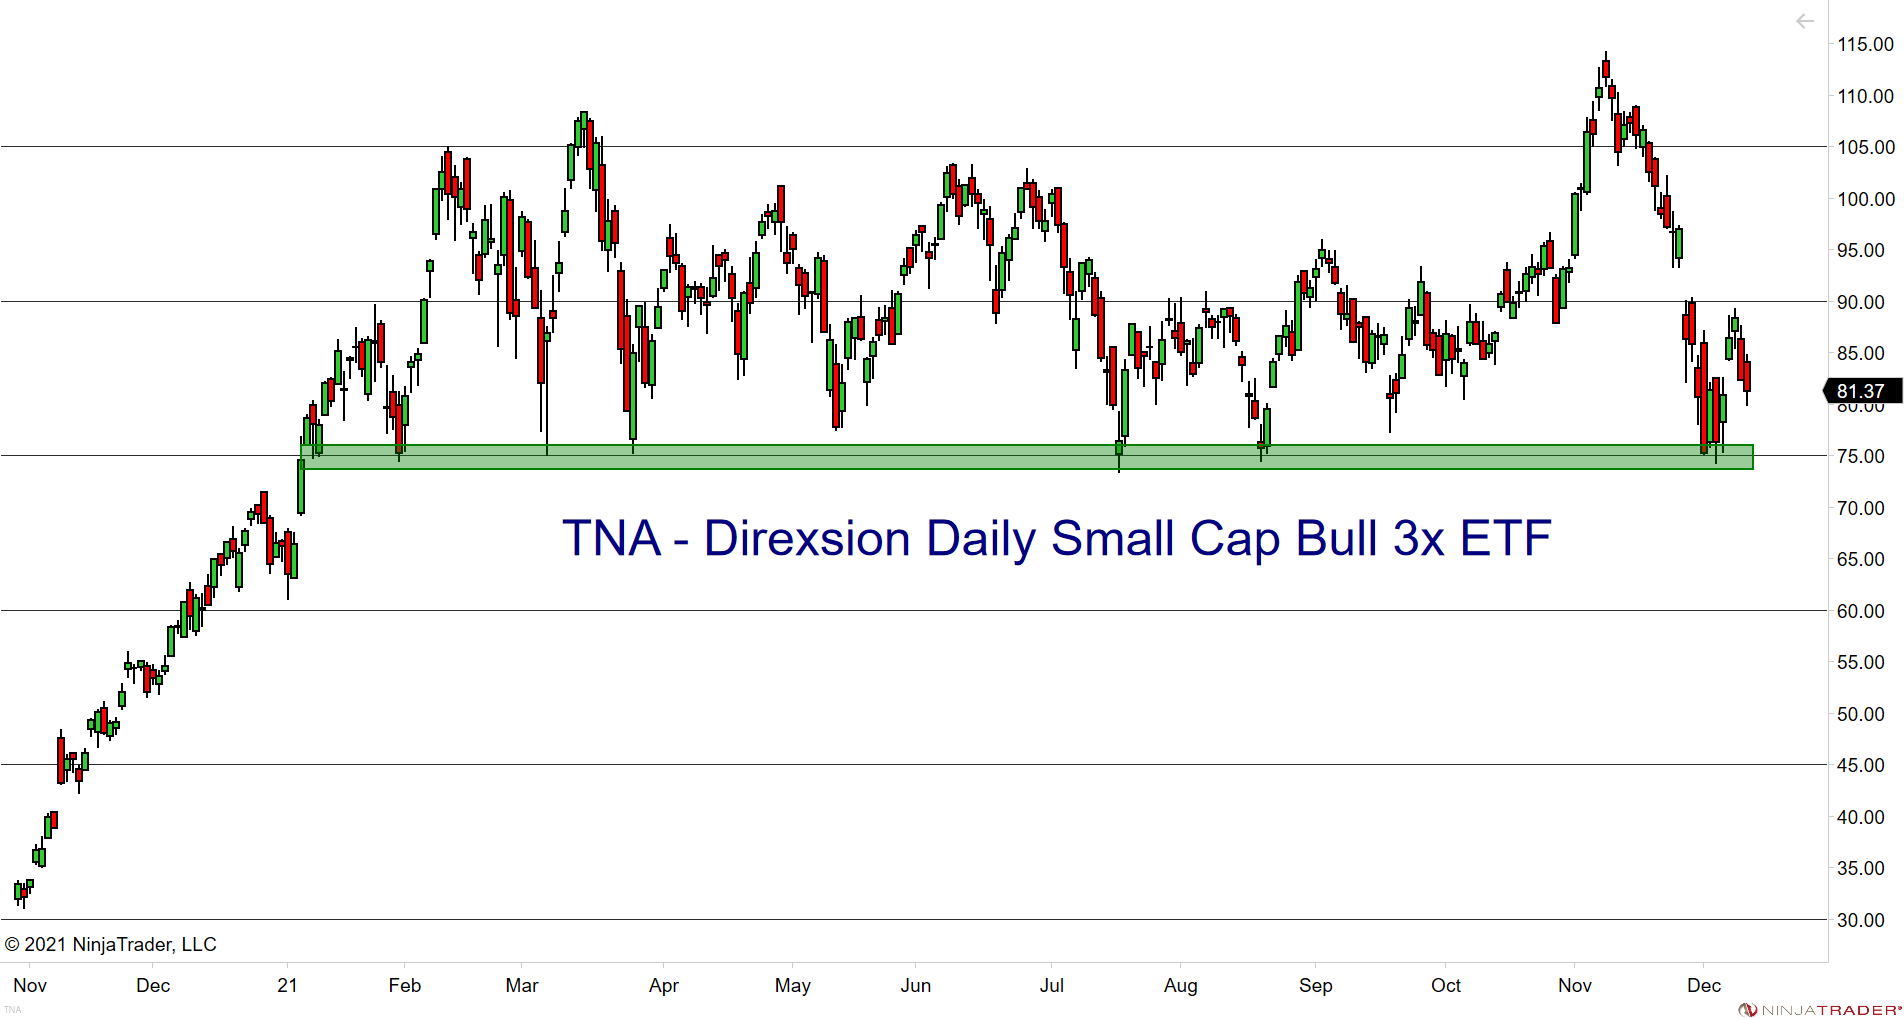
We have commented many times on the prolonged sideways move in small-cap stocks. Here we use the TNA (Direxion Daily Small Cap Bull 3x ETF) to show that the strong selling pushed small-cap stocks from new highs down into the support area. This support must hold for the market to make new highs into next year.
Decumulation - A Primer
We are so busy our entire lives accumulating assets for retirement that we focus little on decumulation or withdrawing assets from our retirement savings. I have put together a schematic primer to get you started, and you can read my book if you wish to dig deeper.
I began with the US Bureau of Labor Statistics (BLS) data on household expenditures. Then, I used their 2020 data and rearranged it to show the big-ticket items in percentage terms. The summary shown below gives us a template for the relative weights of typical family expenditures.
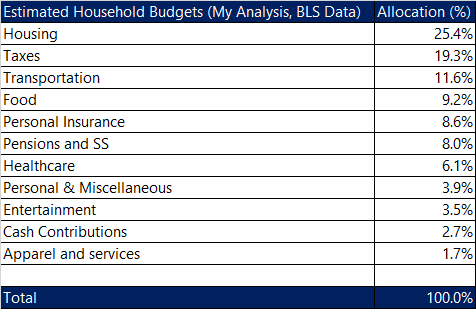
We can use the above table to simulate how your expenses might change in retirement. For example, the taxes you owe will almost certainly be different in retirement. I have arbitrarily rearranged the above table to create one possible scenario but cast it as a percentage of pre-retirement income.
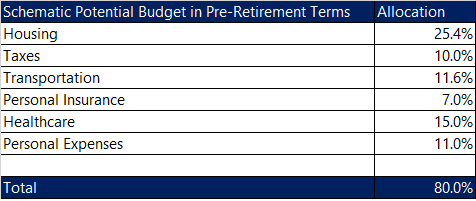
The focus of the above table is to draw your attention to two items: 1) overall expenses will probably decline, but 2) the big-ticket items still carry over. I recognize that my tax adjustment is arbitrary. I have increased healthcare expenses, also arbitrarily, but the idea is to illustrate how the expenses might shift as you look ahead and give you topics to explore or adjust. For example, you could reduce housing costs and state taxes simply by moving, as many snowbirds are wont to do. So, visualizing how your budget might change is a good place to begin and could strongly influence your decumulation needs.
And now to decumulation, which means managing how you withdraw from your retirement savings. First, imagine you have $100 in your retirement kitty, and, for simplicity, we assume you make the withdrawal only once each year for the next thirty years. Our decumulation goal is to ensure that you do not outlive your initial capital. Then, you can take three different schematic approaches to design your withdrawal scheme: changing the dollar amount, changing the percentage of capital withdrawn, or adapting the withdrawal to portfolio gains (or losses).
In this scenario, you could withdraw, each year, a specific amount (say $4), or a specific percentage of the balance (say 4%) or, some function of the change in your portfolio during the previous year (auto-adjust to portfolio returns).
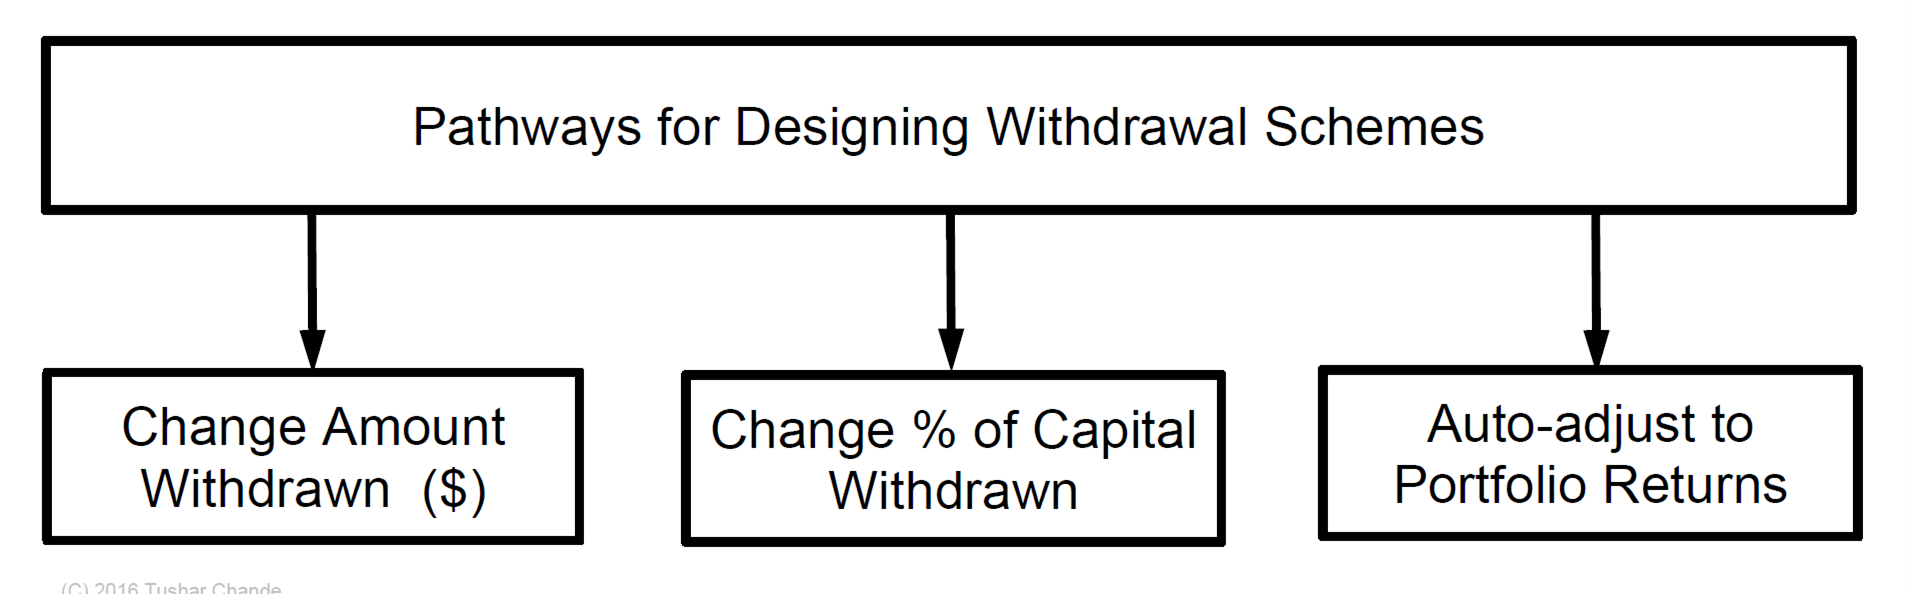
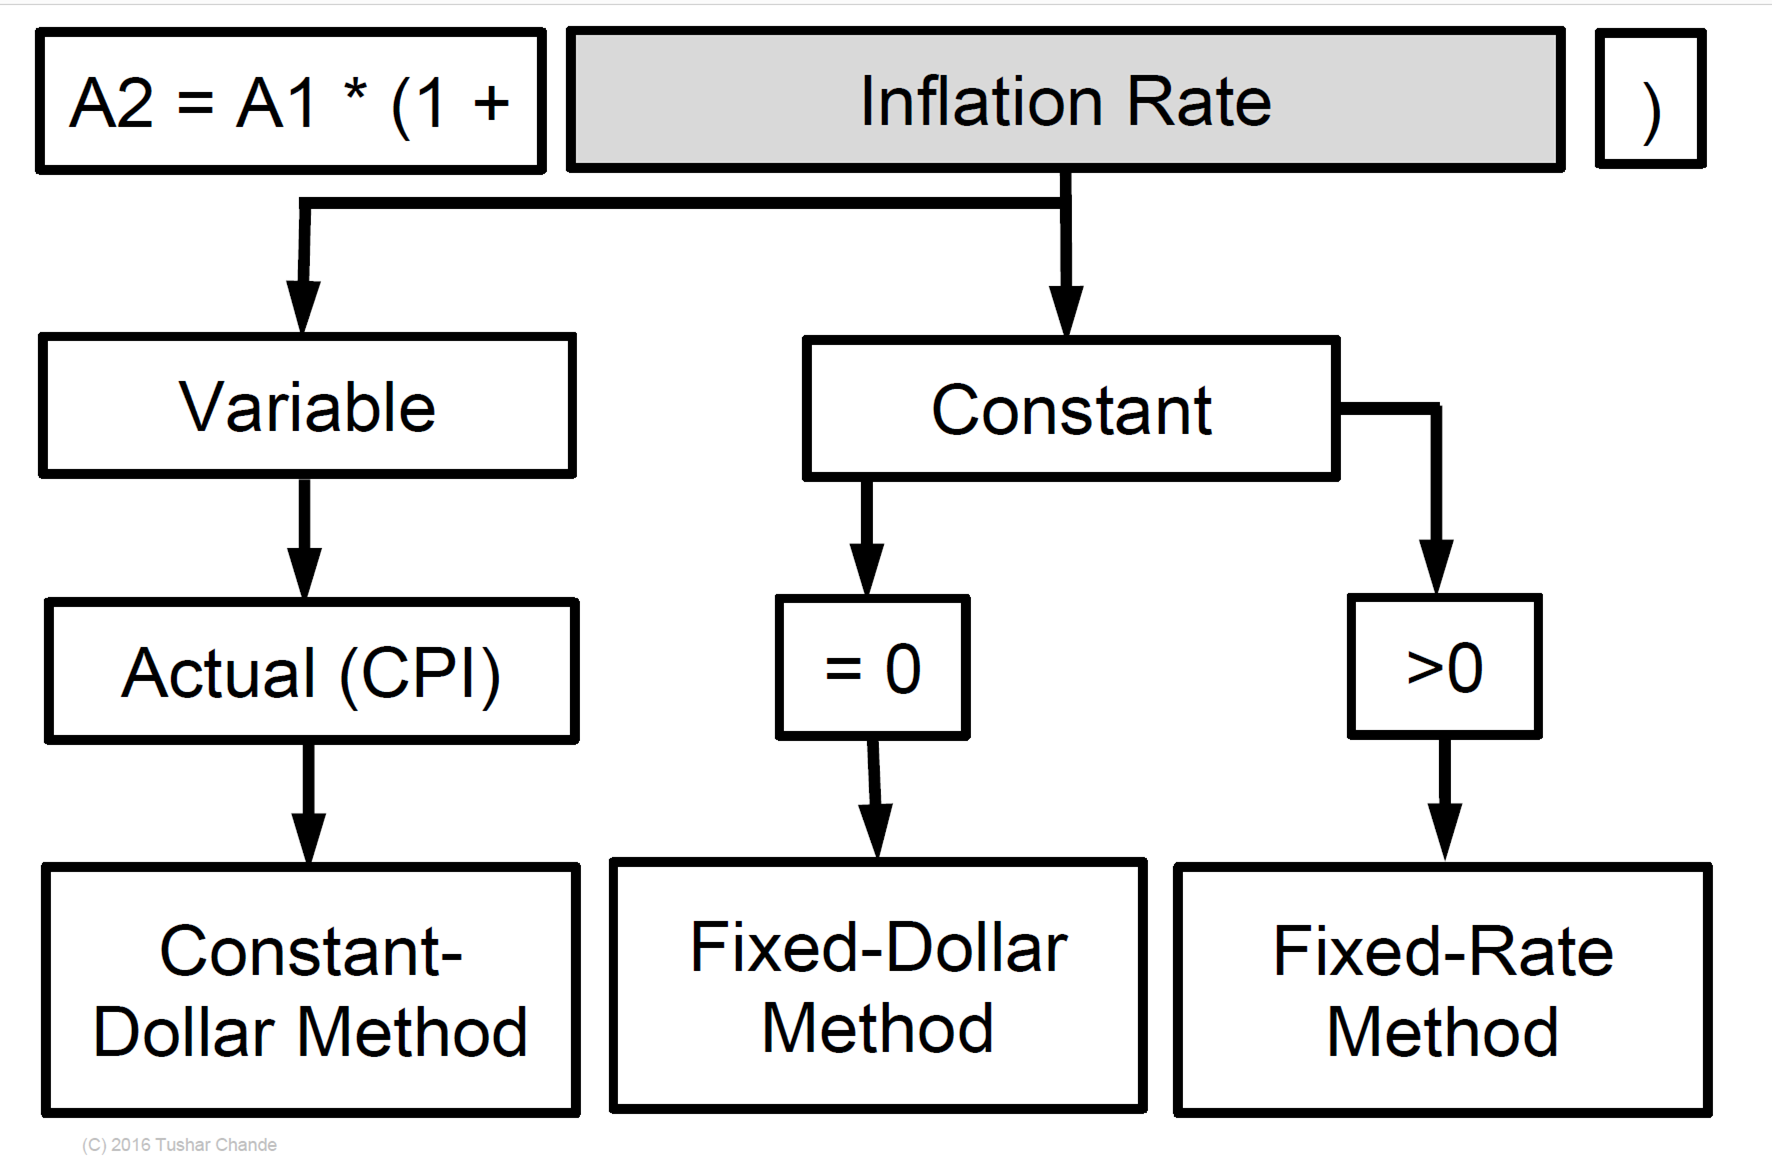
What does this mean, exactly? The first pathway, change in the actual amount withdrawn, gives us a few of the most common methods of decumulation: fixed-dollar method, constant-dollar method, and fixed-rate method. You can easily trace the algorithms below (A2 is the current year withdrawal, and A1 is the prior year withdrawal; A2 = A1*(1+IR) where IR is the assumed inflation rate). Looking at this equation, we see that IR can be a constant or a variable. We get the constant-dollar method is we use the actual inflation rate (IR is variable). Assuming a constant inflation rate equal to zero gives us the fixed-dollar method, whereas using a fixed but non-zero inflation rate gives us the fixed-rate method.
The second pathway is more complex since it directly engineers how capital is withdrawn from your starting amount. If we define the effective withdrawal rate (EWR) as a percentage of available capital, it can be constant, rising linearly, or rising non-linearly, as shown below. Essentially, you can create any profile for the EWR that you wish. For example, you might withdraw at a higher rate initially after retirement and a lower rate later on (not shown below).

Lastly, along the third pathway, you can tie the amount or percentage of capital withdrawn to market returns, but that is too complex for this post. So instead, I have done all the simulations going out to 30-year horizons, and you read my book for details.
This very brief primer should get you started. If you are still in the accumulation phase, my article on constructing a prototype target-date portfolio might be helpful. My website also has a portfolio calculator you can use for initial ideas.
Wrap-up
My posts should give you a good starting point, with context and suggestions if you like to do research. Then, you can visit my website, chandeindicators.com, for more information and ideas. I hope you stay tuned and help by subscribing and recommending it to your friends and colleagues.
Thank you for spending some time with me.
Disclaimer
And now for some housekeeping. This publication is for “edutainment,” education, information, and entertainment purposes only. It is not to be construed as investment advice. Past performance is not necessarily indicative of future results. Our disclaimer at chandeindicators.com is included herein by reference.